November 27, 2019 in Military O.R.
Measuring Military Readiness
Open standard representations of uncertainty: from “ready or not” to “how ready for what.”
SHARE: PRINT ARTICLE: https://doi.org/10.1287/orms.2019.06.07

For want of a nail the shoe was lost.
For want of a shoe the horse was lost.
For want of a horse the rider was lost.
For want of a rider the message was lost.
For want of a message the battle was lost.
For want of a battle the kingdom was lost.
And all for the want of a horseshoe nail.
The proverb “For Want of a Nail” reminds us that big things are made up of seemingly mundane details. The U.S. military currently uses “readiness reports” to communicate the cumulative effects of details on its big things. However, the word “readiness,” like the word “risk,” is inconsistently defined and discussions and planning around this topic are often ambiguous [1]. Even when the answer to “ready for what, by when, for how long?” is clear, resulting reports can be unsatisfying [2]. Fundamentally, what the military wants from its readiness system is the capability to calculate and communicate the cumulative impacts of details, such as nail availability, on big things, like kingdom survival.
Open standard representations of uncertainty now make it possible to roll up analytical models like Lego blocks into larger models (see sidebar) [3]. The services should embrace these representations and further develop them in the context of readiness accounting. These advancements could move military decision-makers from ambiguous estimates of “ready or not?” to unambiguously calculating, quantifying and communicating “how ready for what?”
How Does the Military Represent Readiness?
U.S. military units spend enormous time and effort managing their readiness, an effort that is expensive, perishable and “stove piped” [4]. Readiness status is reported to higher headquarters in areas as diverse as maintenance, material, training, manning, logistics, medical, dental and more [5].
Readiness requirements are generated through an extensive and formal process described in joint and service instructions [6]. To provide a common foundation for operational mission readiness requirements, the services formally define the Mission Essential Task Lists (METLs) required to be “ready.” Large, detailed lists of tasks are generated, which are organized with lower-level tasks that support higher-level tasks. In theory, Mission Essential Tasks provide a foundation to measure mission readiness.
Once tasks are defined, metrics and performance standards are created for each task. Units can report as “ready” for a task once that task’s performance standards are met or exceeded, typically demonstrated through measured unit performance during certified training events.
How Can the Military Readiness System Improve with O.R.?
Units often use nonadditive measures, including percentages and ratios, in readiness metrics. Such measures allow units to concisely communicate descriptions of their capabilities. However, combining nonadditive measures without additional context yields mathematically ambiguous results. For example, if a unit has a 60% chance of accomplishing a task, and another unit has an 80% chance of accomplishing the same task, what is the chance of accomplishing the task with both units available? Straightforward methods that rely on statistical independence don’t work because there can be complex interrelationships affecting the units. Therefore, any answer based on the chances alone will be mathematically ambiguous.
Furthermore, military readiness is often underfunded; these accounts have been raided to pay for other things like acquisitions and operations [1]. Suppose to save money, the kingdom in “For Want of a Nail” has been under-resourcing its messenger units. The Black Death caused a manpower shortage last year that continues to impact rider training pipelines. The king’s mercantilist policies have created a nail shortage. Under the existing reporting system, when messenger units have less than 70% of their horses and riders ready, they report as unready – the same report passed when no horses and riders are available at all. The king was briefed this morning that neither of his two messenger units is ready. Surely, even unready units or combinations thereof result in some ability to accomplish tasks, but what is it?
A Way Forward
Standard arithmetic allows us to aggregate known quantities, such as the historical number of riders available in each unit. But the number of riders actually available tomorrow is stochastic. As previously pointed out, straightforward methods result in mathematically ambiguous results when applied to readiness. Instead, aggregating the readiness of multiple units requires an arithmetic that accounts for chance.
Today, emerging techniques allow arithmetic to be performed on chances by leveraging computation, which is now ubiquitous [7]. This in turn allows small analytical models to be rolled up into larger models like Lego blocks [8]. These new techniques enable the arithmetic of chance for consolidating readiness across multiple units. Examples of nominal readiness roll-up models in Excel demonstrating this modular capability are available at https://www.probabilitymanagement.org/readiness.
A Future System of Readiness Reporting
While improved military readiness standards will be an evolutionary process with inputs from numerous stakeholders, we offer some key features that leadership should demand when selecting a new open source readiness representation. These recommendations account for chance, are logically consistent, and most importantly are simple enough for incremental adoption across the services.
Open Standard Data: The representation should use standard, cross-platform compatible data, and not require proprietary software to interpret. This will become increasingly important as the use of artificial intelligence grows. Additionally, the standard readiness data being reported must be stored in a common schema, allowing analysts to quickly wrangle the data for model development.
Actionable: Instead of binary ready or not, the representation should enable calculations involving the chance of readiness. Applications should be able to talk to each other, in that quantifiable results from one application can be easily incorporated into other analytical models, exercises and war games.
Additive: Using analytic tools, the arithmetic of chance becomes as simple as adding columns of data to get the readiness of combined units. Note that the columns capture the interdependencies between units. For example, a common shortage of horseshoe nails reduces the readiness of all units. You probably can’t do the required calculations in your head, or even with a calculator. They can, however, be easily done with a laptop and Excel, or Python or R or [insert your favorite computational platform here].
Auditable: The representation should have an audit trail with provenance. Is the source of the data being used authoritative? If it isn’t auditable, there may be no way to know.
Agnostic: The representation should be available in numerous non-proprietary formats such as Excel, CSV, XML, etc., and be accessible across software platforms [9].
An Example
 Let’s return to the kingdom in “For Want of a Nail.” Assume that a latter-day Connecticut Yankee appears two years before our story begins. She does not bring the knowledge of firearms as in Mark Twain’s version but carries a laptop. She tracks the readiness stats of the two rider units over time as shown in Table 1 because she knows that while past performance can’t guarantee future results, it’s often a good way to bet [10]. Of the 10 total riders comprising each unit, on average, only five and six respectively have been available, less than the required seven. Furthermore, from the data, she calculates a 21% chance that Unit 1 will be ready if called upon at random, with a 38% chance for Unit 2. “How ready do you want to be for what?” she asks the king. The king, a keen roulette player and no stranger to chance, responds, “I want a 75% chance of having enough riders ready for a possible invasion by the neighboring kingdom.” The king points out that even if they combined the two units, they would still only be ready with a chance of 21%+38% = 59%, not a number he wants to stake his kingdom on. She responds that these chances are not additive. But she does know of an open standard representation that can be used to calculate the readiness of combined units.
She represents each unit, not with a “ready or not,” but with a column of numbers that accounts for the variation in readiness. The two “Unit” columns in Table 1 are simply added together row by row to create the “Combined Units” column. This column representation is capable of accounting for chance, and results in a combined readiness of both units, not of 59%, but of 92% as shown in the table. This increased confidence prompts the king to conquer the neighboring kingdom.
It is worth noting that the Connecticut Yankee’s column representation of readiness is data source agnostic. The arrays of historical data used in the example can be replaced with thousands of rows of predictive data coming from simulations, regression models and machine learning algorithms. This representation is further enhanced using advanced data science techniques and avoids common data misrepresentations based on averages and nonadditive metrics.

Keep in mind it will be necessary to incorporate multiple interpretations of the underlying readiness data into readiness calculations. It would be naïve to think that subjectivity should be removed entirely. For example, there may be degrees of readiness under both favorable and unfavorable weather conditions, and then the best meteorological methods are used to determine the chances of either. This provides a structured approach to allow wiggle room by explicitly acknowledging uncertainty.
Additionally, readiness should not be conflated with risk tolerance. Commanders should not have the ability to “override” what the data say and proclaim that it will be sunny despite overwhelming evidence of rain. Instead, they will need to own up to the risks they face and declare that because of the predicted bad weather they will need to “improvise, adapt and overcome.” Quantifiable representations of readiness allow commanders at all levels to accept risk backed by analytical thinking, in contrast to purely intuitive thinking.
Conclusion
Planners, commanders and decision-makers should speak the same language when describing “how ready for what” their units are. The readiness system should be able to aggregate the readiness of multiple units while accounting for chance. To do so, the military should consider adopting column representations of readiness similar to the data of Table 1. This approach to readiness is additive, actionable, auditable, agnostic and capable of accounting for chance. Column representations could provide the military a comprehensive understanding of readiness at all organizational levels, allowing for mathematically sound aggregation and true representation of how ready for each task units really are. The military wouldn’t be alone in its efforts; while open standards are only now being developed to extend this approach to the public sector in general, similar databases of scenarios have been used in financial engineering and insurance to roll up potential liabilities for decades. By starting small and reinforcing success, adoption can organically grow at little cost. The column representation answers the question “How ready are my riders to deliver messages during a battle?” with the arithmetic of chance that yields 21%+38% = 92%. This approach would bring incremental value for measuring readiness in any military organization at which it was adopted.
Note: The views expressed here are the view of the authors and do not represent those of the U.S. Department of Defense or any other organization.
References
- Brad Carson and Morgan Plummer, 2017, “The Chickens are Ready to Eat: The Fatal Ambiguity of Readiness,” War on the Rocks, Dec. 7 (https://warontherocks.com/2016/11/the-chickens-are-ready-to-eat-the-fatal-ambiguity-of-readiness/).
- John C. Harvey Jr., 2013, “Get Real on Military Readiness,” War on the Rocks, Sept. 23 (https://warontherocks.com/2013/09/get-real-on-military-readiness/).
- Jordan Alen, Christine Cowsert Chapman, Melissa Kirmse, Farshad Miraftab and Sam Savage, 2016, “Probability Management: Rolling up operational risk at PG&E,” OR/MS Today, December (https://www.informs.org/ORMS-Today/Public-Articles/December-Volume-43-Number-6/Probability-Management-Rolling-up-operational-risk-at-PG-E).
- David B. Larter, 2018, “Flush with cash, the Navy bores in on aviation readiness amid a crisis,” DefenseNews, April 8 (https://www.defensenews.com/digital-show-dailies/navy-league/2018/04/09/flush-with-cash-the-navy-bores-in-on-aviation-readiness-amid-a-crisis/).
- Todd Harrison, 2014, “Rethinking Readiness,” Strategic Studies Quarterly, Fall (https://csbaonline.org/uploads/documents/Rethinking-Readiness.pdf).
- CJCSM 3500.04E, 2011, “Universal Joint Task Manual,” June (https://www.jcs.mil/Portals/36/Documents/Library/Manuals/m350004.pdf?ver=2016-02-05-175706-460).
- Sam Savage, 2012, “Distribution processing and the arithmetic of uncertainty,” Analytics, November/December (https://pubsonline.informs.org/do/10.1287/LYTX.2012.06.03/full/).
- Sam Savage, 2018, “Dr. Savage explains probability management in his Stanford webinar,” Probability Management video, Sept. 17 (https://www.probabilitymanagement.org/stanford-webinar-videos).
- Sam Savage, 2016, “Monte Carlo for the Masses,” Analytics, September/October (https://pubsonline.informs.org/do/10.1287/LYTX.2016.05.06/full/).
Open Standard for Column Representation of Uncertainty
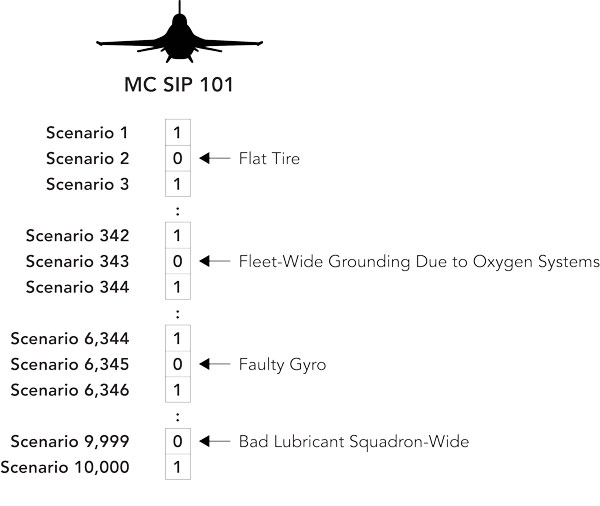 Nonprofit ProbabilityManagement.org has developed an open standard for communicating uncertainty as arrays of data called SIPs. These are columns of realizations that account for variations in outcomes and can preserve statistical relationships between variables. This standard allows for cross-platform sharing of stochastic data. In particular, native Excel can simulate thousands of trials per key stroke using SIP libraries. Visit probabilitymanagement.org/readiness to interact with several conceptual readiness models.
Shaun Doheney, CAP, is a Principal Analytics Leader at Amazon Web Services (AWS), where he leads a global business operations technology team. He is an INFORMS Certified Analytics Professional (CAP), Analytics Capability Evaluation (ACE) Coach, AWS Certified Machine Learning Specialty, and a Project Management Professional (PMP) with a B.S. in mathematics, M.S. in operations analysis, and a graduate certificate in data analytics. Leveraging these experiences and his 20+ years serving as an officer in the United States Marine Corps, Shaun continues to give back to the operations research and analytics communities, to include preparing numerous students on their CAP journey to pass the exam and earn their CAP credential. Maj. Sam Gray is a Marine logistics officer and an operations research analyst. He holds a master’s degree in operations analysis from Naval Postgraduate School in Monterey, Calif. He is currently serving as a program manager working for the Office of the Under Secretary of Defense, Research and Engineering. Lt. Cmdr. Connor McLemore is an E-2C naval flight officer with numerous operational deployments during 19 years of service in the U.S. Navy. He is a graduate of the United States Navy Fighter Weapons School (Top gun) and an operations analyst with master’s degrees from the Naval Postgraduate School and Naval War College in Newport, R.I. He is currently with the Office of the Chief of Naval Operations Assessment Division (OPNAV N81) in Washington, D.C. Dr. Sam L. Savage is Executive Director of 501(c)(3) nonprofit ProbabilityManagement.org at which Harry Markowitz was a co-founding board member. He is author of The Flaw of Averages – Why we Underestimate Risk in the Face of Uncertainty and Chancification – Fixing the Flaw of Averages. Dr. Savage is the inventor of the Stochastic Information Packet (SIP), a standardized data structure for conveying uncertainty. He is an Adjunct at Stanford University’s Engineering School and holds a PhD from Yale University in the area of Computational Complexity.