
January 5, 2015 in Five-Minute Analyst
Battleship
SHARE: PRINT ARTICLE: https://doi.org/10.1287/LYTX.2015.01.14
I had the opportunity to play Battleship with two boys in my family. For those who may not be familiar, Battleship is a board game played in two stages. First, each player places their fleet of five ships covering a total of 17 squares on a 10×10 grid without their opponent seeing. Ships may be placed along rows or columns but not diagonals. Then, players call out grid squares to “shoot” at, and the other player reports if it is a “hit” or a “miss.” It is presumed that the players are honest. The research question is: How can we tell if another player is being dishonest? (Note: this project was much more fun than I expected it to be!)
The basics: When there are no hits on the board, 17/100 = 17 percent of the spaces are occupied. A first approximation or “naïve” plan would say that the expected number of shots until the first hit is 1/.17 = 5.8. This is slightly inaccurate, because the shots are not independent. A finite population adjustment shows that the expected number of shots is approximately 5.3. This is a minor – but noticeable – difference in the number of times to first hit. I would begin to seriously suspect (95 percent confidence) that my opponent was cheating if I did not score a hit in the first 15 attempts, and would be almost certain (99 percent confidence) he was cheating if I did not score a hit in the first 22 shots.
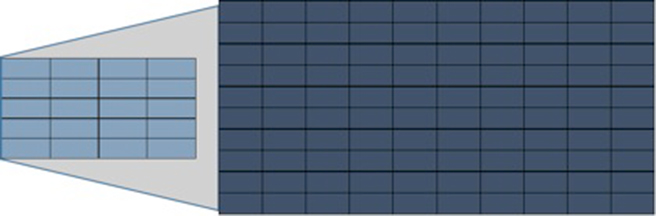
Can we do better? Yes! Each ship is rectangular, and can only inhabit squares that are along ranks or files (like rooks in chess). The way to handle this is to pick shots along diagonals (like bishops in chess). If we have already shot and missed in a particular square, say, A1, then we don’t have to shoot at A2 or B1. For example, if we are most interested in hitting ships three or more lengths in size – submarine, cruiser, battleship and carrier – then we may “skip two” and “cover” the board in 33 shots (see Figure 1).
We can think of this as superimposing a couple of different games on top of each other; for example, in the carrier case (skip four), it would look something like this:
The general method for determining the probability of hit in the next round, given no hits in the preceding rounds, is to determine the probability of hit for each ship type, and the key intuition is that for ships that are three or larger, the scheme shown in Figure 1 effectively “covers” three spaces on the board after the first shot, which always covers just one (why?). The general formula is:
![]()
The formulae for the other spacing are similar.
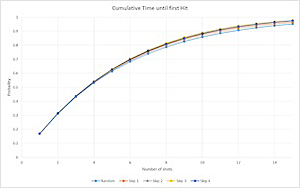
We can compare these approaches, and see that they all perform remarkably similar; the five-space approach is slightly better for achieving the first hit.
We have only considered the time until the first hit. While beyond the bounds of this analysis, my sense is that “skip two,” as depicted in Figure 1, is the optimum game playing strategy. This strategy has a possibility of missing the two-square “corvette” ship, but will certainly hit all the others. This is an area ripe for further analysis.
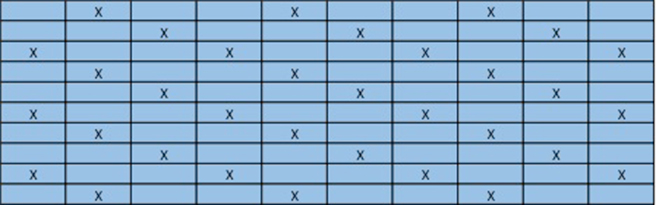
Defending along the rows: What does it mean to be “maximally random?” There are different interpretations, but one way might be to make the groupings along the rows and columns of the board fit a Poisson distribution with =1.7. A perfect fit is not possible because at least one of the rows or columns will have a “5” due to the carrier, which only has a .3 probability of occurrence. This turns out to be an optimization problem that exceeds the bounds of the Five-Minute Analyst. This problem is very similar to solving Sudoku with optimization. Below is a candidate solution and its performance measured by the Poisson metric.
In conclusion, this piece has brought up more areas for analysis on this topic than presented answers. Hopefully you will think differently about Battleship next time you play.
Bonus: If you don’t have your computer handy while you are figuring out which strategy has the greatest rate of improvement, you can appeal to calculus. The proposed strategies are of the form![]() . Differentiate, yielding
. Differentiate, yielding![]() and evaluate at a convenient place, say, n=1.
and evaluate at a convenient place, say, n=1.
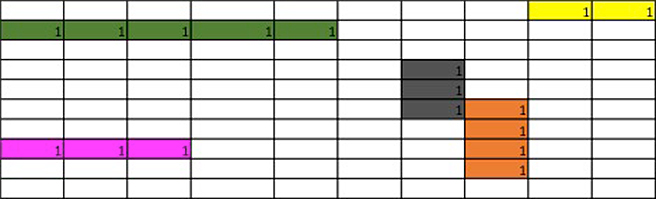
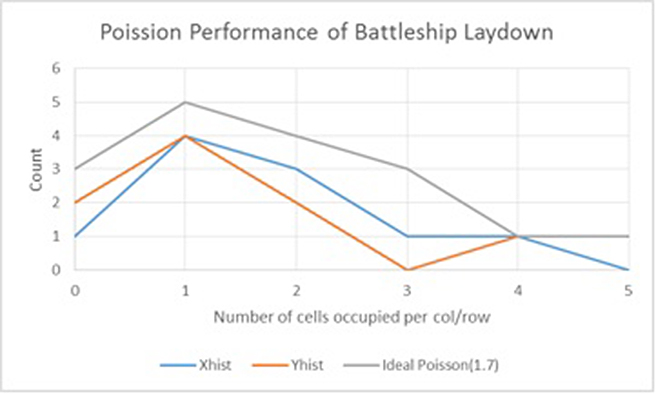
 is shown in gray, with the row and column distributions shown in blue and orange, respectively.
Harrison Schramm, CAP, PStat, is a senior lecturer at Naval Postgraduate School, splitting his time between Defense Management and Operations Research where, in addition to teaching, he runs the Contested At-Sea Logistics Lab (CASLL). He served as the inaugural chair of the INFORMS Security Conference and is a past president of the INFORMS Analytics Society.
([email protected])