
April 3, 2006 in INFORMS News
Probability Management
SHARE: PRINT ARTICLE: https://doi.org/10.1287/orms.2006.02.17

Small models linked through their input and output distributions create coherent networks of models that identify enterprise-wide risks and opportunities.
In the first article in this series [1] we presented the seven deadly sins of averaging. To counter them, we introduced the concept of Probability Management, which focuses on estimating, maintaining and communicating the distributions of the random variables driving a business. We presented the three underpinnings of probability management as follows:
- interactive simulation: illuminates uncertainty and risk much as light bulbs illuminate darkness.
- centrally generated stochastic libraries of probability distributions: provide standardized probability distributions across the enterprise, much as the power plants provide standardized sources of electricity to light bulbs.
- certification authority: analogous to the power authority that ensures that you get the expected voltage from your wall socket. We refer to the person or office with this authority as the Chief Probability Officer or CPO.
In this article, we discuss each of these areas in more detail and then finish with a short discussion of the potential for Probability Management in regulation and accounting.
Interactive Simulation
Analysts in academia and industry have never been shy of creating large and complex models, but they often fail to address how senior executives are going to interact with them. This is particularly difficult when the output of the model is probabilistic.
In "Action in Perception" [2], the philosopher Alva Noë argues that without action on the part of the observer, there can be no perception. He describes an experiment in which two kittens are presented with the same visual environment, but only one of the two can interact with it by walking on a turntable. The other is suspended just above the turntable. By the end of the experiment, the suspended kitten has not learned how to process visual information and is effectively blind. No wonder managers have so much difficulty understanding and communicating uncertainty and risk. After all, how do you interact with a probability distribution?
Interactive simulation may be the answer. The "exploration cockpit" at Shell, described in our earlier paper, allowed managers to select or deselect projects with a mouse click. The resulting portfolio was then driven through repeated copies of Excel formulas, where each repetition was driven by a separate row of pre-calculated Monte Carlo trials in the stochastic library. The statistical properties of the portfolio were immediately apparent through the graphical interface. If, however, as part of a sensitivity analysis it is desired to change underlying econometric parameters like the future distribution of oil or gas price, the stochastic library and the associated universe of portfolios has to be regenerated. This procedure is currently too slow from a computational standpoint to qualify as interactive in a decision-making setting. It is hoped that new simulation technology described below, coupled to ever-faster computers, will expand the envelope of interactive exploration.
Another firm using interactive portfolio simulation is Bessemer Trust of New York. Bessemer has a model for displaying the implications of various wealth management strategies for its clients. According to Andrew M. Parker, managing director and head of Quantitative Strategies at Bessemer, "one significant drawback with most simulation software is that it can be time consuming. This can overwhelm the potential to easily compare and contrast different scenarios. Having an interactive model dramatically solves this problem."
Although the interactive portfolio models at Shell and Bessemer have proven successful, they were complex to develop and maintain. Furthermore, it would not be easy to generalize the approach beyond the modeling of portfolios. This appears to be about to change.
One of the founding fathers of the spreadsheet revolution has developed technology that automates the process of interactive simulation. Dan Fylstra, CEO of Frontline Systems and co-developer of VisiCalc, has introduced technology (see story on page 62) that almost instantly runs thousands of Monte Carlo trials every time you modify an input to a normal spreadsheet model. This will allow a large managerial audience to start interacting with - and hopefully sharpening their perception of - probability distributions.
Stochastic Libraries
Interactive simulation makes Monte Carlo simulation so effortless that virtually any Excel user should be able to master it. But simulations without acceptable input distributions are like light bulbs without electricity. Only a few people within an organization have the expertise to estimate probability distributions, and even fewer have the managerial authority to get their estimates accepted on an enterprise-wide basis. For this reason, the authors expect interactive simulation to reach its full potential only in organizations that invest in the capability to generate and manage probability distributions centrally. The entire discussion assumes that the distributions and business models involved have statistical properties that ensure that simulations will converge. Although in theory there are examples where this is not the case, it is rare to find them outside of a class in probability theory.
Coherent modeling - preserving relationships.
In the last article, the authors presented their coherent modeling approach to managing stochastic libraries. This offers the benefits of enterprise-wide modeling of statistical dependence, the roll-up of probability distributions between levels of an organization and a stochastic audit trail.
The multivariate distributions driving the firm are stored in a stochastic library unit, with relationships preserved, or SLURP. In its simplest form, this is a matrix of pre-generated Monte Carlo trials, with one column for each uncertain business driver, and one row per trial.
Demographers use SLURPs as a matter of course. They call them "representative samples." A representative sample of, say, 10,000 U.S. citizens can be used to generate a SLURP for such quantities as income, education, family size, voting behavior, etc. - with all relationships preserved. One can think of a SLURP for business planning as a "representative sample" of the possible futures.
Modeling dependence: We come to bury correlation, not to praise it.
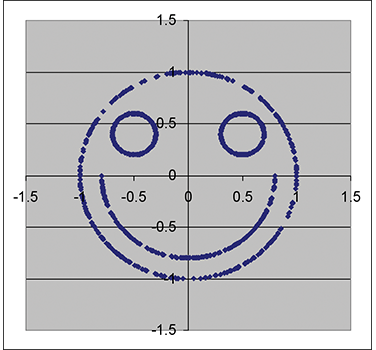
The simplest sorts of statistical relationships are measured by covariance or correlation, and in fact these terms have become synonymous with statistical dependence. However, there are many other types of relationships that can be represented in a SLURP. For example, Figure 1 displays the scatter plot of a SLURP of two random variables with a correlation of only .075, extremely low. Yet a relationship clearly exists, and has been preserved in the SLURP. In practice, structural econometric models may be used to generate SLURPs with more complex relationships than the linear one implied by correlation.
Time, the third dimension.
If the input uncertainties are time series, then it is convenient to represent the SLURP as a three-dimensional data structure analogous to a cube. Consider a model that takes as input the average annual oil prices and GDP over each of the next five years. The SLURP has a column for both oil price and GDP, a row for each trial, and a third dimension for the five time periods (see Figure 2).

analogous to a cube.
There are relationships between oil price and GDP, and oil price from one time period to the next. One trial is a rectangular "slice" in this three-dimensional cube, with oil price and GDP defining one side, and time defining the other.
Coherence and the fundamental identity of SLURP algebra.
A SLURP is said to be coherent, in that the statistical relationships between variables are preserved. Furthermore, this property of coherence propagates through models. For example, consider Division A of a firm that wishes to project revenue and costs one year ahead. Their spreadsheet business model is relatively simple in structure, but quite sensitive to both the future price of oil and level of the S&P; 500. Assume that the CPO of the organization has developed a SLURP of 10,000 trials of oil price and S&P; growth for the following year. This might be accomplished through a combination of structural econometric modeling and observed derivative prices [3]. When this SLURP is run through Division A's business model, it results in 10,000 pairs of revenues and costs. But these revenue/cost pairs are a SLURP in their own right because of the propagation principle (see Figure 3).
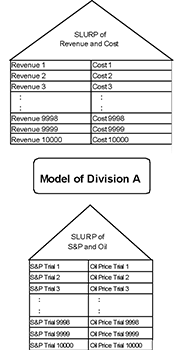
Figure 3: Through propagation,
10,000 pairs of revenue/cost pairs
become a SLURP in their own right.
As a consequence of coherence, separate divisions of a firm can each build stochastic models of their own business metrics, whereupon the output SLURPs can be merged into a central model that calculates enterprise-wide metrics (Figure 4).
Thus, stochastic models may be rolled up to higher levels. SLURPs can in theory be propagated, horizontally across hierarchies of organizations, vertically through supply chains, as well as dynamically forward in time.
We summarize this in what we call the fundamental identity of SLURP algebra as follows.
Let X = (X1 ... Xn) be a vector of uncertain inputs to a model represented by SLURP S(X), and let Y = (Y1 ... Ym) = F(X) denote the outputs of a model, F, that depends on X.
The SLURP of the outputs of F is found by evaluating F for each of the trials in the SLURP of X, or symbolically, S(F(X)) = F(S(X)).
The crucial argument is simple: The output SLURP F(S(X)) inherits the sample property from the input SLURP S(X), i.e. if all trials in S(X) have the same probability of occurring, then so do all trials in F(S(X)).
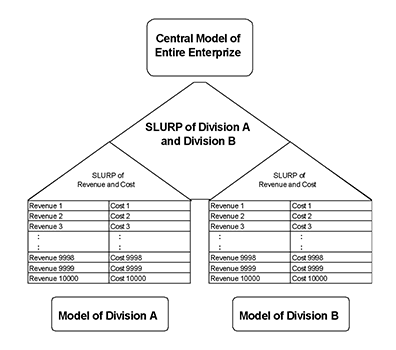
enterprise-wide metrics.
This identity is in stark contrast to the strong form of the flaw of averages (closely related to Jensen's Inequality), which states that E(F(X)) ≠ F(E(X)), where E(X) is the expectation of X and F is a non-linear function. It is this inequality that leads to many of the systematic errors embodied in the seven deadly sins of averaging, when single numerical values are propagated through an organization. Thus, the use of SLURPs cures the flaw of averages.
The Chief Probability Officer
You won't yet find this title in corporate organization charts, but some managers are already playing the role, and more will undoubtedly follow. A pragmatic trade-off between complexity and practicality must be applied to developing and certifying a firm's stochastic library. There are decisions in which a distribution of an uncertain business parameter, even if inaccurate, provides valuable insight. For example, when you shake a ladder to test its stability, you are essentially simulating the behavior of the ladder using a distribution of forces that differs from that when you actually climb on it. Nevertheless, you would be foolish to stop shaking ladders now that you have discovered you have been using the wrong distribution all these years. It is in this spirit that we encourage aspiring CPOs to be as precise as possible in estimating distributions. However, where precision is not possible, instead of reverting to point estimates, consider driving corporate models with either a less than accurate distribution, or simply through scenario analysis without any reference to probability [4]. The experiences at Shell and Bessemer are illuminating.
At Shell, the stochastic library had to be assembled from vast amounts of data gathered worldwide. The first decision was the level of granularity at which to model projects. The level chosen was the "exploration venture," which included a number of projects within a single geographical region. As the first step towards creating a stochastic library, the exploration engineers within each venture were responsible for providing initial estimates of the distribution of oil and gas volumes in that venture. When assembling distributions of possible hydrocarbon volumes and economic value of exploration, it is important to acknowledge the consequences of the "Prospector Myth" as described by Pete Rose and Gary Citron [5]. Explorers by their very nature are not only very optimistic, but also often fail to recognize the full range of possible outcomes of an exploration venture. Painting the numerical picture of an exploration venture and its various execution alternatives is a mélange of art and science underpinned by experience.
The distributions of hydrocarbon volumes were assumed to be independent across ventures. Conversely, the economic evaluations of the ventures have strong relationships resulting from global oil and regional gas prices. The volumetric distributions were converted to coherent distributions of economic output by using discrete distributions of oil and gas prices and associated drilling and development cost assumption. For the economic evaluations, the input parameters are distributed globally through a shared library updated on an annual basis.
To provide the assurance that the ventures and their execution alternatives are not only feasible as described, but also portray the cost and value elements appropriately, seasoned explorers and economists review the input to the coherent simulation that generates the stochastic library of outcomes for exploration ventures and their alternative execution plans. They will also engage in further dialog with the engineers and managers in the field to ensure consistency across ventures
At Bessemer, the situation was quite different. First, with financial portfolios there is rich historical data and a number of accepted approaches to modeling asset growth. The second difference was that the ultimate consumers of the information derived from the simulations were Bessemer's individual clients.
"In the wealth management business, it's extremely important to assure that clients understand the risk in their investment portfolios," says Parker, "and the only way to do this effectively is to use probabilistic modeling. To this end, having a centrally managed process with a shared library of asset distributions assures uniformity across the organization." Parker periodically updates this library, and distributes it to others in the organization to use in the simulation models that he also oversees. "This allows our client account managers to give robust, consistent answers without requiring a deep knowledge of statistics," Parker adds.
Probability Management in Regulation and Accounting
One typically thinks of simulation and stochastic analysis as pertaining to the core areas of management science, in particular production and finance. However, if the concepts and technologies behind probability management take root, probability management might eventually have an even more dramatic impact in the areas of financial regulation and accounting.
Regulators of financial intuitions and other organizations are concerned not only with the stability of individual firms within a given industry but also in the stability of the industry as a whole. Establishing coherent benchmark distributions of global economic factors would provide a uniform basis against which firms could be stochastically compared.
After the Enron fiasco, the U.S. Congress moved to increase transparency into the risks faced by publicly traded firms. The resulting Sarbanes Oxley legislation [6] mandated tighter adherence to Generally Accepted Accounting Principles (GAAP). Unfortunately, GAAP itself is permeated with examples of the flaw of averages [7, 8]. Although the accounting industry by its nature does not change quickly, there may be opportunities in this area for those with training in accounting, law and stochastic modeling [9].
Conclusion
As Terri Dial, CEO of Lloyds' retail bank puts it: "P&L; statements help to manage historically; business models help to manage currently." Yet too often, management science models, in their fixation with the right answer, grow so complex and rigid that they cannot keep up with current events. To manage "currently," the authors believe that asking the "right question" is more important than seeking the "right answer." Rather than a department of computer programmers devoted to building one big deterministic model of the enterprise, what is needed is a management culture that embraces the creation of manystochastic models as a way of asking questions. We like to think that probability management will ultimately allow suchmodels to be linked through their input and output distributions into coherent networks of models that illuminate enterprise-wide risks and opportunities.
Read the accompanying story: Interactive Simulation
Read Part 1 of Probability Management
References
- Savage, Scholtes and Zweidler, 2006, "Probability Management," OR/MS Today, Vol.33, No.1 (February 2006), www.lionhrtpub.com/orms/orms-2-06/frprobability.html
- Noë, Alva, 2004, "Action in Perception," The MIT Press.
- Melick, William R., and Thomas, Charles P., 1997, "Recovering an Asset's Implied PDF from Option Prices: An Application to Oil Prices During the Gulf Crisis," Journal of Financial and Quantitative Analysis, Vol. 32, No. 1 (March 1997).
- Schwartz, Peter, 1991, "The Art of the Long View: Planning for the Future in an Uncertain World," Doubleday.
- Rose, P. R. and G. P. Citron, 2000, "The Prospector Myth vs. Systematic Management of Exploration Portfolios: Dealing with the Dilemma," Houston Geological Society Bulletin (October 2000).
- www.aicpa.org/info/sarbanes_oxley_summary.htm
- Johnson, L. Robbins, B., Swieringa, R. and Weil, R., 1993, "Expected Values in Financial Reporting," Accounting Horizons, Vol. 7, pp. 77-90.
- Savage, S.L. and Van Allen, M., 2002, "Accounting for Uncertainty," Journal of Portfolio Management (Fall 2002).
- Savage, S.L. and Van Allen, M., 2006, "The Flaw of Averages in Law and Accounting," "Litigation Services Handbook: The Role of the Financial Expert, 4th Edition," published by John Wiley & Sons (Spring 2006). Editors: Roman L. Weil, Michael J. Wagner, Peter B. Frank, Christian Hughes.
Interactive Simulation
Computing breakthrough does for probability distributions what the spreadsheet did for numbers.
In the mid-1980s, @Risk from Palisade [1] brought Monte Carlo simulation to Lotus 1-2-3. I recall replicating the six months of Fortran programming required for the simulation at the heart of my Ph.D. dissertation in about 30 minutes in 1-2-3. Crystal Ball from Decisioneering [2] was introduced shortly thereafter. These industrial software packages, backed by strong customer support, helped introduce a generation of managers to this important analytical technique. In an effort to spread the use of Monte Carlo even further, I introduced my own smaller simulation packages, including XLSim, with an eye on simplicity of use rather than power [3]. All of these packages follow the same overall flow of operation:
- Build a model in Excel.
- Specify certain cells to contain random variables inputs, and other cells to be tracked as outputs.
- Run a pre-specified number of trials and wait for the results.
- Create and display statistics of the output cells.
In the mid-1990s, I began experimenting with a different paradigm using the built-in RAND() function in Excel. A new simulation was run each time the user changed the spreadsheet in any way. I called the interactive histograms that resulted "Blitzograms" [4], and for very models they provided insights available no other way. As computers became faster, I began to apply interactive simulation to a few real-world applications. Building these models required copying literally thousands of formulas, but my consulting clients loved being able to interact with probability distributions on a gut level. I even developed a prototype system that ran a thousand Monte Carlo trials through an arbitrary spreadsheet model after each user input. The prototype revealed the true complexity of the project and convinced me that my time would be better spent on that half-finished perpetual motion machine in my garage.
Now, in what may be the start of a trend, Frontline Systems has put its Risk Solver Engine (RSE) for Excel into public beta test at www.solver.com/rse. This software performs a new simulation whenever the user changes the spreadsheet, and does so extremely quickly, thanks to Frontline's proprietary PSI [5] technology, which already powers the "Extreme Speed" mode of Crystal Ball. According to Dan Fylstra, Frontline's CEO, "We evaluate all the Excel formulas in the model, for all simulation trials in parallel." I'm glad I didn't try this at home.
I did not have much time to test the software before we went to press, so I will describe my experience with amodel demonstrating a classic example of the flaw of averages from my tutorial on risk and uncertainty. This example shows what can happen if you make a capital investment in capacity based on average demand. If demand is less than this average, you won't make your numbers. And the kicker is that if demand exceeds the average, you won't have the capacity to serve the additional customers, so there is no upside (see deadly sin number 5 in [6]). The flaw of averages in this case dictates that average profit is less than the profit associated with average demand. The model is shown in Figure A and described in more detail in [7].
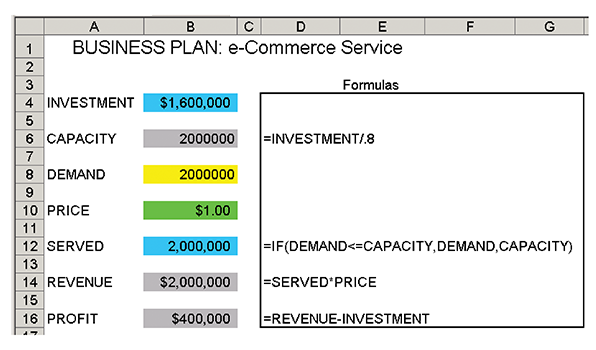
Figure A
It takes three short steps to detect the flaw of averages in this interactive environment:
- Enter the formula =PsiNormal(2000000,500000) in cell B8 to indicate the distribution of demand.
- Add PsiOutput() to the beginning of the profit formula in cell B16. This is flags the cell to be tracked during simulation. The formula would now read: = PsiOutput() + REVENUE-INVESTMENT
- Enter the formula =PsiMean(B16) in B18.
At this point, a number of things happen over a short period of time. Actually 10,000 things in a fraction of a second to be exact! This is the parallel evaluation of Excel formulas described earlier. Once that is accomplished, PsiMean dutifully calculates the average profit over all 10,000 trials (see Figure B). And this all takes place essentially instantaneously on my 1.6 Gigahertz Thinkpad!
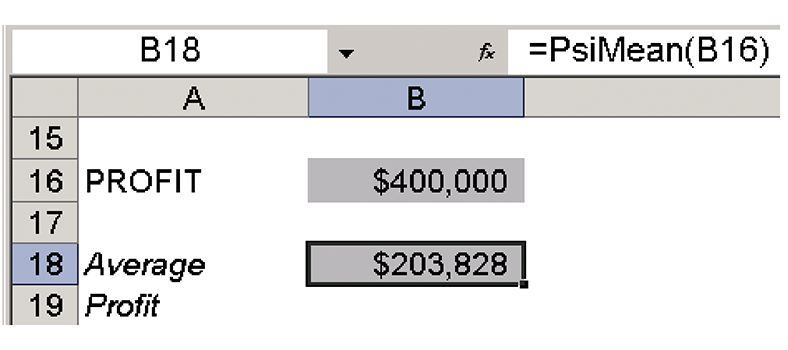
Figure B
If you have time on your hands, you may want to run 1 million iterations, but the two seconds required just isn't interactive enough for me. By simulation model standards, this example is trivially small. So I tried replacing the PsiNormal formula with the sum of 100 independent PsiNormals, and at 10,000 trials (1 million normals generated) it took a prohibitive three seconds. Then I returned the number of trials to the default of 1,000 and got back into the acceptable few tenths of a second range.
Excel of course already provides statistical functions for ranges of data, such as Average and Percentile. Think of interactive simulation as allowing you to apply statistical formulas to single cells, which, of course, now contain samples of probability distributions (see Figure C).
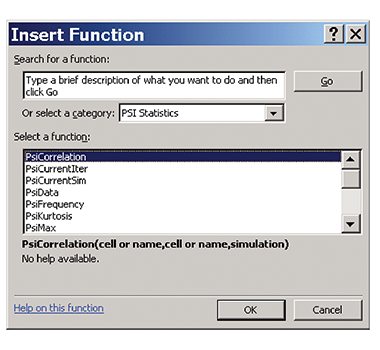
Figure C
Perhaps my favorite of these is PsiFrequency, which produces a histogram (well blitzogram, actually) of a selected output cell, relative to a set of bin values. I used this feature to create a doubly interactive model by linking a spinner to the investment level in the model described above. If you are not already using Excel's spinners, slide bars, etc., they are a great way to make a deterministic model interactive by controlling the numeric value of a cell. But in this version, every click of the spinner yielded another 10,000 Monte Carlo iterations.
I started with an investment level of $1 million to get the histogram in Figure D based on 10,000 trials.
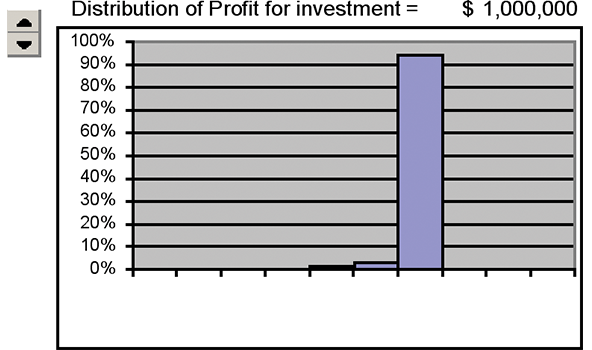
Figure D
Then, click, I raised investment to $1.2 million and another simulation ran for a total of 20,000 trials (Figure E).
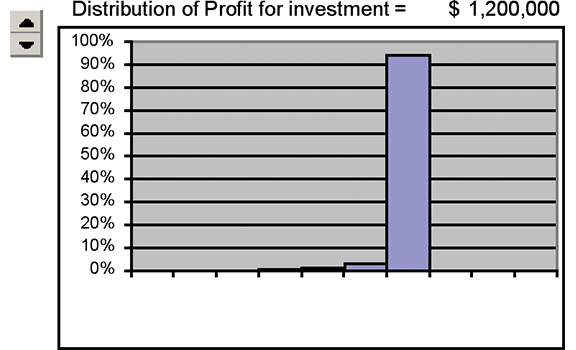
Figure E
Then click, click, click, click, as fast as I could go, for investments of $1.4, $1.6, $1.8 and $2 million. I had run 30,000, 40,000, 50,000, 60,000 total trials, with the resulting histograms displayed in Figure F. This quickly shows that an investment of $1.2 million yields a high average profit with minimal downside risk.
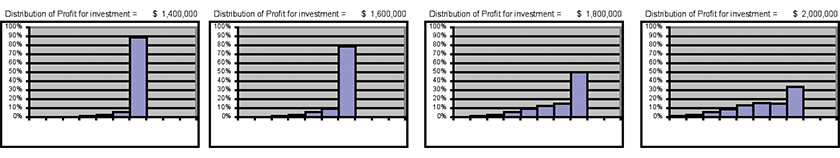
Figure F
RSE also supports many distributions beyond the Normal (see Figure G for a partial list). Of particular interest to me is PsiSlurp, which reads trials directly from a stochastic library, which is compatible with the coherent modeling approach to Probability Management.
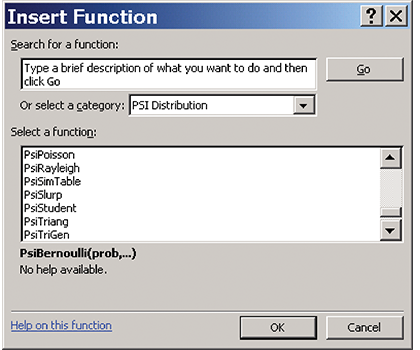
Figure G
By this point, the discerning reader may have concluded, due to my enthusiasm, that I am not an unbiased observer. That is an underestimate. I can't wait to try this and other potential offerings of interactive simulation in applications with my clients and in my management science class next fall. I believe it will promote the growth of Probability Management, thereby increasing my consulting income, making me famous, and more attractive to members of the opposite sex. But that's just my opinion. Since the beta test is open to the public, you may wish to form your own.
But seriously folks, lots of good ideas take years to gain acceptance. For example, in spite of the obvious difference between $1 million in cash and $1 per year for a million years, it required decades for the idea of Net Present Value to catch on. First, we had to wait for the NPV key on the pocket calculator to arrive. Secondly, the CFOs had to come up with credible discount rates to use in the calculations. Interactive simulation is the NPV key for Probability Management. The question now is how long it will take for the CPOs to come up with credible distributions.
So is conventional simulation a thing of the past? Far from it. I believe the CPOs are going to generate their SLURPS the conventional way. The SLURPS will then be distributed to the end-user, where interactive simulation will be the order of the day.
Return to the main story: Probability Management - Part 2
References
- www.palisade.com/
- www.decisioneering.com/
- www.AnalyCorp.com
- Savage, Sam L., 2001, "Blitzograms: Interactive Histograms," INFORMS Transactions on Education, January 2001, http://ite.pubs.informs.org/Vol1No2/Savage/Savage.php
- www.solver.com/rse
- Savage, Scholtes & Zweidler, 2006, "Probability Management," OR/MS Today, February 2006, Vol. 33, No.1, www.lionhrtpub.com/orms/orms-2-06/frprobability.html
- Savage, S.L., "Understanding Uncertainty Through Simulation, Section III," http://analycorp.com/uncertainty/
Dr. Sam L. Savage is Executive Director of 501(c)(3) nonprofit ProbabilityManagement.org at which Harry Markowitz was a co-founding board member. He is author of The Flaw of Averages – Why we Underestimate Risk in the Face of Uncertainty and Chancification – Fixing the Flaw of Averages. Dr. Savage is the inventor of the Stochastic Information Packet (SIP), a standardized data structure for conveying uncertainty. He is an Adjunct at Stanford University’s Engineering School and holds a PhD from Yale University in the area of Computational Complexity. Stefan Scholtes is director of Ph.D. programs at the Judge Business School, University of Cambridge (U.K.). Daniel Zweidler is head of global exploration planning and portfolio for Shell, where he helps define the exploration investment case for Shell, merging regional exploration realities and imperatives with new country access opportunities and the competitive landscape. He is responsible for delivering the global exploration and EP growth business plan.