
April 9, 2018 in International O.R.
Drivers of CO2 emissions in post-Soviet countries
SHARE: PRINT ARTICLE: https://doi.org/10.1287/orms.2018.02.04
Carbon dioxide (CO2) is the most significant greenhouse gas in the Earth’s atmosphere. CO2 is among those atmospheric gases associated with the so-called greenhouse effect, which some argue may result in catastrophic climate change to the detriment of humanity. The main anthropogenic source of CO2 emissions into the atmosphere (more than 90 percent) is the burning of fossil fuels (coal, oil and natural gas) for energy production, and CO2 is often a topic of discussions in the international environmental community. This article examines the drivers of carbon dioxide emissions from fuel combustion in the group of 15 post-Soviet countries.
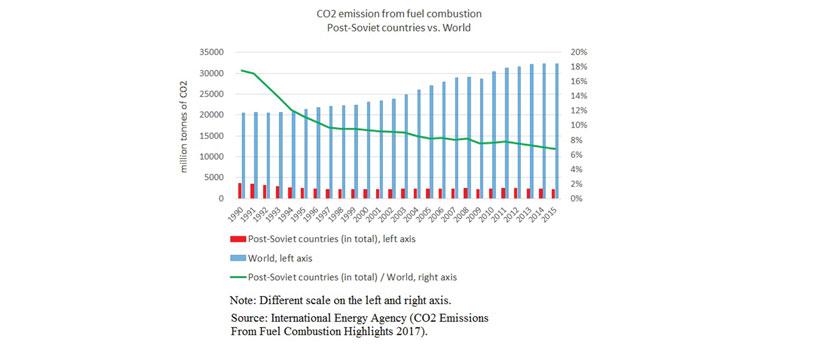
Why did the co-authors choose this type of pollutant to examine and why should the post-Soviet era merit investigation? Because according to the International Energy Agency, in 1990 (prior to the collapse of the USSR) the Soviet Union contributed 3,606 million tons of CO2, or 17.6 percent of the global total CO2 emissions. By 2015, the total emissions of the 15 post-Soviet countries amounted to 2,200 million tons, or 6.8 percent of the global total. The 15 countries represent an unprecedented example of reducing CO2 emissions against the backdrop of a significant increase in emissions worldwide (see Figure 1). One could say that the collapse of the USSR was one of the world’s most effective measures of combating greenhouse gas emissions, global warming and climate change.
Undoubtedly, the decline in production after the collapse of the USSR was a very significant factor in reducing energy consumption and CO2 emissions. However, this argument is basically correct only for the period from the early to mid-1990s. According to the World Bank, by 2015, only Georgia, Moldova and Ukraine had not restored their GDP at purchasing power parity (PPP) to 1990 levels. Thus, other reasons for reducing CO2 emissions for energy production in this group of countries need to be found.
Energy-Intensive USSR
The USSR had high CO2 emissions because the Soviet economy was one of the most energy intensive in the world. Vast energy resources were distributed among its far-flung republics; meanwhile, a planned economy, with low, uniform domestic energy prices, disincentivized efficient energy use.
After the collapse of the USSR, the single, massive economic space disappeared. Those former Soviet countries that were rich in fossil fuels structured their economies around fossil fuels. Other countries were forced to buy from the resource-rich, owing to geographic factors and the established energy infrastructure.
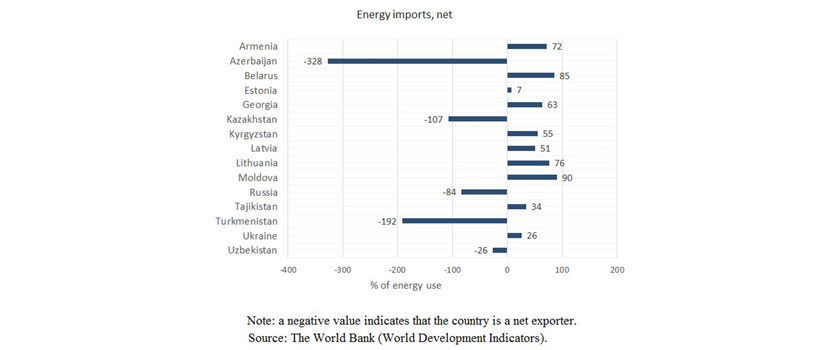
Russia, Kazakhstan, Turkmenistan, Azerbaijan, Uzbekistan and Ukraine have significant reserves of fossil fuel on a world scale. Estonia, although not renowned as a country rich in fossil fuel, has significant oil shale reserves, which form the basis of its energy. The combustion of oil shale releases more CO2 into the atmosphere than any other primary fuel. All these five countries, except Estonia and Ukraine, are net exporters (energy exports exceed imports); the rest of the post-Soviet countries do not have fossil fuel reserves and are net importers of energy.
The collapse of the USSR resulted in very irregular economic, institutional and social development. The planned economy was replaced with rapid liberalization in trade policies, prompting both the introduction of new clean technologies, as well as "importing" polluting industries from countries with more stringent environmental policy – the so-called pollutant harbor hypothesis.
All of the above indicates that this group of countries has unique characteristics with respect to economic development and its impact on the environment. Despite the rich research tools available for analyzing such processes, these countries are rarely included in global environmental pollution studies. Perhaps this is owing to the difficulty of applying other models to the specifics of the region and a lack of accessible literature. Researchers also prefer to set a broad frame to match with climate science – as far back as the 1960s and 70s – when these countries often did not have independent data before they gained independence in 1990.
Drivers and Dynamics of CO2 Emissions
Thus, the series of studies the co-authors have undertaken fills a significant gap in the existing scientific literature, shedding light on the drivers and dynamics of CO2 emissions in countries with economies in transition. We started by determining the most important factors driving change in emissions and identifying where policy levers might exist. For these purposes, we used traditional index decomposition analysis. This rather simple technology method breaks down changes in an aggregate indicator into a number of predefined factors. This allowed us to evaluate the contribution of each factor to an observed change in total energy-related CO2 under the assumption of the invariability of other factors. For a technical discussion of index decomposition analysis, see research by Xu and Ang (2013, [5]) and Ma and Stern (2008, [3]).
A provisional representation of CO2 emissions as a product includes three multipliers:
- affluence: GDP per capita by PPP;
- energy intensity – the amount of energy spent on producing one unit of GDP;
- and energy production technology, which takes into account the share of fossil fuels in the basket of energy sources, the share of each fossil fuel (coal, gas and oil) in the basket of fossil fuel sources used, and the amount of CO2 released when each particular type of fossil fuel is burned.
When choosing the form of decomposition, the authors selected an option that allowed us to examine in more detail the role of the basket of energy sources of the country. Hydropower and other renewable energy sources do not lead to emissions of CO2. Accordingly, switching to renewable energy sources allowed us to reduce CO2 emissions at the same level of production with the same amount of energy. Some fuels are cleaner than others. For instance, 1 terajoule of energy results in 54,300-58,300 kg of CO2 by burning natural gas and 89,500-125,000 kg of CO2 by burning coal (depending on the type). Thus, when switching from coal to natural gas, CO2 emissions will be halved while producing the same amount of energy. Emissions can vary with time when switching to other types of fossil fuels of this type. Minimum and maximum coal emission factors differ by almost 40 percent. We may also trace the effect of affluence. With the same use and production practices, the higher the per capita GDP, the bigger the CO2 emissions. In turn, reducing the energy intensity of GDP allows you to reduce emissions at the same level of production and the same energy production technologies.
Reduction in CO2 Emissions
The main reduction in carbon dioxide emissions in the countries under consideration occurred between 1990-1997. A decrease in GDP per capita was expected to result in reduced CO2 emissions in all post-Soviet countries during this period. In Russia, Azerbaijan, Turkmenistan, Uzbekistan and Ukraine (countries rich in fossil fuel), the energy intensity of GDP grew during this period, and its driver in the dynamics of CO2 was positive. The GDP energy intensity decline in Estonia, Armenia and Belarus was so significant that it even surpassed the role of GDP per capita decline. In Armenia, Georgia, Kyrgyzstan, Latvia, Lithuania and Tajikistan, a significant role in the reduction of CO2 emissions was played by switching the share of energy sources that are not related to greenhouse gas emissions.
Since 1998, post-Soviet countries have begun the processes of economic recovery and economic growth. They fall into three groups. In the first (Belarus, Azerbaijan, Russia, Latvia, Lithuania, Estonia and Armenia), affluence had a positive and very significant effect in magnitude, but this income effect was compensated by the effect of reducing the energy intensity of GDP. The change in energy production technology played a smaller role. However, it can be noted that in Armenia, Latvia, Lithuania and Estonia, it is possible to isolate switching to non-hydrocarbon energy sources. CO2 emissions in Armenia decreased significantly in 1995 due to the resumption of nuclear power generation, suspended in 1989. In contrast, Lithuania closed its nuclear power station in 2009, which led to an increase in emissions. In Azerbaijan, Russia and Belarus, a significant factor was switching to less carbon-intensive fossil fuels (although the magnitude of this effect in reducing CO2 emissions was very low).
In the second group (Kazakhstan, Turkmenistan and Uzbekistan), CO2 emissions have increased since the late 1990s. The effect of affluence was positive and quite significant in magnitude, but this effect was not compensated by the effect of reducing GDP energy intensity, which has decreased in these countries only slightly. The role of changes in energy production technologies in these countries is negligible.
The third group (Georgia, Kyrgyzstan, Moldova, Tajikistan and Ukraine) did not go on to economic growth; actually, they were “stuck” at the level of the early 2000s. In these countries, the share of fossil fuels decreased, and in the basket of fossil fuels we can observe a transition to less polluting types. However, these effects are small in magnitude. GDP energy intensity decreased very slowly. Insufficient economic development of the countries of this group did not permit more energy-efficient GDP production. Thus, the authors found that the main factor in reducing CO2 pollution in post-Soviet countries was a decrease in the energy intensity of GDP.
Study of Convergence
Next, we turned to the study of convergence. This concept is commonly associated with the theory of economic growth and reduction in income inequality between countries or regions. Broadly speaking, convergence means that inequality in per capita income between countries declines, and poor countries catch up with rich ones. Divergence is the opposite of such leveling. However, its application is not limited to economic growth, as is clear from interdisciplinary studies including energy and environment economics. Convergence occurs at global and local (club) levels with clubs grouped based on the data. Islam (2003 [1]) has provided a very detailed review of the literature on convergence that compares concepts, methods and numerous findings.
The authors used a variety of modern techniques to test whether a decrease in the energy intensity of GDP in the post-Soviet countries within this group converges with the level of the most energy-efficient countries of the European Union. Results confirm such convergence with the energy intensity of post-Soviet countries converging to the average European level. Empirical results to a certain extent support the hypothesis that the energy intensity of GDP in resource-rich countries declines more slowly than in the entire group of post-Soviet countries. For other factors – GDP per capita and the carbon intensity of the energy production (that is, the amount of CO2 released in the production of one unit of energy) – there is no such convergence.
We also tested the existence of convergence clubs, using the technique proposed by Phillips and Sul (2007 [4]). This methodology examines whether the dispersion across cross-sectional units of the variable of interest decreases over time. A regression-based test and clustering procedure was developed based on this test, which allows for a wide variety of possible transition paths towards convergence (including subgroup convergence).
We found evidence of the existence of two clubs in GDP per capita at PPP. A “rich club” includes Armenia, Azerbaijan, Belarus, Estonia Kazakhstan, Latvia, Lithuania, Russia and Turkmenistan. A “poor club” includes Georgia, Kyrgyzstan, Moldova, Tajikistan, Uzbekistan and Ukraine. We identified three clubs in carbon intensity: Estonia, Georgia and Kazakhstan have the dirtiest; Armenia, Azerbaijan, Belarus, Lithuania, Moldova, Russia, Tajikistan and Uzbekistan have the cleanest; and Kyrgyzstan, Latvia, Turkmenistan and Ukraine fall in the middle.
Other Influential Factors
What other factors besides technological ones can influence the intensity of emissions? The hypothesis of the Environmental Kuznets Curve assumes that economic growth can and should become the basis for technological changes and reduce pollution. This concept assumes that the pollution-growth nexus has an inverted U-shape. At the early stages of its development, a club’s economy and industry increase pollution. At an income “turning point,” the population initiates a demand for environmental goods. The latter stimulates growth in cleaner technologies leading to a decline in pollution.
Three effects in terms of the impact of economic growth on pollution can be distinguished as follows: 1. the scale effect (increase in output leads to an increase in pollution); 2. the technical effect (improving production techniques or adopting cleaner technology); and 3. the composition effect (reducing pollution-intensive activities). In addition to these main effects, researchers have identified a number of factors that impact the relationship of economic growth to pollution. Among them is a foreign direct investment from developed to developing countries. This can both aid in the transmission of clean technologies and pollution havens. The literature on the Environmental Kuznets Curve is vast and varied. Kaika and Zervas (2013, [2]) have provided a comprehensive review of EKC.
The authors found empirical evidence that post-Soviet countries are on the upward branch of the Environmental Kuznets Curve – at the present stage of development, economic growth leads to an increase in pollution, although the growth rate slows down over time. We received confirmation that the abundance of fossil fuels had a positive effect on CO2 emissions in the post-Soviet countries, all things considered. Foreign direct investment increased pollution, and accession to the European Union (Estonia, Latvia and Lithuania joined the EU in 2004) reduced them.
Our research allows us to conclude that economic growth in the post-Soviet countries could have increased CO2 emissions. The main driver of the CO2 pollution reduction was the decrease in the energy intensity of GDP. The post-Soviet countries have made significant progress in reducing energy intensity in the direction of the most energy-efficient countries of the European Union. Similar studies in OECD (Organization for Economic Cooperation and Development) countries show that the reduction of energy intensity makes the greatest contribution to the reduction of CO2 emissions. Many OECD countries reject coal, reduce oil consumption and develop alternative energy sources. If the resource-rich post-Soviet countries do not follow this path, the progress achieved after the collapse of the USSR in preventing global pollution of the Earth’s atmosphere may be lost.
Meanwhile our analysis is of a macroeconomic nature. The decrease of energy intensity can be attributed not only to technological advances, leading to the more efficient use of energy, but also to changes in the structure of the economy and industrial decline. To further investigate the causes of current trends, study of the economic structure and sectoral analysis of energy intensity are needed.
References
- Islam, N., 2003, “What have we learnt from the convergence debate?” Journal of Economic Surveys, Vol. 17, No. 3, pp. 309-362.
- Kaika, D., Zervas, E., 2013, “The Environmental Kuznets Curve (EKC) theory – Part A: Concept, causes and the CO2 emissions case,” Energy Policy, Vol. 62, pp. 1392-1402.
- Ma, Chunbo, David I. Stern, 2008, “Biomass and China’s carbon emissions: A missing piece of carbon decomposition,” Energy Policy, Vol. 36, No. 7, pp. 2517-2526.
- Phillips P. C. B., Sul D., 2007, “Transition modeling and econometric convergence tests,” Econometrica, Vol. 75, No. 6, pp. 1771-1855.
- Xu, X. Y., Beng W. Ang, 2013, “Index decomposition analysis applied to CO2 emission studies,” Ecological Economics, Vol. 93, pp. 313-329.
Yulia Raskina is an associate professor in the Department of Economics at European University in St. Petersburg, Russia. Olga Podkorytova is an associate professor in the Department of Economics at European University in St. Petersburg, Russia. Podkorytova is also an associate professor in the Department of Economics at St. Petersburg State University, Russia.
([email protected])

([email protected])