April 10, 2020 in COVID-19 Quantitative Analysis
Biology vs. Economy: A False Choice
Scenario analysis illuminates a global crisis.
SHARE: PRINT ARTICLE: https://doi.org/10.1287/orms.2020.03.01

As governments around the world pose choices (on our behalf) between biology and economy and deliberate over trillion-dollar social and economic interventions, we shout from the rooftops: The choice between biology and economy is a false choice! The real compromise isn’t between biological factors and economic factors – the real compromise is between social factors and economic factors. Biology is a harsh mistress – biology will always win. Technology is not a limiting factor; we have all of the technology we need to prevail in this crisis. Various regimes have made various social choices, and those social choices have determined the economic outcomes. The economic outcomes – and the fusion of economic and social factors – is not deterministic. Or it was not deterministic, at least, at the outset of the coronavirus pandemic.
The following quantitative analysis of COVID-19 is a tale of two countries. It is also a tale of two parameters. In a way, it’s a tale of two tribes, two cultures, two mindsets, two ideologies, two hemispheres. It is not simply a technical analysis; it is a sociotechnical analysis. It’s an analysis of a sociotechnical system. Our approach is a fusion of qualitative and quantitative methods.
We’ll use our quantitative analysis of COVID-19 in Italy and South Korea to look forward and backward at responses to COVID-19 in the United States, including:
- the U.S. government passing a $2 trillion stimulus legislation to prevent further collapse of the U.S. economy that resulted from the social disruption associated with the virus response; and
- the U.S. government envisioning relaxation of social restrictions within a few weeks, also to prevent the further collapse of the economy.
This vision, paradoxically, coexists with a biological situation in which the pandemic is gaining momentum in the U.S. and appears nowhere near being controlled – mainly due to a late and weak response. Premature relaxation of social restrictions threatens to unleash a biological catastrophe.
Two Countries: South Korea and Italy
We’ve seen relatively high biological effectiveness coupled with mild economic disruption associated with narrow social intervention in South Korea. Of course, South Korea started early; it didn’t deny the existence of the virus and its potential threat. It’s hard to say whether the U.S. can “switch horses” this late in the game. We’ve seen the opposite of South Korea in Italy – relatively low biological effectiveness coupled with severe economic disruption associated with broad social intervention. Table 1 summarizes the functional attributes of the two countries in the COVID-19 context.
|
mild economic disruption |
Quadrant 3
(some other countries?)
|
Quadrant 4
South Korea
|
|
severe economic disruption |
Quadrant 1
Italy
|
Quadrant 2
(some other countries?)
|
|
|
low biological effectiveness |
high biological effectiveness |
Table 1: Two countries.
In a sense, South Korea represents the eastern mindset and response to the virus, while Italy represents the western mindset and response to the virus. While both have pursued social strategies to control the virus, their social strategies have been radically different.
Two Parameters: Beta and Gamma
The dominant parameters in our analysis are beta and gamma. Two Greek letters; two different personalities. As we will see in our model, we want to decrease beta and increase gamma. As we will also see in our model, beta is relatively more effective than gamma (five-times more effective in some sense). Various social interventions interact differently with beta and gamma. Tables 2A and 2B define and summarize the practical attributes of our two parameters.
|
Parameter |
Definition/Characteristics |
|
Beta (β) |
The percentage of total possible encounters between a susceptible individual and an infected individual that produces a new infection (related to the contagion of the virus – COVID-19 is highly contagious; its significance is also related to the size of a population) |
|
Gamma (γ) |
The percentage of infected individuals that are identified as infected and are subsequently isolated (many members of a population are often infected and not identified; a particularly insidious factor for a virus like COVID-19 with a long incubation period and/or asymptomatic transmission; enables the virus to stay underground/be invisible and increases the importance of testing/contact tracing) |
Table 2A: Two parameters.
As we will see in our model, beta and gamma are synergistic and interdependent; mobilizing a combination of beta and gamma amplifies the effect of both parameters. In addition to beta and gamma, time is a critical element in the equation of this crisis. As we will see in our model, figuratively speaking, all of the other factors assemble in the numerator; “time is the denominator.”
|
Parameter |
Directional Goal |
Relative Effectiveness/Elasticity |
Relevant Social Interventions |
|
Beta (β) |
Decrease |
High |
Social Distancing |
|
Gamma (γ) |
Increase |
Low |
Contact Tracing |
Table 2B: Two parameters.
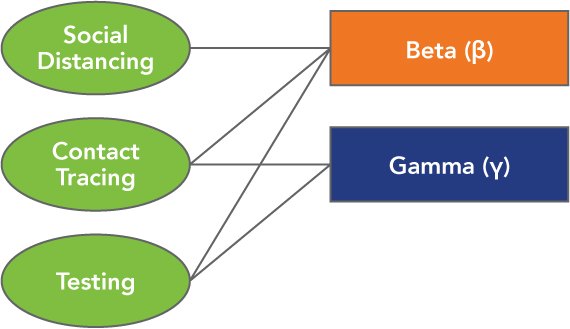
Three Interventions: Social Distancing, Contact Tracing, Testing
We will explore three types of social interventions and their interactions with beta and gamma. Social interventions that focus on social distancing decrease beta; interventions that focus on contact tracing and testing decrease beta and increase gamma. Social distancing broadly impacts social activity and produces severe economic disruption; contact tracing and testing narrowly impact social activity and produce mild economic disruption. Interventions are synergistic and interdependent; mobilizing a combination of interventions increases the effectiveness of each type and, in particular, mitigates the social impact and corresponding economic disruption of social distancing.
As contact tracing has been described in the context of South Korea, both during COVID-19 and previous epidemics: Contact tracing allows medical practitioners to identify networks of possible transmission early, carving the virus from a society like a surgeon removing a cancer from a human body.
We call the mindset of South Korea “a surgical approach”; it minimizes economic disruption by narrowing social disruption in “target-rich” directions. South Korea has continued to improve its execution of contact tracing since the 2015 MERS outbreak. Table 3 summarizes the practical attributes of our three interventions, and Figure 1 illustrates the interactions among interventions and parameters.
|
Intervention |
Target Parameter/ |
Dominant Cultural Regime |
Social/Economic Impact |
|
social distancing |
beta |
western |
broad social intervention/severe economic disruption |
|
contact tracing |
beta/gamma |
eastern |
narrow social intervention/mild economic disruption |
|
testing |
beta/gamma |
eastern |
narrow social intervention/mild economic disruption |
Table 3: Three interventions.
Scenario Analysis
We will explain our numerical model a bit later and establish the theory and its application to COVID-19. First, let’s explore the results. We used the model to simulate various scenarios; we will use scenario analysis to illuminate COVID-19 in the context of Italy and South Korea. We will also use scenario analysis to inform the months behind and the corresponding months ahead for the United States. Table 4 presents the results of the scenarios that we simulated.
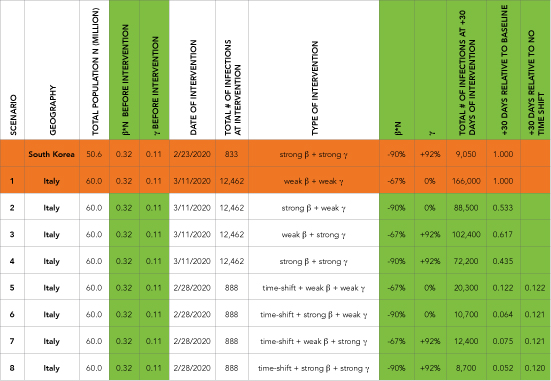
As the model has shown in South Korea, and as we also indicate in Table 1, South Korea has disregarded the false choice between biology and economy. By starting early and focusing on a combination of beta and gamma, it was able to effectively battle the virus while preserving economic momentum. We see that:
- Italy could have emulated South Korea in the beta dimension and decreased its infection rate to 53.3% of the baseline after 30 days;
- Italy could have emulated South Korea in the gamma dimension and decreased its infection rate to 61.7% of the baseline after 30 days; and
- Italy could have emulated South Korea in combined beta/gamma response and decreased its infection rate to 43.5% of the baseline.
As previously mentioned, “time is the denominator”: in general, shifting the intervention forward by 12 days decreased any of the scenarios to 12% of the same parameter combination without the time shift. The shift indicates how distinctly time is of the essence in responding to the pandemic. The 12-day shift corresponds to the date on which the infection rate for Italy was similar to the infection rate for South Korea when it conducted a social intervention.
We see that beta was relatively more effective than gamma at decreasing infection rate, although the social intervention that was driving beta may have been relatively stronger than the social intervention that was driving gamma. While the effectiveness of beta was apparently higher than gamma in biological terms, we know that beta is potentially more disruptive in the social and economic dimensions, especially if testing and contact tracing are not deployed in combination with social distancing.
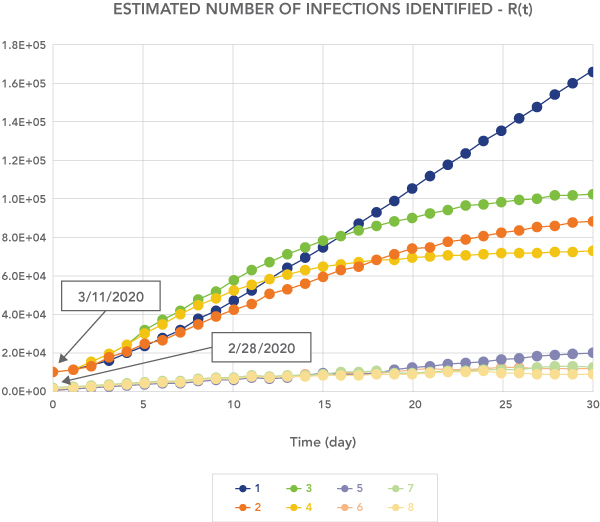
Our analysis evaluates the effect of a single intervention for a duration of 30 days, assuming that no additional interventions are deployed during that duration. This 30-day duration is sufficient to illustrate the differences in performance across the scenarios. In practice, governments may deploy additional interventions, especially if initial programs are not achieving the intended effect. We could model these interventions as separate stages with an initial infected population and beta/gamma values that correspond to the particular intervention.
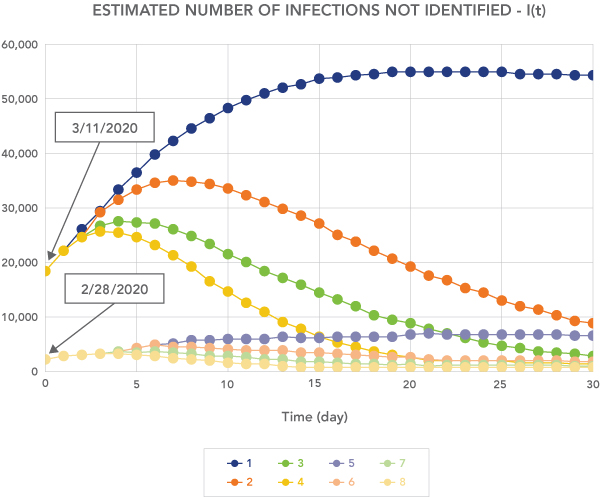
Figures 2, 3 and 4 illustrate the separation across the eight scenarios and the trajectories of the various scenarios over time. Nearly as important as time in this equation is the invisible nature of the virus. Due to its long incubation period and high rate of asymptomatic transmission, the number of identified infections is often low relative to the number of unidentified infections. Combined with an inherently exponential growth rate, the invisibility factor is a double whammy. Figure 3 illustrates the separation across the eight scenarios in terms of unidentified infections.
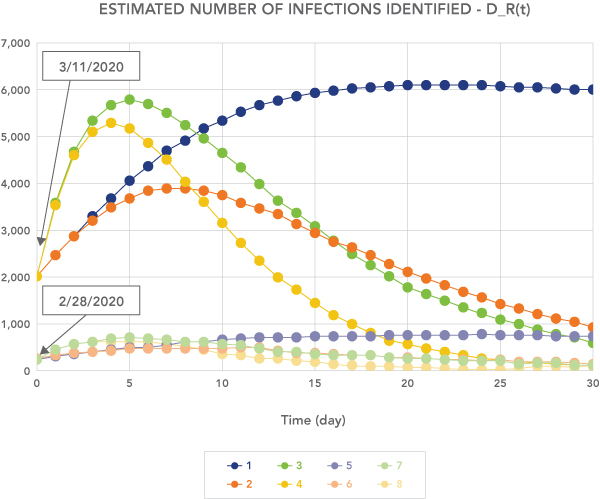
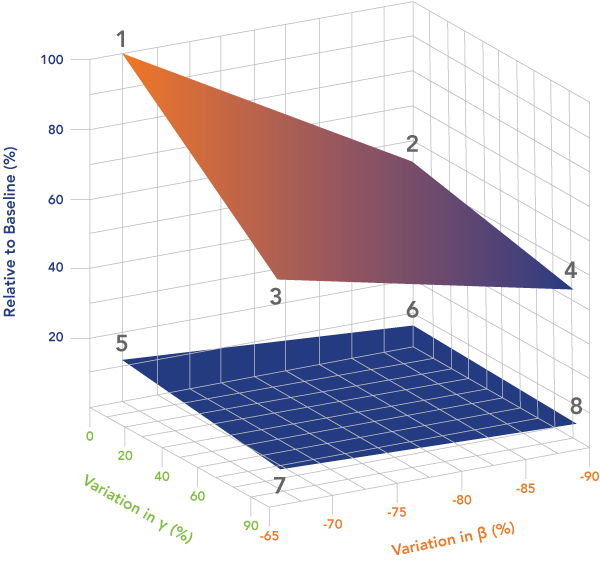
The 3D visualization of our scenario analysis (Figure 5) illustrates the relative effectiveness of beta and gamma across various values. The upper surface is derived from the set of interventions at the baseline date of March 11, 2020, and the lower surface is derived from the set of interventions at the time-shifted date of February 28, 2020. The vertices of the two surfaces correspond to the eight scenarios and are labeled accordingly.
We notice that the gradient/slope of the upper surface is much higher than that of the lower surface, while the elevation of the upper surface is much higher than the elevation of the lower surface. The high gradient indicates that changes in beta and gamma can be relatively effective in impacting the infection rate (especially at the baseline date of March 11). This evidence justifies even more the adoption of testing and contact tracing interventions that act positively on both parameters. The difference in elevation between the two surfaces indicates how distinctly time is of the essence in responding to the pandemic.
The absolute value of the partial derivative for the upper surface calculated from the baseline along β is 2.03 while the same along γ is 0.416. Variations of β affect the total number of infections roughly five times more than the variation of γ.
The Model
We based our analysis on an adaptation of the well-established “SIR” model – an epidemiological mathematical formulation that is used to represent, over time, the evolution of the number of susceptible [S(t)], infected [I(t)] and removed [R(t)] individuals in a population of N individuals. The model helps to represent on a daily basis (resolution dt = 1 day) how the population is divided into the three different categories S(t), I(t) and R(t). For the sake of clarity, we consider as “removed” (isolated) any individuals who are identified as infected by the testing campaign. When infected members are removed, they are unable to further infect other members of the population. The model, represented by a system of nonlinear finite difference equations, was realized using Altair Activate®, an integration platform for system-level analysis. Figure 6 proposes a representation of the model.
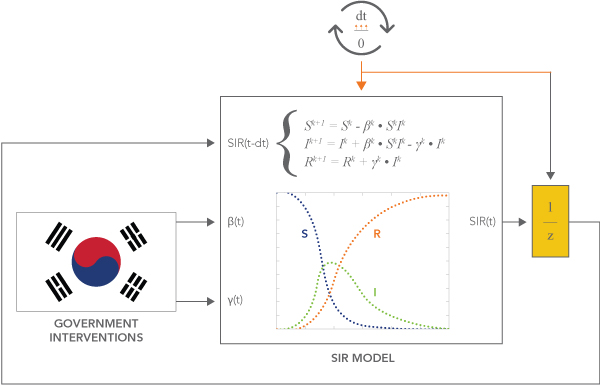
β and γ are the connection points between biology and social interventions. The mathematical interface between political action and social intervention and the evolution of the spread, which is a biological phenomenon, is indicated by these two “magic” parameters. The accurate estimation of their variation over time enables us to solve the problem of correctly dividing the population among the three categories S(t), I(t) and R(t).
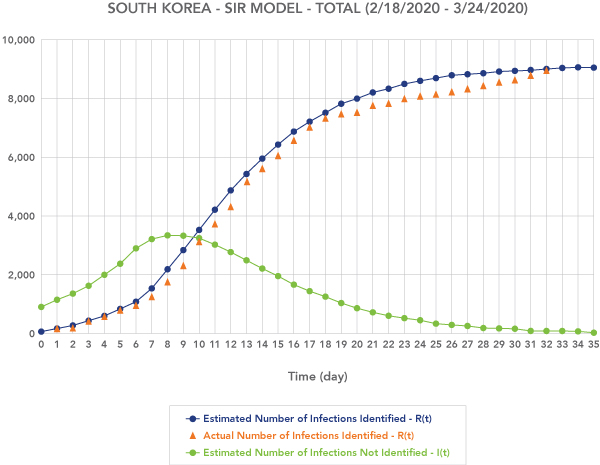
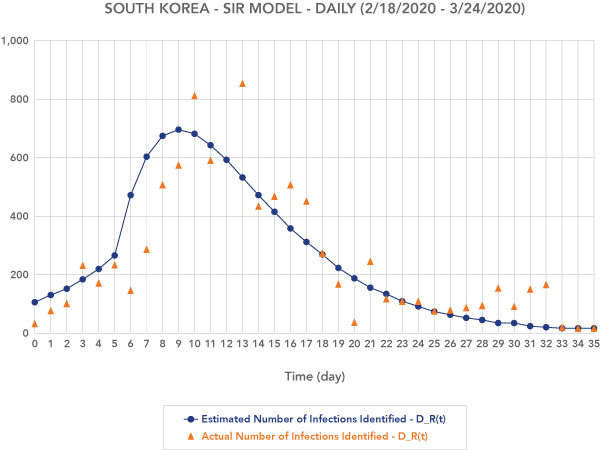
The process of analyzing the baseline scenario is separated into two main steps: model tuning and prediction. In the model tuning phase, an optimizer is used to automatically identify β and γ and fit the model as close as possible to actual data. The values that are identified for β and γ are then used in the second phase to perform predictions. Figures 7 and 8 illustrate some of the graphs that can be generated by executing the model.
The Road Ahead
Just as we have shown that the choice between biology and economy is a false choice, the choices between social and economic factors, between private rights and the public interest, are also false choices. We leave that analysis for another time and another place. The technical and social configurations of the 20th century have proven to be no match for an invisible virus. This virus is, admittedly, a beast. Exponential growth is always a challenge; exponential growth combined with invisibility is especially insidious. In this particular battle, as in all epidemics and pandemics, beta and gamma have defined the shape of the battlefield. The tribes that have mobilized effective combinations of beta and gamma have been relatively successful at battling the virus without destroying their economies. Table 5 revisits Table 1 and places the United States in the context of South Korea and Italy.
|
mild economic disruption |
Quadrant 3
(some other countries?)
|
Quadrant 4
South Korea
|
|
severe economic disruption |
Quadrant 1
Italy United States |
Quadrant 2
(some other countries?)
|
|
|
low biological effectiveness |
high biological effectiveness |
Table 5: Three countries.
Table 6 indicates the relative performance of the U.S. across various social interventions. We know the relative effectiveness of beta/gamma, the interactions among beta/gamma and the interventions, and the relative social and economic impact of each intervention.
|
Intervention |
Timing |
Intensity |
|
Social Distancing |
Late |
High |
|
Contact Tracing |
Late |
Low |
|
Testing |
Late |
Low |
Table 6: Relative performance of the U.S. across social interventions.
The differences between the U.S. and South Korea in terms of social organization are well-known. This analysis simply indicates the economic cost (or benefit) of those differences. The U.S. is a democratic society; it is free to organize as it sees fit. Because the U.S. is significantly larger in population than South Korea, beta in particular, and the interaction of beta and gamma, may perform differently. It’s just a question of investment direction and magnitude – the relatively small investment of battling the biological misfit on the front end, or the relatively large investment of restoring the social infrastructure and the economy on the back end.
The U.S. has (or had) “a choice of airlines.” Will it retract social interventions prematurely in a futile attempt to restore economic activity and risk a biological catastrophe, ultimately multiplying the economic damage? Will it hasten to adopt 21st-century social and technical innovations that enable concurrent advance toward economic and biological objectives? Will it be ready for the pandemics of the 22nd century ... or sooner?
David Quimby is a principal at Innovation Radiation, where he practices systematic innovation, experimental design, and technology forecasting. He is a patented inventor in Web architecture and user experience. He assisted a multitude of U.S. and international clients with environmental scanning and technology forecasting at Stanford Research Institute. He assisted an array of manufacturing and service enterprise with technical and economic feasibility analysis at Deloitte Consulting. He assisted Best Buy and Bank of America with adoption of emerging technologies. He is a co-founder of Minnesota Change Management Network. He earned a bachelor’s degree in mathematical economics and developmental economics at UCLA and a master’s degree in organizational behavior and socio-technical systems at UC Berkeley. Livio Mariano is a technical specialist in model-based development at Altair Engineering. He has more than 10 years of experience in the applied mathematics and systems domain. In his previous role as a project engineer, he conducted data analysis, design of experiments, optimization and modeling/control of dynamic systems. Mariano earned a bachelor’s degree in mechanical engineering and a master’s degree in mechanical engineering with specialization in mechatronics and robotics at Polytechnic University of Milan.