June 12, 2020 in COVID-19 Spread Model
Modeling the COVID-19 Spread: An OR/MS View
Stochastic approach based on a transition matrix model first used to forecast the virus trajectory in China
SHARE: PRINT ARTICLE: https://doi.org/10.1287/orms.2020.03.07

Since its December 2019 outbreak in Wuhan, China, coronavirus disease 2019 (COVID-19) has become the biggest pandemic in terms of deaths since the 1918 flu pandemic, with more than 300,000 deaths reported worldwide as of mid-May 2020. Numerous epidemiological forecast models exist for projecting the trajectory of coronavirus infection cases in various regions/countries. Most of these forecasts are based on the well-known epidemiology susceptible-exposed-infectious-recovered (SEIR) model and its various extensions [1], although the Institute for Health Metrics and Evaluation (IHME) model underlying the forecasts in White House briefings are based on a “statistical model with no epidemiologic basis” [2]. However, all of these models provide widely varying forecasts, due to high sensitivity to estimated model parameter values and challenges in incorporating nonpharmaceutical intervention (NPI) government policies such as “lock-down” or “stay-at-home” directives.
More recently, epidemiologists have looked at agent-based models, very familiar to the operations research (O.R.) community, where individuals can be modeled in detail, e.g., age, gender, health condition and stochastic characteristics are directly incorporated. These models can be computationally intensive for large populations.
This article describes a proposed modeling approach based on an augmented discrete-time Markov chain (DTMC) transition matrix model (TMM) first used to forecast the COVID-19 spread in China’s Hubei province (Wuhan is the capital) [3, 4, 5]. This stochastic modeling approach is inspired by an analogous approach widely used in the financial industry, mainly in credit analysis, especially in predicting credit rating migration of corporate bonds or delinquency migration of consumer loans. The event chain of a consumer loan’s “early delinquency,” “serious delinquency” and “default” is very similar to the event chain of a COVID-19 patient’s “mild case,” “severe case,” “critical case” and “death” [3].
This model was used to predict the COVID-19 progression in Hubei province on Feb. 9, when the situation was most dire in China’s campaign against COVID-19 [3]. The model was shown to be flexible, robust and accurate, and was adopted by the first Shanghai assistance medical team at Wuhan Jinyintan Hospital, the first designated hospital in the world to take COVID-19 patients. The forecast has been used in Hubei province for preparing medical staff, ICU beds, ventilators and other critical care medical resources. From field experience, the transition matrix model (TMM) approach has been used to support real-time medical management decisions.
Historical data from China’s first two months (January/February 2020) of fighting against COVID-19 was collected and used to enhance the model by embedding NPI efficiency into the model. The model was also used to forecast the trajectory of infection cases in Italy, South Korea and Iran on March 9, and in Spain, Germany, France and the United States on March 24 [4]. Again, the model performance was very promising, and the model itself demonstrated flexibility and robustness for countries and regions outside of China. Utilizing the well-known OR/MS stochastic model of nonparametric discrete-time Markov chains, the encouraging results of the TMM approach suggest that modeling teams around the world might benefit from complementing their modeling arsenal with an OR/MS stochastic approach in the battle against COVID-19.
Discrete-Time Markov Chain Model
Following the description provided in Chen, et al., 2020 [5], the discrete-time Markov chain model proposed [3, 4] uses the following states: 1) under medical observation, 2) discharged after testing noninfected and following protocol (e.g., 14-day quarantine), 3) infected in non-severe condition, 4) infected in severe condition, 5) infected in critical condition, 6) deceased and 7) cured. The patient flow is depicted in Figure 1, where patients enter the “under medical observation” state after they are determined to have been engaged in close contact with infected persons. At some time in this state, they are presumably tested, and at some point after, either declared infected (inside the shaded area in Figure 1) or discharged. The Markov chain is absorbing, with three terminal states: discharged, cured and deceased, although a discharged patient could possibly reenter as a new close contact (NCC) in the generation phase, but that is considered a “new” patient in the DTMC. Thus, Figure 1 differs from a traditional DTMC state transition diagram in that there is a “flow” from the outside represented by the “new close contacts generated” arrival process, and the “infected” diamond does not represent a state in itself, but a decision node combined with the other represented states in the shaded area.

The process flow in Figure 1 is very similar to the TMM widely used in mortgage finance industry [6], as shown in Figure 2. Most major rating agencies, such as Morningstar, Moody’s Investors Service and S&P Global Rating, publish their annual transition matrix for corporate ratings, so corporate bond investors can estimate the likelihood of their investments getting downgraded in the future. The TMM approach has the following advantages: It directly incorporates stochastic features while retaining states (compartments) analogous to those found in SEIR-type models; its discrete-time nature and degree of modeling detail make it straightforward to estimate model parameters from available data (e.g., including hospital data, not just mortality data); and it is computationally tractable both in terms of parameter estimation and in terms of model output analysis.

The transition probabilities of the DTMC model can either be determined by regression or simply derived from empirical probabilities (generally based on daily data, so the time step is one day). Depending on the model, some probabilities will be constant (stationary) and others may be time-varying (e.g., due to medical care improvements leading to decreased mortality and increased cure rates).
Specifically, the four relevant transient states of the model are defined as follows (these also correspond to four distinct treatment facilities: 1) quarantine hotels, 2) fangcang shelter hospitals, 3) designated COVID-19 hospitals and 4) ICUs):
- Under medical observation: a close contact of a potential infection case, who is traced, identified and put into medical observation, generally in a quarantine facility. From this state, the next day a patient may be confirmed with infection, discharged without infection or remain under medical observation (e.g., if the test results have not come back yet).
- Infected but non-severe: a patient with mild symptoms (generally treated in makeshift shelter hospitals for Hubei COVID-19 patients). There are three possible transitions for the next day: cured, worsening to a severe condition or remaining non-severe.
- Infected and severe: a patient who develops severe symptoms that require hospitalization and oxygen support. There are again three possible transitions for the next day: worsening to critical condition, improving to non-severe condition or remaining in severe condition.
- • Infected and critical: a patient showing critical symptoms and requiring admission to an ICU. There are also three possible transitions for the next day: worsening leading to death, improvement to severe condition or remaining in critical condition.
For severe and critical cases, COVID-19 can be complicated by the acute respiratory distress syndrome (ARDS), sepsis and septic shock and multi-organ failure, including acute kidney injury and cardiac injury. Treatment for these patients is very complicated and requires extremely skilled specialists. For example, one of this article’s authors (Dr. Junhua Zheng) led the first Shanghai Medical Assistance Team in Wuhan. He worked in the ICU at Jinyintan Hospital for 67 days where he treated 170 severe and critical patients, with a cure rate of more than 80%, including 123 critical cases with a cure rate of over 72%.
Each day, a patient’s daily state is characterized by a probability state vector, where the value of each element can be viewed as the probability of being in that state, so for each individual new close contact generated, the elements would sum to 1. For a given individual in a known state, the corresponding element would be equal to 1, and the other elements would be zero. For a population, the state vector is defined as the count of people in each state. Using the one-step transition matrix of daily state transition probabilities, the state vector can be propagated by the usual matrix multiplication, with one caveat described as follows:
If the population is limited and the transition matrix is stationary, the matrix multiplication formula will be sufficient in predicting all future outcomes, and since it is an absorbing chain, all the transient states would eventually go to zero, and individuals already in the pool will eventually end up discharged, cured or deceased (the absorbing states). In epidemic settings such as the COVID-19 situation in early 2020, the population is not fixed, and additional individuals enter the population via the generation of new close contacts as shown in Figure 1. Every day, new close contacts are added to the medical observation pool. In the modified DTMC model, these new individuals are generated as a proportion of the current new close contacts, i.e., via NCC(n+1) = eNCC_Change_Rate * NCC(n), where the NCC change rate parameter is analogous to the basic reproductive number R0 parameter in SEIR-type models, in that when it is positive, the number of infected individuals in the population is increasing, corresponding to an R0 value greater than 1. Just as when intervention measures cause R0 to eventually decrease below 1, correspondingly the NCC change rate will become negative. The NCC change rate is a critical parameter, but far more readily estimated directly from available data than R0.
The resulting DTMC TMM can be used for forecasts such as when the infection peak time (maximum number of active infection cases) occurs, as well as patient distributions (critical, severe, non-severe), which can be used for supporting medical resource allocation planning. The first application of this model was to predict the COVID-19 progression in Hubei province, China, which was the epicenter of the epidemic in early February. Based on China National Health Commission and Hubei Health Commission daily data from Dec. 31, 2019 through Feb. 8, 2020, six different scenarios were considered: two optimistic, two cautiously optimistic and two relatively pessimistic. The scenarios took three different values of NCC change rate and two UMO discharge rates, since these were likely to be the most sensitive parameters. Results comparing forecasts with actual data are summarized in Table 1, with a sample forecast on Feb. 9 for new close contacts presented in Figure 3.


In the very early stages of the COVID-19 outbreak, the daily fatality rate from severe (including critical) cases was extremely high, around 8%. On Chinese New Year’s Eve, Jan. 24, the first medical assistance team was dispatched from Shanghai to Wuhan to help the local medical staff. On Feb. 10, the TMM forecast was adopted by the Shanghai team led by Dr. Zheng and used in preparing medical staff, ICU beds, ventilators and other critical care medical resources by central and provincial health commissions and local centers of disease control. On Feb. 14, one of the authors (Jian Chen) published a forecast that indicated that under the cautiously optimistic scenario, the number of medical staff members needed to take care of severe and critical patients could reach 40,000-45,000. As a result, more medical assistance teams were dispatched from all over China to Wuhan and other Hubei cities, and on March 8 the final number of medical assistance teams reached 346, including more than 42,000 medical staffers (about 19,000 of whom are specialists in severe case medication).
On Feb. 15, the model forecasted a “back-to-normal” date around mid-April, but due to the extraordinary efforts of these medical assistance teams, the lock-down in Wuhan was lifted on April 8, and Dr. Zheng was able to return to Shanghai after fighting COVID-19 for 67 days in the epicenter of Wuhan.
During January and February 2020, two hospitals with 1,900 beds were built within two weeks to accept severe and critical patients. As time went on, medical staff became more experienced treating COVID-19. All these measures helped to reduce the daily severe case fatality rate to a very low level of 0.5%, an almost 94% drop from the very early stages. Moreover, starting on Feb. 5, another 16 “shelter hospitals” – converted stadiums, shopping malls, convention centers, etc. – were put into use, accepting more than 12,000 non-severe patients in Wuhan. Patients with mild symptoms were placed in these makeshift hospitals where they received proper medical treatment rather than self-quarantining at home, where there would be significantly heightened risk of family transmission and community transmission. The daily cure rate of non-severe cases increased dramatically from 1% in late January to close to 10% in late February. Finally, as a result of all these timely measures, the peak of actual active cases was moved up to Feb. 16 instead of the original estimate of the first week in March.
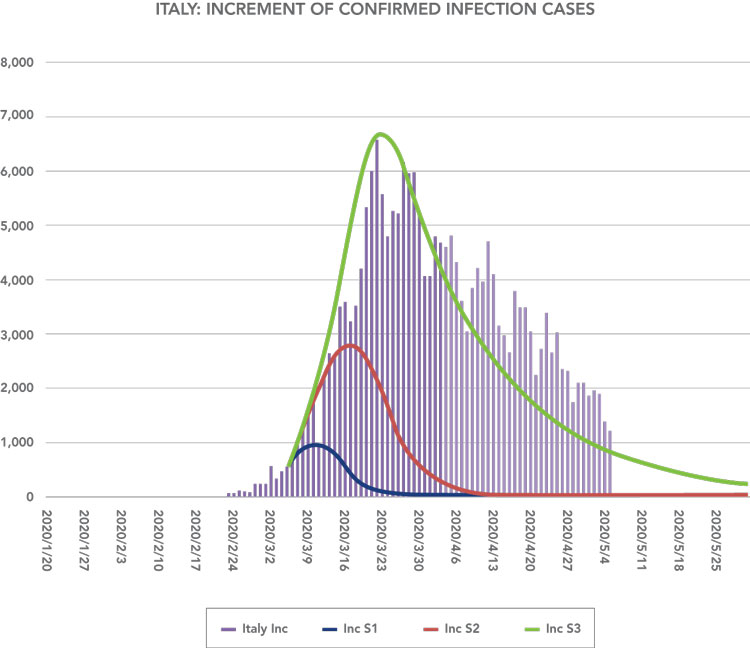
Dr. Zheng improved the Hubei model by incorporating different levels of preventive policy efficiency [4]. This led to forecasts for Italy, South Korea and Iran, which were published on March 9, based on data through March 8. Using known initial conditions as of May 4, a short back-testing for the period of March 5-8 was used to predict which of the three scenarios was most likely, which turned out to be the relatively pessimistic scenario S3, forecasting a peak of incremental cases on March 23 of just under 6,700 cases and a cumulative total of more than 192,000 cases at the end of April. The actual peak date for incremental cases (6,557) was reached on March 22, and the actual total number of confirmed cases on April 30 was 203,591. The March 9 forecasts for incremental and cumulative cases are shown in blue, red and green in graphical form for the three scenarios in Figure 4 and compared with actual counts through May 5.

References
- Wu, Joseph T.; Leung, Kathy; and Leung, Gabriel M., 2020, “Nowcasting and forecasting the potential domestic and international spread of the 2019-nCoV outbreak originating in Wuhan, China: A modelling study,” Lancet, Vol. 395, pp. 689-697.
- Jewell, Nicholas P.; Lewnard, Joseph A.; and Jewell, Britta L., 2020, “Caution Warranted: Using the Institute for Health Metrics and Evaluation Model for Predicting the Course of the COVID-19 Pandemic,” Annals of Internal Medicine, forthcoming, August 2020.
- Wu, Ke; Zheng, Junhua; and Chen, Jian, 2020, “Utilize state transition matrix model to predict the novel corona virus infection peak and patient distribution,” https://doi.org/10.1101/2020.02.16.20023614.
- Zheng, Zhong; Wu, Ke; Yao, Zhixian; Zheng, Junhua; and Chen, Jian, 2020, “The prediction for development of COVID-19 in global major epidemic areas through empirical trends in China by utilizing state transition matrix model,” https://doi.org/10.1101/2020.03.10.20033670.
- Chen, Jian; Fu, Michael C.; Zhang, Wenhong; and Zheng, Junhua, 2020, “Predictive Modeling for Epidemic Outbreaks: A New Approach and COVID-19 Case Study,” Asia-Pacific Journal of Operational Research, Vol. 37, No. 3 (June).
- Chen, Jian; Xiang, Jin; and Yang, Tyler, 2018, “Re-default Risk of Modified Mortgages,” International Real Estate Review, Vol. 21, No. 1, pp. 1-40.
Jian Chen is the founder and CEO of CreditWise Technologies, Co. Ltd. and has served as an adjunct professor at Johns Hopkins Carey Business School. Michael C. Fu is a professor holding the Smith Chair of Management Science at the University of Maryland, College Park. He is a Fellow of INFORMS and IEEE and has served as treasurer of INFORMS. Wenhong Zhang, MD, is the head of the Center for Infectious Disease at Huashan Hospital of Fudan University and serves as the leader of Shanghai’s anti-COVID-19 clinical expert team. He is known throughout much of Asia as the “Dr. Fauci of China.” Junhua Zheng, MD, is the vice president of First People’s Hospital, which is affiliated with Shanghai Jiaotong University. As the leader of the Shanghai medical assistance team to Hubei province after the coronavirus outbreak in Wuhan, he and his team worked on the frontlines battling the pandemic.

([email protected])