
August 4, 2020 in Forecasting Software Survey
Survey: What’s new in forecasting software?
The process of evaluating the right software for a company can be challenging and very specific.
SHARE: PRINT ARTICLE: https://doi.org/10.1287/orms.2020.04.05

When a company is looking into purchasing forecasting software, it inevitably faces the kid-in-a-candy shop situation: There are lots of options, but the forecasting needs may well be quite specific, and the budget is typically constrained. Never has there been a larger choice of forecasting software solutions on the market than now. In addition to new startups that supply very specific machine learning (ML) and artificial intelligence (AI) algorithms, established business intelligence software companies are adding more and more predictive time-series analysis tools to their product lines. As a result, it is difficult to choose the most appropriate product to meet prospective users’ needs. With this years’ biennial forecasting software survey, we aim to provide some insights on the recent development in this industry sector.
About the 2020 Survey
OR/MS Today forecasting software surveys have a long history, and the aim of these surveys has always been to provide a basic understanding of what different software vendors offer in terms of forecasting techniques. While in the past the main decision criterion has often focused around the availability of specific forecasting algorithms, today many solutions can be highly customized thanks to their modular software design and the capability of integrating well with open-source programming interfaces such as R or Python. But following the “big data” revolution, the requirements in software and hardware has shifted with the increase of data availability toward scalability and the need for integration with data warehousing and enterprise resource planning (ERP) systems. Depending on the users and uses in the organization, these developments heavily influence the requirements catalog that has to be met by new software, including application programming interfaces (API), data security standards or service level agreements (SLA). Depending on the business, further critical requirements include data protection laws (CCPA & GDPR) or government security standards.
This year, we substantially updated the 2018 survey questionnaire [1] to account for this increased importance of information technology next to the forecasting features, and to better reflect the questions practitioners ask themselves when it comes to selecting forecasting-related software. In designing the questionnaire, we have focused primarily on organizations that one way or another require forecasts as part of their operations. While many researchers analyze time-series data and produce forecasts for both internal and external consumption, their job demands are quite close to the academic researchers in forecasting. For the moment, we focus on organizations such as retailers, manufacturers and power supply companies whose forecasts drive the day-to-day operations of the business.

(Clockwise, from the upper left: Robert, Oliver, Alisa and Ivan.)
We identified 200+ potential forecasting software solution providers and invited them to participate via email or web form. In contrast to previous years, we also reached out to specialized software in the inventory and energy sectors. (Survey data and a directory of participating software vendors that completed and submitted questionnaires by mid-July are available online.) Table 1 below lists all participating software vendors that entered their information by mid-July.
The process of evaluating the right software for a company can be challenging and very specific, ranging from a forecaster with a limited number of data series to analyze to a retailer forecasting tens of thousands of series daily. This survey does not aim to identify the perfect software solution – there is no such thing – but instead provides the reader with a summary of recent developments in the forecasting software sector and perspective as to the trends and challenges that will influence the forecasting software market.
Forecasting Features
One of the key questions an organization faces in selecting its software is whether to opt for a general-purpose solution that addresses a variety of forecasting problems or purchase more specialized software that provides some advanced forecasting approaches at the expense of a more limited range of core methods. From our responses, roughly 45% of the software vendors identified themselves as offering general-purpose software. However, the increasing popularity of modular software design has allowed software vendors to provide much better custom-tailored software solutions in recent years at lower cost that can be easily expanded with the new features if requested. A caveat in this situation might often be that practitioners are unaware of new potential forecasting techniques, which harms the dissemination of research into practice if software vendors do not take an active role in promoting new algorithms.
In our study, we find that, typically, specialized software in inventory management supports out-of-the-box main inventory policies and stocking rules. All participating inventory management software solutions support the normal distribution, but in practice, this assumption is not always suitable. For example, when dealing with intermittent demand, the Poisson and negative binomial models are more appropriate. Interestingly enough, the latter distribution is not as widely supported as the former one, although it has been reported to do a better job in an inventory context [2].
Likewise, software that focuses on energy forecasting provides additional functionality that is not present in general-purpose software such as reading data from smart meters, smart grid support and energy storage. In addition, the data from this domain is typically measured at high frequency, showing multiple seasonalities that can be challenging to some software. Some of the vendors highlighted their support for preventative maintenance and algorithmic trading, features they claim are often requested in the energy sector.
Time-series Data Analysis
Visualization of time-series data and forecasting results is an essential feature for both model building and later, communication in the decision-making process. While all software has some time-series visualization integrated, our results seem to indicate that more specialized plots like scatter plot or autocorrelation function are not available everywhere. However, several respondents pointed out to us that the reports and visualization are now typically tailored for customer needs to align with the existing decision-making process. Those often use third-party instruments for reports and visualization, such as Microsoft Power BI and Tableau, therefore making internal plotting capability less important.
Forecasting Algorithms
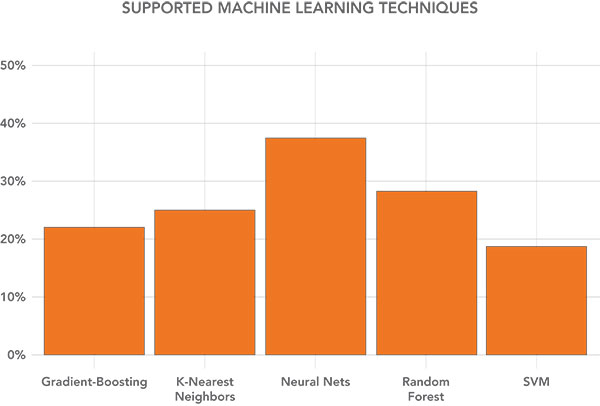
Most software has multiple linear regression along with various univariate time-series models such as ARIMA or exponential smoothing. Since the 2018 survey, the trend in adoption of ML algorithms has continued apace, and many vendors have implemented new algorithms as illustrated in Figure 1. This includes different kinds of neural networks, the most popular of which in our survey is a feed-forward neural network. However, the more promising type of neural network, Long Short-Term Memory (LSTM), is, for example, used by Amazon for its forecasting and inventory management [3] but has not yet been adopted by many companies. Similarly, gradient boosting methods, such as XGBoost [4], which performed well in recent forecasting competitions, are only available in seven out of 32 software solutions.
When it comes to the forecasting process, demand planners tend to make ad-hoc judgmental adjustments. This feature is supported in about 65% of the participating packages. It is also good to see that those corrections seem to be stored in the history of many systems for further analysis. About two-thirds also provide tools for new product forecasting, most often in the form of using analogies.
An aspect that in our view seems to be neglected by many software vendors is LASSO and other regularization techniques (just at 15%), which are advanced variable selection and model estimation methods [5]. Although software solutions commonly include other methods to select variables automatically, LASSO is particularly helpful when there are a large number of variables with few observations [6], a feature often seen in promotional modeling.
Forecast Evaluation
A crucial step in forecasting is adequately evaluating forecasting models. This includes the appropriate selection of error measures, out-of-sample cross-validation, tracking judgment history and comparison with past forecasting accuracy. It seems that software vendors over the years have started implementing a more structured evaluation process. Some 78% of respondents’ software allows splitting data into train and test sets, and offers a wide range of error measures. However, about one-third of the software solutions do not come with a rolling origin evaluation [7], which is natural for tracking the day-to-day performance of models, and the ability to directly compare with benchmarks to calculate something like forecast value added [8]. That said, it seems surprising that simple models such as the Random Walk are not widely available in the software to allow for a basic forecast evaluation – only 53% of respondents said that this forecasting model is implemented (although in most cases it could be easily programmed in).
Likewise, one-third of software is not able to track statistical forecasts and expert corrections. This is important because it allows users to assess the performance of the different forecasting approaches, identify consistent errors and make corrections in the forecasting process when necessary.
Analyzing the feedback we have received from the survey, one of the participants commented on the use of prediction intervals in practice. They indicate that although the feature is offered by roughly two-thirds of solutions, it remains a rare request from practitioners. The lack of interest in assessing uncertainty can also be illustrated in a recent large-scale, online forecasting competition where the number of teams competing in the uncertainty track was much lower than the number in the point forecasts track [9, 10]. In the business environment, the main reason for this might be that many areas use a disjoint forecasting approach, where point forecasts are directly fed into a system that makes final decisions such as the reorder level. Usually, no evaluation is made available for the estimates of the error distribution and prediction intervals.
While grasping the notion of uncertainty and how it is reflected in prediction intervals would require a further enhancement of the evaluation metrics offered in the software, its value might well prove illusory, given the difficulties of interpretation – understanding uncertainty has long been established as an underdeveloped human skill. We hope that with the rise of popularity in recent forecasting competitions, the interest in having prediction intervals will rise as well because they are critical in many applications, including those in the specialist areas of inventory control and energy.
Scaling up Forecasting Activity
Despite client- and server-based versions, now nearly two-thirds of the solutions also come as a cloud service. Thus, the entire software runs as a service without many of the hardware or software requirements if it were to be in-house. Cloud computing and its ability to scale is one of the key drivers in the adoption of more advanced forecasting approaches that require higher computational costs such as ML or AI algorithms. That said, many vendors support data cluster frameworks such as SPARK or Hadoop. Almost all the participating software solutions support direct database connectivity with most database standards via the ODBC or other connectivity protocols. More than 80% of the software in our sample comes with cloud connectivity to various platforms such as large-scale cloud databases like Google BigQuery. Moreover, about two-thirds of the participating forecasting software solutions integrate with several popular ERP systems.
Another interesting finding is that since the last survey, software has become more open. For example, many software vendors now support open-access storage formats and allow a competitor to read their previously proprietary file formats. Together with the trend of using “software as a service,” it lowers some of the potential switching costs and makes purchase decisions less likely to result in a locked-in exclusive ecosystem, which used to happen in the past.
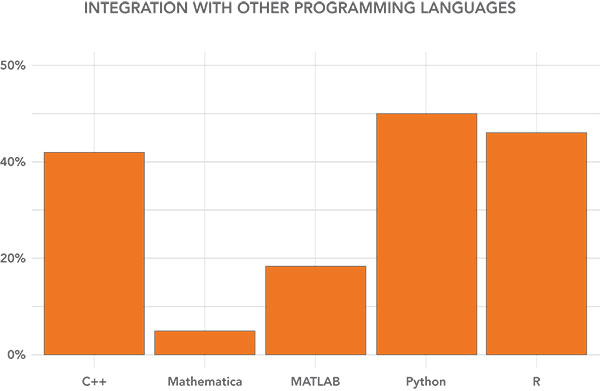
While many of the general-purpose software include a complete programming environment, recently an alternative software solution is to directly allow running open-source code for R and Python (Figure 2), which substantially extends the software’s potential capabilities. These programming languages have state-of-the-art algorithms; however, the practitioner should keep in mind that it takes an effort to make them work in a business environment. For example, R is good for prototyping for a data science team, but it often fails to scale. That said, both languages have excellent support from the community and a multitude of freely available packages, with Python being more versatile, faster and more suitable for ML. But it is a dangerous and potentially expensive decision to assume that a particular feature, such as an error evaluation, can easily be programmed into the standard package.
Choosing the Right Software
Overall, the software market has become more competitive as many software solutions have become less distinguishable in terms of forecasting functionality over the last few years due to more open access standards and integration with other programming languages. This shift, however, means that establishing a unique selling proposition might no longer be achievable through the algorithms alone, and the decision on software provision is more likely to be dependent on how well it integrates into the current IT systems and organizational processes. The consequence is the software purchase is elevated to a strategic decision.
The majority of software is now offering a subscription-based license. Software as a service always comes at the cost of an increased dependency on a third-party provider (i.e., a cloud server). A variety of IT security, accessibility and infrastructure standards exist to guarantee service quality, and it is vital to carefully assess the desired standards. We note that just about half of the providers with cloud services answered questions regarding quality standards, which suggests that there might be quite a difference between providers. Companies should also be careful in checking the requirements that come from data protection laws – not all providers have the ability to take such requirements directly into account, and late detection might cause severe costs.
Much of the difference between software companies is with the training and support they offer. Only a handful of vendors offer free support; the majority of companies have it included in the license, with a third providing support for additional costs. There is also a difference between the types of assistance. While most vendors offer email support, some also provide access to in-house forecasting expertise that can provide support beyond solving software-related problems. In many cases, the level-of-service agreement can be set individually up to the level where forecasts are offered as a service. An import criterion in selecting software could also be the geographical proximity to the software provider. Although all software vendors indicated that they operate globally, a safer option is to have an office of the company in the same time zone. Otherwise, troubleshooting across different time zones can become cumbersome.
Last but not least, a very crucial aspect of the software is their ease of use – a criterion that is very hard to assess within a survey and requires thorough testing in practice. However, we noticed that multiple vendors mentioned significant changes in terms of user interface since the last survey, noting improved ability to visualize code or handle data. In addition, some vendors have started highlighting the support for collaborative features that allow simultaneous work within teams and across external organizations (such as suppliers).
Trends in Software Provision
As the world struggles to find its way out of the COVID-19 pandemic into some version of a “new normality,” it is becoming increasingly clear that the way many businesses operate has or will dramatically change. The challenges of planning in the uncertain post-crisis world will no doubt affect the way companies approach forecasting and hence their software requirements. Multiple software vendors have indicated that the unprecedented shift in demand has caused the fracturing of support systems on the client side. In many cases, this is due to previously unobserved demand breaking the limits of automated forecasting software.
For many organizations, the main goal remains that their forecasting software delivers rapid calculation of forecasts and associated statistics, which at the same time are robust and meaningful and can easily be updated once new data becomes available. The pandemic has shown that for disruptive events, it is important that the forecasting software is able to accommodate expert judgment with probabilistic and scenario-based forecasting. Such features are also useful to help address a question many businesses are concerned with regarding when demand might return to normality and how useful are data and any patterns observed during the crisis. Given the experience during the pandemic, we would expect that features like prediction intervals and judgmental adjustments will play a more important role in future software development.
We believe that one of the important aspects for many organizations is automating the process of prediction in cases where: 1) the number of time series is potentially very large; 2) some of them share similar characteristics or influence each other; and 3) the frequency with which new observations are obtained is high. The COVID-19 crisis has highlighted the following additional characteristics: 4) there is potential structural instability in the data generating process; and 5) there is little prior knowledge about the characteristics of each of these series.
All these aspects are characteristics of big data; for example, they are often seen when forecasting individual product demand for a large supermarket chain. In this case, the number of products is measured in tens of thousands of units, new data is obtained after each customer checkout, the customer decisions influence sales of competing products, and structural instability can arise due to both predictable (e.g., promotions) and unpredictable events (e.g., new product launch or a competitor’s promotion). In this setting, it is difficult (if not impossible) for human analysts to study each time series in question and apply appropriate forecasting methods. And while there are method-selection algorithms, using, for example, cross-validation and/or information criteria, the ML-based automated approaches to identifying key time series characteristics, performing variable selection and ultimately generating forecasts are becoming more popular. This is the case from a software provider perspective; how they are used in practice remains an open question.
The ML methods have achieved good results in recent competitions (i.e., M4 [11] and the forthcoming M5, Kaggle) [9, 10]. This influences the models requested by practitioners. For example, the M4 winning method [12] has increased interest of practitioners in hybrid forecasting methods that combine statistical methods with machine learning. Also, several software vendors report increased interest from companies in forecasting with leading indicators where ML methods are a natural candidate given the multivariate nature of such problems. Since the identification of multiple leading indicators is often done from very large datasets [6], we foresee that effective variable selection including the use of Internet and social media data [13] will become more important over the next couple of years.
What impact will these features of increased instability and limited prior knowledge have on the adoption of ML and AI in forecasting software, one of the most identifiable trends from software vendors contributing to this survey? Several companies have pointed out that they have successfully used ML to tackle the COVID-19 crisis and changing patterns in demand. However, such methods are typically not transparent and usually do not combine well with the expert judgments made in the organization.
That said, we should point out that every specific case in every specific company needs a particular solution, and there is no ultimate best algorithm available that performs well for all forecasting problems [14]; results are circumstance specific. In many cases, such classical statistical methods as exponential smoothing or regression do a great job and do not need to be substituted by the complex, sophisticated methods. However, many data science degrees focus on more sophisticated forecasting approaches that will inevitably shape future software demand in many organizations. In others, the forecasting role is often taken by demand planners, being a part of a sophisticated organizational process where the complexities of these new methods create obstacles in their day-to-day usage.
There are many excellent niche or general-purpose software products, which makes selecting the appropriate system challenging. While this survey provides an initial overview of the functionality available, it has not aimed at addressing all relevant decision points – many of them come down to extensive software testing, forecasting process analysis and benchmarking, effectively carrying out a mini-competition on the organization’s own data. But it should help with making up a short list. We aim to continue monitoring the changing market and provide an update – see you in 2022!
Acknowledgments
The authors thank Michele Trovero (SAS), William Tonetti (DemandWorks) and John Boylan (CMAF, Lancaster University) for their valuable feedback on the early versions of the survey; and Ján Dolinsky and Mike Thomas (both from Tangent Works) and Igor Gusakov (GoodsForecast) for their feedback on the survey at later stages.
Editor's Note
A directory of vendors who participated in this year’s forecasting software survey is available online, along with summarized tables of the collected data, which include product descriptions, capabilities and targeted industries. Vendors who did not respond by the deadline but would like to be added to the online listings or want to participate in the 2022 survey should get in touch with the authors at [email protected].
References
- Fildes, R., Schaer, O., and Svetunkov, I., 2018, “Forecasting 2018,” OR/MS Today, Vol. 46, No. 3 (June), pp. 44-46.
- Snyder, R. D., Ord, J. K., and Beaumont, A., 2012, “Forecasting the intermittent demand for slow-moving inventories: A modelling approach,” International Journal of Forecasting, Vol. 28, No. 2, pp. 485-496.
- Alexandrov, A., Benidis, K., Bohlke-Schneider, M., Flunkert, V., Gasthaus, J., Januschowski, T., Maddix, D.C., Rangapuram, S., Salinas, D., Schulz, J., Stella, L., Türkmen, A.C., and Wang, Y., 2019, “Gluonts: Probabilistic time series models in Python,” arXiv:1906.05264.
- Chen, T., and Guestrin, T., 2016, “XGBoost,” Proceedings of the 22nd ACM SIGKDD International Conference on Knowledge Discovery and Data Mining, arXiv:1603.02754.
- Hastie, T., Tibshirani, R., and Wainwright, M., 2015, “Statistical Learning with Sparsity: The Lasso and Generalizations,” Boca Raton, FL: CRC Press.
- Sagaert, Y.R., El-Houssaine, A., Kourentzes, N., and Desment, B., 2018, “Tactical sales forecasting using a very large set of macroeconomic indicators,” European Journal of Operational Research, Vol. 264, No. 2, pp. 558-569.
- Tashman, L.J., 2000, “Out-of-sample tests of forecasting accuracy: An analysis and review,” International Journal of Forecasting, Vol. 16, No. 4, pp. 437-450.
- Gilliland, M., 2010, “The Business Forecasting Deal: Exposing Myths, Eliminating Bad Practices, Providing Practical Solutions,” John Wiley & Sons.
- Kaggle Competition, 2020, M5 Forecasting, “Uncertainty: Estimate the uncertainty distribution of Walmart unit sales,” https://www.kaggle.com/c/m5-forecasting-uncertainty/overview/description.
- Kaggle Competition, 2020, M5 Forecasting, “Accuracy: Estimate the unit sales of Walmart retail goods,” https://www.kaggle.com/c/m5-forecasting-accuracy.
- Makridakis, S., Spiliotis, E., and Assimakopoulos, V., 2020, “The M4 competition: 100,000 time series and 61 forecasting methods,” International Journal of Forecasting, Vol. 36, No. 1, pp. 54-74.
- Smyl, S., 2020, “A hybrid method of exponential smoothing and recurrent neural networks for time series forecasting,” International Journal of Forecasting, Vol. 36, No. 1, pp. 75-85.
- Schaer, O., Kourentzes, N., and Fildes, R., 2019, “Demand forecasting with user-generated online information,” International Journal of Forecasting, Vol. 35, No. 1, pp. 197-212.
- Fildes, R., 2020, “Learning from forecasting competitions,” International Journal of Forecasting, Vol. 36, No. 1, pp. 186-188.
|
Product Name |
Vendor Name |
Industries Targeted |
Company Website |
|
Adexa Predictive Analytics |
Adexa Inc |
Energy, Manufacturing, Retail |
|
|
Alyuda Forecaster XL |
Alyuda Research LLC |
Energy, Finance, Insurance, Manufacturing, Public Administration, Retail, Services |
|
|
Analytica |
Lumina Decision Systems |
Energy, Finance, Insurance |
|
|
Arkieva |
Arkieva |
Energy, Manufacturing, Retail, Wholesale |
|
|
Autobox |
Automatic Forecasting Systems Inc |
General purpose |
|
|
Azure Auto ML |
Microsoft |
General purpose |
|
|
Cognira Retail Science Platform |
Cognira |
Retail, CPG, Grocery, Apparel |
|
|
Dataiku Data Science Studio |
Dataiku |
General purpose |
|
|
Evo |
Evo Europe Limited |
Finance, Insurance, Manufacturing, Retail, Services, Transportation, Wholesale |
|
|
FC+ |
JD Forecasting |
Pharmaceutical |
|
|
Forecast Pro |
Business Forecast Systems |
General purpose |
|
|
Fuse Inventory |
Fuse Inventory |
Retail, Wholesale |
|
|
FutureMargin |
Algopine |
Retail and e-commerce |
|
|
gretl |
gretl |
General purpose |
|
|
iData |
MJC |
Construction, Manufacturing, Services, Transportation, Utilities |
|
|
iqast forecast desktop/server |
RSG Software GmbH |
General purpose |
|
|
Minitab Statistical Software |
Minitab |
General purpose |
|
|
Nominator |
Matrica |
Energy, Finance, Insurance, Services, Transportation, Utilities |
|
|
NumXL |
Spider Financial Corp |
Energy, Finance, Insurance, Manufacturing, Services, Utilities |
|
|
Optimact |
Optimact |
Construction, Manufacturing, Wholesale |
|
|
Optimal Economist |
Transpower Corporation |
Economists |
|
|
Optimal Scientist |
General purpose |
||
|
Prophecy |
Data Perceptions |
Manufacturing |
|
|
RastPro |
IDEUM |
Manufacturing, Utilities, Wholesale |
|
|
SAS Energy Forecasting |
SAS Institute |
Energy, Utilities, Wholesale |
|
|
SAS Forecast Server |
General purpose |
||
|
SAS Visual Forecasting |
General purpose |
||
|
SigmaXL Version 9 |
SigmaXL, Inc. |
General purpose |
|
|
Stata |
StataCorp |
General purpose |
|
|
Tangent Information Modeller |
Tangent Works B.V. |
General purpose |
|
|
The Finished Goods Series |
E/Step Software Inc. |
Agriculture, Forestry and Fishing, Communications, Construction, Energy, Finance, Insurance, Manufacturing, Mining, Retail, Services, Transportation, Utilities, Wholesale |
|
|
Unified Demand Forecasting |
SAP |
Manufacturing, Retail, Wholesale |
Robert Fildes is the founding director of the Centre for Marketing Analytics and Forecasting, Lancaster University, U.K. The Centre’s objective has been to develop new research on the business forecasting and marketing analytics problems that organizations face and help bridge the gap between research and practice. He is the co-author of “Principles of Business Forecasting (2nd ed.),” (Wessex, 2017). Oliver Schaer is an assistant professor of business analytics at Drexel University, LeBow College of Business. His research focuses on demand forecasting and developing methods for new product forecasting. Ivan Svetunkov is an assistant professor of marketing analytics at the Centre for Marketing Analytics and Forecasting, Lancaster University, U.K. His main area of interest is developing statistical methods for forecasting. You can learn more about forecasting on his blog and how to forecast with univariate models using his R packages on forecasting.svetunkov.ru Alisa Yusupova is an assistant professor of marketing analytics at the Centre for Marketing Analytics and Forecasting, Lancaster University, U.K. Her research interests include development of dynamic models with application to analysis and forecasting of real estate prices.
([email protected])

([email protected])

([email protected])

([email protected])