
September 30, 2022 in Art Optimization
Foregrounding Operations Research in Modern Art
SHARE: PRINT ARTICLE: https://doi.org/10.1287/orms.2022.05.16

The mathematician does not study pure mathematics because it is useful; he studies it because he delights in it and he delights in it because it is beautiful. – Henri Poincaré (1854–1912)
Operations research (O.R.) has a long history contributing to supply chain management, transportation routing and other business problems. Less well known is the use of O.R. tools in nontechnical fields and for noncommercial purposes. Such applications include humanitarian operations, such as refugee resettlement and post-disaster relief operations, and research in the liberal arts, such as analysis of alternative outcomes for historic military battles and assessment of library use and management.
Where O.R. goes outside of business and information technology is intriguing to the research. Lindner’s sister is a visual artist, and her career inspired the authors to search for instances of O.R. in the visual arts. Consequently, they discovered how O.R. has appeared in the production of pieces of modern art via reframing of the traveling salesman problem (TSP) and the application of linear optimization and graph partitioning.
Traveling Salesman Problem
The TSP is a classical question in operations research. The objective in the TSP is to identify the best route through N cities, represented by points, that visits each city exactly once and returns to the origin city. The “best” route might be the shortest (distance), least expensive (sum of the costs of each leg of the journey) or a combination of the two.
Dr. Robert Bosch, James F. Clark Professor of Mathematics at Oberlin College and Conservatory, has gained a reputation for creating “optimization art,” which he details in his 2019 book “Opt Art: From Mathematical Optimization to Visual Design” [1]. Among his inventions is visual art made by treating classic paintings and prints as canvases on which a TSP may be overlaid.
Consider the “Mona Lisa” by Leonardo da Vinci, arguably the most famous painting in the world. In place of the lines and curves that form the original painting, Bosch converted the “Mona Lisa” into a series of tens of thousands of dots representing “cities” in the TSP [2]. The optimal solution to the TSP is the continuous-line drawing of the original “Mona Lisa” that is as accurate as possible.
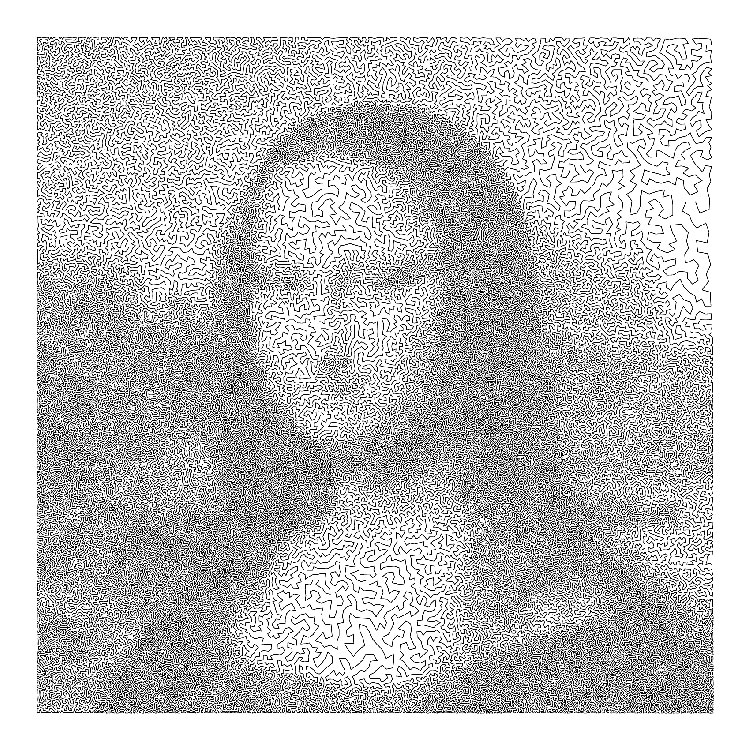
For small-scale routes of, say, five cities, an analyst could determine the optimal route by trying each of the possible solutions. Manually dealing with the 100,000 “locations” that make up Bosch’s “Mona Lisa” problem, however, would be a feat of inhuman endurance and an impossible life span. Hence, mathematical optimization tools, which are often employed in O.R. work, are essential to this TSP art [4].
These experiments in reproducing works of traditional art through mathematical methods are a fun exercise of optimization theory and worth trying. In the case of the “Mona Lisa,” successful efforts to find a route shorter than the current best solution also entail a cash prize of $1,000 [2]! The current best TSP solution for the “Mona Lisa,” depicted as in Figure 1, was found in 2009 by Yuichi Nagata and has a length of 5,757,191 units, which is 107 more than the lower bound that Cook has identified for an optimal solution [2].
Domino Mosaics
Consider a single set of dominoes, which contains 55 rectangular tiles. Ignoring some “messy details of geometry and orientation, there are more than 1073 ways of placing the 55 tiles” [6]. Now consider 44 sets of dominoes. There are millions of ways to place all 2,420 tiles. What are the odds that one of these arrangements will produce a portrait of former U.S. President Barack Obama?
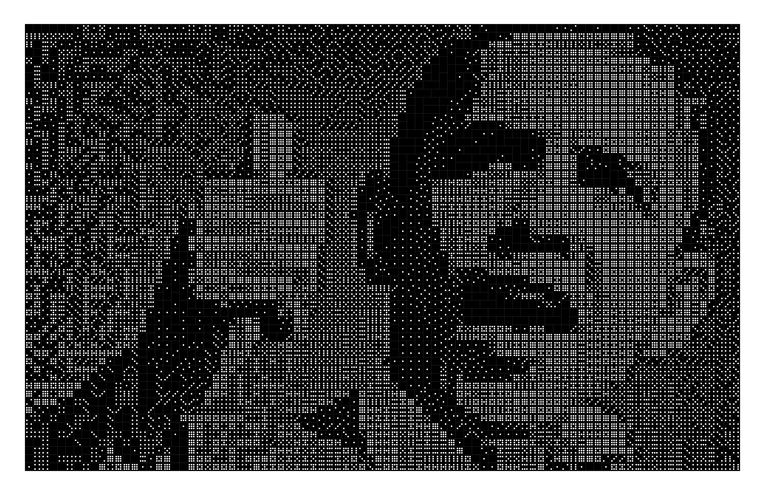
The idea of recreating pictures and photos with dominoes – creating domino mosaics – originates with Ken Knowlton, a computer graphics pioneer and artist who worked at Bell Labs in the mid-20th century. During his tenure at Bell Labs, Knowlton experimented with the new capabilities of then-modern technology to create art. He made computer-assisted “mosaic art” with unconventional art tools, including dominoes. (A summary of Knowlton’s work can be found at https://www.knowltonmosaics.com/.)
Bosch drew inspiration from Knowlton to create more complex domino mosaics. Similar to the TSP art, Bosch aimed to produce the likeness of a monochrome image that “most closely matches the pattern of shadow and light in the original” [6]. His predecessor Knowlton used a two-step process: First, he generated a “pattern of empty domino holders” on a canvas; then, he assigned dominoes to the holders according to brightness, a value based on the number of pips on the domino tile [7]. Bosch diverged by transforming the domino mosaic problem into an integer linear programming problem.
On Bosch’s Domino Artwork site (http://www.dominoartwork.com/downloads.html), beginners can download guides to produce portraits of Abraham Lincoln and Martin Luther King Jr., or recreations of the “Mona Lisa” and the Statue of Liberty using 12 sets of dominoes.
Graph Partitioning
Graph theory is a discipline focused on graphs, mathematical structures that model pairwise relationships between objects. It began as a recreational math problem but has evolved into a prominent field of mathematics with applications in chemistry, operations research, social sciences and computer science.
Partitioning a graph is a critical step in parallelizing graph algorithms (graph partitioning). It divides a complex problem into multiple, more manageable subproblems that may be solved in parallel. Graph partitioning algorithms are executed using edge or vertex separators, depending on the algorithm. Effective partitioning can reduce the time and effort to solve the problem.
How does graph partitioning connect to art? Consider INFORM, a software company that provides digital decision-making based on artificial intelligence (AI) and O.R. The company uses an effective algorithm for graph partitioning to solve routine projects, the results of which have surprising artistic value. One context in which an algorithm developed by INFORM was used for a routine project and transformed into art is a bill of materials (BOM) structure [8].
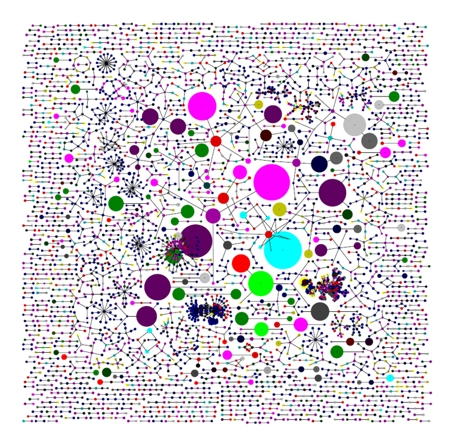
A BOM details the components and assemblies needed to construct a comprehensive network structure. Oleg Shilovitsky, software developer and CEO of OpenBOM, highlights the importance of graph theory in transforming the BOM into a graph that will be helpful in production planning and analysis [10]. The network artifact that results from the synthesis of many BOMs can serve as a model for analyzing product information and the relationships between the components that compose the graph [11]. Shilovitsky notes that this network can also be a source of artistic interest.
Our interaction with Kai Keppner, head of corporate marketing at INFORM, revealed that the BOM structure seen in Figure 3 is where he first realized the artist’s value of supply chain project visualizations. In this, the 5,564 nodes represent a completed product, or precursor to a complete product, and nodes of the same color share the same production resource. Greater size indicates that the completed product consumed a higher percentage of the given resource. This graph is an aggregation of 52 mappings of weekly production capacities over a single year.
Unlike the TSP art and domino mosaics, the creators of these graphs had no intention of creating art. Keppner saw this graph displayed on the wall behind a colleague’s desk and assumed that it was a work of abstract art. His mathematical colleague clarified the content of the graph, but Keppner still thought it should be framed [12]. Unintentionally, the BOM structure mimicked features of modern art, and from that day forward Keppner began looking at his work through a more visual, artistic lens [8]. Other supply chain projects that use graph partitioning algorithms, such as workforce planning and aircraft scheduling, exhibit similar features.
Conclusion
The use of O.R. in producing modern art is relatively unknown, but there is an amazing store of examples to be discovered. This article covers only a fraction. Not discussed here, to name a few, are extensions and modifications of TSP art to more complicated puzzles, such as Celtic knots or labyrinth designs [1], and mosaics that use materials other than dominoes, such as seashells (see the work by Knowlton in the 1990s and early 2000s).
Keppner sees two levels of beauty in optimization algorithms translated into graphs: “[t]he visual form, which everyone can appreciate, and the underlying aesthetics of pure numbers, which is only accessible to a smaller group of mathematicians” [13]. This idea can be applied to the graph partitioning done by decision-making companies and extended to the less conventional graphs of TSP portraits and domino and more.
Authors’ note. Many thanks to Dr. Robert Bosch for his corrections and input on the early drafts of this article.
Notes & References
- Robert Bosch, 2019, “Opt Art: From Mathematical Optimization to Visual Design,” Princeton, NJ: Princeton University Press.
- Cook, W., 2022, “Mona Lisa TSP challenge,” http://www.math.uwaterloo.ca/tsp/data/ml/monalisa.html and “Graph partitioning,” https://patterns.eecs.berkeley.edu/?page_id=571.
- Source: https://www.math.uwaterloo.ca/tsp/data/ml/monalisa.html. The “Mona Lisa” TSP was commissioned by William Cook. The point set was designed by Robert Bosch and the tour was obtained by Yuichi Nagata. The image can also be found on page 108 of Robert Bosch’s “Opt Art.”
- Klotz, E., “Finding mathematical optimization in unexpected places: The art world,” Gurobi Optimization, https://www.gurobi.com/resource/finding-mathematical-optimization-in-unexpected-places-the-art-world/.
- Source: https://www2.oberlin.edu/math/faculty/bosch/barack-obama-domino-plans.html. Permission obtained from Dr. Robert Bosch on May 2, 2022. This image can also be found on page 82 of Robert Bosch’s “Opt Art.”
- Hayes, B., 2020, “Mathematical mosaics,” American Scientist, 108, No. 3, p. 184, https://www.americanscientist.org/article/mathematical-mosaics.
- Cambazard, H., J. Horan, E. O’Mahoney and B. O’Sullivan, 2011, “Domino portrait generation: A fast and scalable approach,” Annals of Operations Research, Vol. 184, No. 1, pp 79-95.
- Keppner, K., 2015, “The thin line between operations research and modern art,” INFORM, Nov. 23, https://www.inform-software.com/blog/post/the-thin-line-between-operations-research-and-modern-art.
- Source: https://www.inform-software.com/blog/post/the-thin-line-between-operations-research-and-modern-art. Permission obtained from Kai Keppner on May 4, 2022.
- Shilovitsky, O., 2020, “Graphs, networks, and BOMs – Part 1,” OpenBOM, April 13, https://www.openbom.com/blog/graphs-networks-and-boms-part-1.
- Shilovitsky, O., 2020, “OpenBOM: Graphs, networks, and bill of materials – Part 3,” OpenBOM, April 28, https://www.openbom.com/blog/openbom-graphs-networks-and-bill-of-materials-part-3.
- Kai Keppner, personal interview, May 6, 2022.
- Keppner, K., 2015, “Supply chain, operations research and modern art,” All Things Supply Chain, 23, https://www.allthingssupplychain.com/supply-chain-operations-research-modern-art/.
Abigail Lindner is a recent graduate of Regent University, where she earned a B.S. in mathematics. She is currently enrolled as a Ph.D. student in the mathematics program at Worcester Polytechnic Institute in Massachusetts. Her research interests lie in the nonprofit sector and theoretical ecology. Abigail has served as an editorial staff writer with OR/MS Tomorrow since the spring of 2020. Nandan Kumar Singh is an assistant professor in the Operations Management and Decision Science Area at FORE School of Management, New Delhi, India. He was a postdoctoral fellow in Production and Operations Management Department at the Indian Institute of Management Bangalore. He holds a Ph.D. in production and operations management from the Indian Institute of Management Visakhapatnam and previously served as a Visiting Research Scientist at New York University. Nandan also holds a Micro Masters credential in Supply Chain Management from Massachusetts Institute of Technology (MIT), Centre for Transportation and Logistics.