
September 8, 2026 in Stochastic Data
Using Stochastic Data Systems
Applications in Budgeting, Cybersecurity, and Operations Planning
SHARE: PRINT ARTICLE: https://doi.org/10.1287/orms.2026.03.15
The “Flaw of Averages”1 describes systematic errors that occur when uncertain quantities are replaced by single average values. This violates principles such as Jensen’s inequality, the Law of Large Numbers, and statistical dependence.
Traditionally, these errors were addressed with Monte Carlo simulation. But Monte Carlo typically outputs static statistics such as averages, standard deviations, and confidence intervals, which reintroduce the Flaw of Averages in downstream calculations. Stochastic data solves this problem.
With stochastic data, uncertainty is not merely summarized. It is preserved and propagated through stochastic data systems as a new data type that obeys the laws of arithmetic and the laws of probability.2 Averages don’t just mask errors; they lose the statistical relationships between variables. Consequences include hidden costs in budgeting, understated risk in cybersecurity, and ineffective plans in defense operations. We present here three representative examples across finance, cybersecurity, and military planning with different failure modes, but the same fix: stochastic data.
Coherent Stochastic Data
Stochastic data (from the Greek stokhastikós, “making an informed guess”) is comprised of vectors, or virtual vectors of potential outcomes of uncertainties called SIPs (stochastic information packets). They may be operated on with vector arithmetic, but may also support any statistical function, such as average or percentile calculations (see Fig. 1).
Imagine a Monte Carlo simulation of 100 departmental budgets. If department 67 moves to another division, the entire simulation must be rerun. Today you can simply subtract department 67’s SIP from the total. We call this sharp line between simulation and Stochastic Data “unsimulation.”
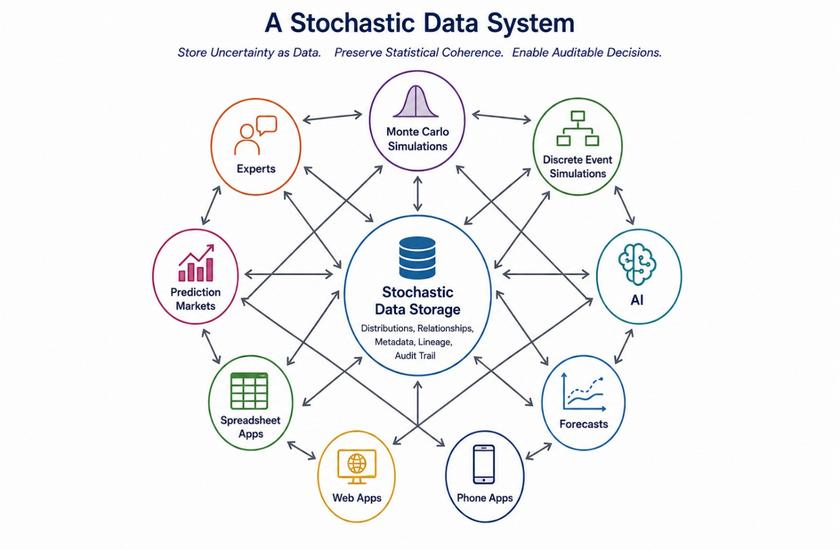
Figure 1: Schematic of a Stochastic Data System
Simulation is a Process; Stochastic Data Is a Data Type
Although pioneered in the 1980s,3 such data was formally standardized in 2014,4 revolutionized in 2022,4 and made fully accessible in 2026 by AI.5
It provides five practical advantages by being:
- Actionable: Feeds downstream stochastic models
- Arithmetical: First class objects support all numerical operations (see “unsimulation” above)6
- Auditable: Deterministic and traceable
- Agnostic: Portable across platforms
- AI Compatible: Machine learning trains on and yields stochastic data
How can you trust others to generate your random variates? The same way you trust others to generate your electricity. Power plants generate electricity for consumers connected to power grids. Monte Carlo and related methods generate SIPs for stochastic data systems to support decisions by domain experts, not simulation experts.
Conventional data systems preserve values. Stochastic data systems must preserve both values and their statistical relationships. In other words, they preserve statistical coherence.
Recent advances in quantile-function technology7,8 and portable random number generators9 have improved SIP storage efficiency by orders of magnitude, while AI automates SIP creation and app development. This represents a tipping point for chance-informed decisions, which enables interactive applications we call “ChanceOmeters.” These are accessible on your phone or computer through QR codes and links
in this article.
Here, we show how the ability to add and subtract SIPs in the finance sector delivers a payoff we call “money for nothing.” In the cybersecurity sector, we explain how SIPs enable an actionable estimate of exceedance probabilities. And in the military sector, we describe how planners can update probabilities as evidence arrives from testing or the battlefield.
Finance: Money for Nothing
Budgets are a fact of life. Nobody likes being reprimanded for blowing a budget, so the natural instinct is to add a cushion (“sandbagging”) so you can dodge and weave in an uncertain world. There is a hidden cost to this cushion, but with the help of stochastic data, we can literally mint money for nothing.
Suppose each budget owner adds a cushion to ensure an 80% chance of staying within budget. What is the cost of this cushion versus budgeting at the “expected” level? When aggregated to the enterprise, the cost can be significant, even when allowing some cushion across the organization. This version of the Flaw of Averages is called the “Flaw of Extremes,” another result of the laws of probability. In budgeting, we call it the “sandbag effect.”
The sandbag effect typically reveals itself mid-year when the accumulated budget surpluses across the enterprise become obvious. It is too late to fund important initiatives by year end, and budget owners launch wasteful “use it or lose it” spending to preserve run-rate.
There is a better way.
We can transform financial forecasts into stochastic data derived from past budget data, which preserves the history of variances between budget and actuals. The stochastic forecast data reveals the degree of sandbagging we might expect in future forecasts.
Suppose the expected spend for an individual budget is $1 million, but it is forecasted at $1.17 million, providing enough cushion to meet the budget 80% of the time. When we combine two budgets (assumed to have identical expected spend and cushion) to the enterprise level, there is an 88% chance of meeting the aggregate budget – not 80%. Why? Because it is unlikely that both are blown simultaneously. Combined budgets are diversified.10
Summing the stochastic data across budgets reduces the sandbag effect, frees investable funds, and at the same time maintains a desired cushion at the enterprise level. For an interactive demonstration of “Money for Nothing” go to Money for Nothing 8-9.4 and conduct the exercise below:
The more budgets and the lower the cushions, the more “money for nothing.” Answer these questions:
1. With two budgets, a company gained nearly $100,000. How much would be saved with 10 budgets?
2. Reduce the organization’s requirements to a 75% cushion. How much more does it save?
To mint “money for nothing,” organizations must establish requirements for staying within budget. They must address sandbagging by providing training in uncertainty (remove biases), revamping incentives (lighten up on those reprimands), and pooling budgets (to offset naturally occurring variances).
Finally, organizations must add stochastic data infrastructure for their entire enterprise, not just budgeting – an initiative that “money for nothing” can help fund and will generate funds many times over. Where this budgeting example demonstrates the cost of aggregating cushioned budgets, the cyber example demonstrates the failure of averages in analyzing thresholds.
Cybersecurity: The Chance of Crossing a Threshold
How secure are our cyber systems – the interconnected hardware, software, networks, and data on which organizations and everyday life increasingly depend? For many decisions, answering that question means knowing the chance that something consequential happens: an attacker reaches data before detection, a vulnerability is exploited before patching, or losses exceed an organization's tolerance. These are threshold questions. They ask not what happens on average, but what is the chance we cross the line?
Cybersecurity, however, is commonly summarized using mean-based metrics: mean time to detect,11 mean time to identify and contain,12 average breakout time,13 and annualized loss expectancy.14 They provide a general idea of “how bad on average?” Median-based reporting15 also masks how far the values extend. These measures describe the center of a distribution; they do not tell us the chance of crossing a threshold.
Figure 2 illustrates this with a simplistic threshold: no penalty until a line is crossed, then the full penalty applies. The average outcome falls safely below the threshold, so the penalty for the average outcome is $0. But 15% of outcomes cross it, incurring a $1 million loss – an average penalty of $150,000. Averages systematically misstate decision-relevant risk wherever thresholds
govern outcomes.
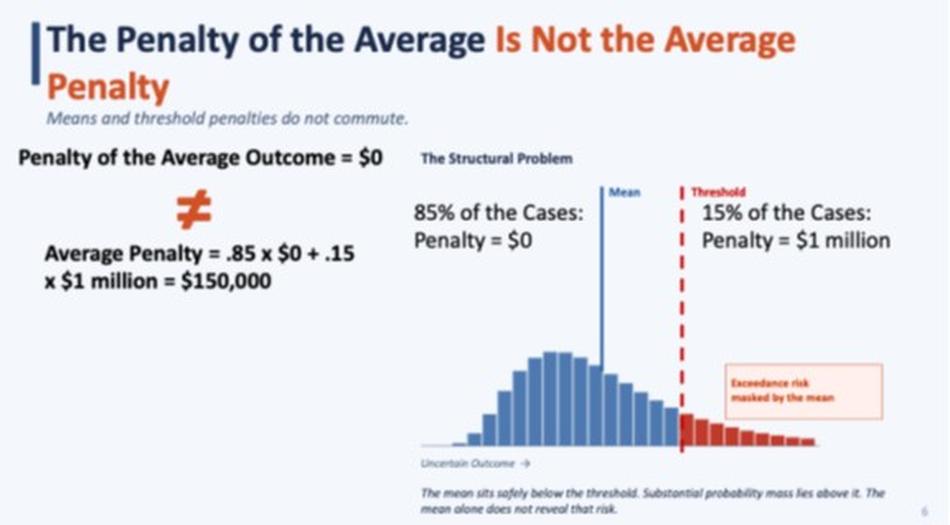
Figure 2: Distribution of Outcomes around a Penalty Threshold
Competing Clocks
Cybersecurity decisions rarely present so clean a threshold. The same problem recurs dynamically as a race between two uncertain processes: attacker versus defender. What matters is not either average time, but the probability the attacker’s clock runs out before the defender’s clock, a question comparing averages cannot answer.
Our demonstration app ....... applies this race to an intrusion-detection problem, using hypothetical data for three uncertainties: time to compromise, time to detect, and daily loss between the two. For simplicity, detection is treated as equivalent to eradication. Loss stops accruing once detected, rather than continuing through containment and remediation, as it typically would in practice.
In “static mode,” the application indicates zero chance of loss because average detection precedes average exploitation. Switching the app to “stochastic mode” explores 10,000 coherent trials. Whenever exploitation occurs before detection, that trial’s daily loss is multiplied by its days of exposure. For an interactive demonstration, go to Race to Detection ChanceOmeter and conduct the exercise below:
In stochastic mode, the app shows a 35% chance of loss with an average loss of $32,888, a far cry from the $0 implied by the average inputs. Suppose a loss of $32,888 is tolerable, but $100,000 is not.
1. What is the chance of exceeding a threshold of $100,000?
2. What is the chance if detection time is reduced by 50%?
Defense Planning: Updating Stochastic Data
The dynamic changes in military planning, new military systems, and operations leave many analytical models sitting on the shelf gathering dust. Stochastic data offers a mechanism to keep operational models up to date in real time.
For example, defense operations in Ukraine, Russia, and the Persian Gulf are being revolutionized by the rapid introduction of new weapon systems like drones and reduced system procurement times. In addition, the use of AI in planning and autonomous systems and the availability of satellite systems (e.g., Starlink) for wartime communications and tactical operations have enabled near real-time mission planning and execution for short- and long-range targets.15
Both the nations involved in current conflicts, and many others not directly involved, have announced plans to significantly increase their defense spending. In this rapidly changing military environment, it will be challenging to balance the procurement of new technologies with the much-larger costs of legacy systems that continue to play an important role in military operations.
Micro Drone Mission Chain
We demonstrate below the benefits of stochastic data in terms of a “micro drone mission chain.” Each drone in the swarm passes through five uncertain stages: Deploy → Available → Reliable → Survivable → Performance → Mission Success, shown from left to right.
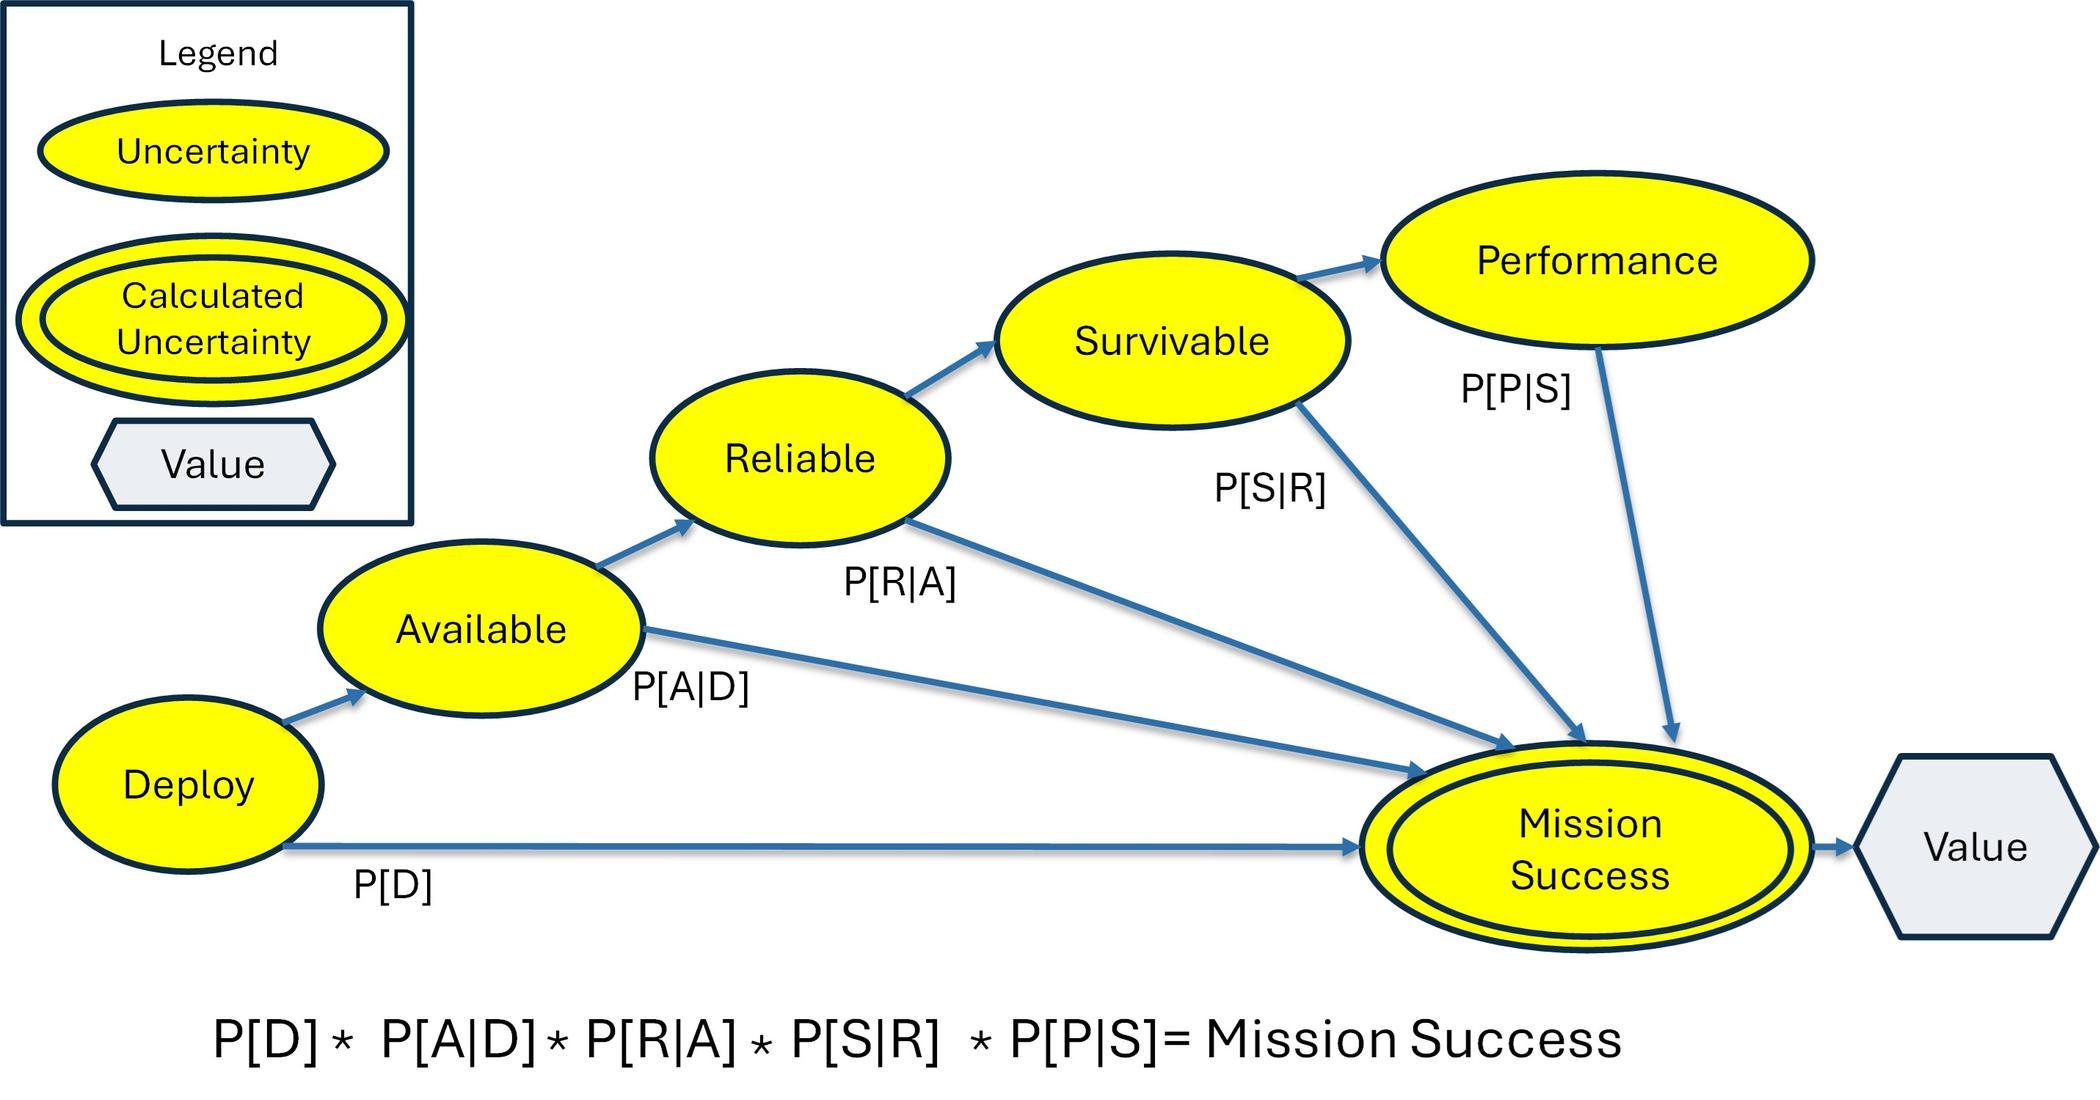
Figure 3. Influence Diagram for an Individual Drone
“Deploy” means to move the swarm to the deployed mission location. “Available” means a deployed drone will be functional at the start of the mission. “Reliable” means an available drone will continue to function during the mission. “Survive” means that a reliable drone will continue to function under the mission conditions, including environmental, cyber, and kinetic threats. Finally, “mission” means each surviving drone will acquire the target and contribute to accomplishing the swarm mission.
This model accounts for the uncertainty in the probabilities for each link of the chain using beta distributions and binomial distribution models –the number of drones in each link. In actual engagement, link probabilities would change in real time through Bayesian updates from test results or mission experience.
Our proof-of-concept app ....... could be used in both planning and operations. In planning, the user estimates the chance of success based on both the number of drones sent and the number of pre-mission tests performed to tighten confidence intervals. The information from testing – the evidence scale – starts at 1 and increases or decreases with more or fewer tests. An operational version of this model would assist a commander in targeting decisions based on real-time battlefield conditions and day-of success. For an interactive demonstration, go to Drone Swarm Mission Chain and conduct the exercise below:
Static Mode, with known probabilities, shows a chance of success at 90%. Stochastic Mode has uncertain probabilities, reducing the chance of success to 76%.
1. How many more drones must be sent to get the chance of success back above 90%?
2. If the number of tests were increased from 10 to 20, how many drones would get us to 90%?
Keeping Uncertainty Intact
Across these three domains, failure results from reducing uncertainty to a single number. The consequences differ, but the fix is the same.
Stochastic data systems keep uncertainty intact: storable, shareable, auditable, and ready for the next calculation. In budgeting, this can reclaim unnecessary cushion; in cybersecurity, reveal risks hidden by averages; and in defense, update success probabilities as evidence arrives. As AI lowers the barrier to creating and using stochastic data, uncertainty turns from a nuisance to be averaged away into a resource for planning, budgeting, defending, and adapting.
Author’s note: The authors of this article are all volunteers with the nonprofit organization, ProbabilityManagement.org, a 501(c)(3) that develops open-source tools and standards for stochastic data.
References
- Sam L. Savage, 2021, The Flaw of Averages: Why We Underestimate Risk in the Face of Uncertainty, Wiley.
- Probability Management, https://www.probabilitymanagement.org/ .
- Dempster, M. A. H. (Ed.), 1980, Stochastic Programming, New York: Academic Press.
- Kirmse, M., Savage, S., 2014, “Probability Management 2.0,” OR/MS Today, INFORMS, https://pubsonline.informs.org/do/10.1287/orms.2014.05.12/full/.
- Savage, S., 2026, “The ChanceOmeter,” OR/MS Today, INFORMS, https://pubsonline.informs.org/do/10.1287/orms.2026.02.10/full/.
- Scott, M., Aldrich, A., 2006, Programming Language Pragmatics,” San Francisco: Morgan Kaufmann, p.p. 140. ISBN 9780126339512. Norman Ramsey.
- Keelin, T. W., 2016, “The Metalog Distributions,” Decision Analysis, Vo., 13, No. 4, pp. 243-277.
- Hadlock, C., Bickel, J. E., 2017, “Johnson Quantile-Parameterized Distributions.” Decision Analysis, Vol. 14, No. 1, pp. 21-34.
- Probability Management, “HDR Random Number Generator,” https://www.probabilitymanagement.org/hdr.
- Kavanagh, S., 2021, “Don’t Go It Alone: Pooling Budgetary Risk to Save Money on Your Budget,” Government Finance Review, https://www.gfoa.org/materials/dont-go-alone_gfr0621.
- National Institute of Standards and Technology, 2012, “Guide for Conducting Risk Assessments,” NIST Special Publication 800-30, Revision 1, Gaithersburg, MD: U.S. Department of Commerce, https://csrc.nist.gov/publications/detail/sp/800-30/rev-1/final.
- Kessem, L., 2025, “2025 Cost of a Data Breach Report: Navigating the AI Rush Without Sidelining Security,” IBM, https://www.ibm.com/think/x-force/2025-cost-of-a-data-breach-navigating-ai.
- CrowdStrike, 2026, “CrowdStrike 2026 Global Threat Report,” https://www.crowdstrike.com/en-us/global-threat-report/.
- Mandiant, 2026, “M-Trends 2026 Report,” https://cloud.google.com/security/resources/m-trends-executive-edition.
- Trofimov, Y., 2026, “There’s a New Way of War, but Is it Evolution or Revolution?” Wall Street Journal, https://www.wsj.com/world/war-tech-change-c22ec6d6.
Sam L. Savage is the author of The Flaw of Averages: Why We Underestimate Risk in the Face of Uncertainty, the book that started the probability management revolution. He is executive director of ProbabilityManagement.org, a 501(c)(3) nonprofit that has been cited in the MIT’s Sloan Management Review for “improving communication of uncertainty.” He is also a consulting professor at Stanford University and a fellow of the Judge Business School at Cambridge University. Savage is the inventor of the stochastic information packet (SIP), a data structure that lets simulations communicate with each other, and he is the chief architect of the SIPmath Modeler Tools. He holds a PhD in computational complexity from Yale University and is a longtime member of INFORMS. A scholar/practitioner specializing in national security, Karen brings experience across defense education and research institutions including the Army Cyber Institute at the U.S. Military Academy at West Point, Air University, and the Naval Postgraduate School. Her roles have included research leadership, curriculum development, faculty leadership, and cross-sector collaboration at the intersection of technology, security, and policy. She holds a PhD in political science from the University of British Columbia and is affiliated with Janos LLC and Stanford University’s Center for International Security and Cooperation. She is the former dean of the Air Force Cyber College. Dr. Gregory Parnell is the former president of the Decision Analysis Society and Fellow of INFORMS. Currently, he is a Professor of Practice in the Department of Industrial Engineering at the University of Arkansas. His research interests include decision and risk analysis and systems engineering. He is the co-editor of Decision Making for Systems Engineering and Management, (3rd Ed, 2022) and lead author for the Handbook of Decision Analysis, 2nd ed, 2025. Matthew Raphaelson was the CFO for a large financial services business unit for 25 years. He has broad experience in finance, data science, and risk management. Matthew is currently advising the California Public Utilities Commission on upgrading its Risk Decision Framework by tying together the concepts of risk management, financial discipline, and chance-informed decisions.