

April 4, 2011 in Thinking Analytically
Connected and infected
SHARE: PRINT ARTICLE: https://doi.org/10.1287/LYTX.2011.02.12
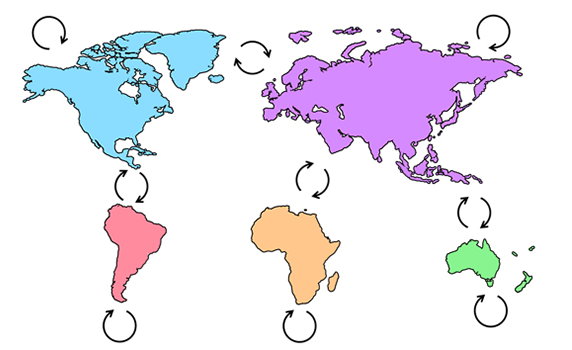
Disease can spread quickly in a globalized world where increased travel raises the opportunity for transmission. Figure 1 shows a modified map of the world divided into five areas. The arrows show the potential path for the spread of disease. For example, the Blue area can transmit infections directly to the Red and Violet areas but not to the Yellow or Green areas. Each area can also transmit disease to its own population, indicated by the arrows that circle back onto themselves.
The populations for each area are as follows: Blue has half a billion people, Red has half a billion people, Violet has 4 billion people, Yellow has 1 billion people and Green has half a billion people. Initially everyone is healthy except for 10,000 people in the Blue area who are infected with a virus.
Each month, 30 percent of the infected people transmit the virus to healthy people along each transmission route. For example, at the end of month 1, the Red and Violet areas will each have 3,000 infected people (10,000 infected people from the Blue area x 30 percent) and the Blue area will have 13,000 infected people (10,000 who were originally infected plus 10,000 x 30 percent from infecting its own population). Infected people stay infected and no deaths occur in this scenario.
Question: After how many months is half of the world’s population infected?
Send your answer to [email protected] by May 15. The winner, chosen randomly from the correct scores, will receive an “Analytics: Driving Better Business Decisions” T-shirt. y
John Toczek is the AVP Predictive Modeling at Chubb in the Decision Analytics and Predictive Modeling department. He earned his BSc. in Chemical Engineering at Drexel University (1996) and his MSc. in Operations Research from Virginia Commonwealth University (2005).