

June 6, 2011 in Profit Center
Learning by example
Three traits of successful analytics projects.
SHARE: PRINT ARTICLE: https://doi.org/10.1287/LYTX.2011.03.09
When speaking about analytics, or any other topic for that matter, it’s easy to be drawn into generalities. “Forecasts improve profits.” “Information on past purchases can be used to increase sales.” Generalities are important. They help us navigate environments crowded with details. But details provide important lessons that generalities can’t, helping us learn by example.
In this column we look at one particular screen in one particular software system. It’s not overly complicated, but it illustrates three general traits common to many successful applications of analytics.
To understand the context in which the screen is used, consider the example of a charitable organization preparing to mail requests for donations. At its disposal is a large database of past donors. The charity has a fixed budget for mailing. The question is, “Who among the many past donors should receive a mailer?”
Analytics can be used to evaluate any number of factors. Are recent contributors more likely to give again, or is it better to target individuals who haven’t contributed in a while? Are people from certain geographic regions more likely to give than others? Analytics offers a multitude of mathematical tools for answering these questions and determining which customers are most likely to send a donation.
Whatever mathematical tools are chosen, however, the results can be easily and clearly communicated. The screen capture shown in Figure 1 is taken from SAS Enterprise Miner. On the horizontal axis is the percent of the population the charity might send mailers to. For example, 20 percent on the horizontal axis corresponds to the question, “Suppose we send mailers to the 20 percent of donors most likely to respond?” The vertical axis then fills in the blank. “By choosing the 20 percent of donors most likely to respond, we can expect a response (cumulative lift) about 1.7 times greater than if we send mailers to 20 percent of the donor population at random.” (The charity’s budget corresponds to a mailing that reaches 20 percent of the donor population.) The system arrives at this number by determining which customers are most likely to respond.
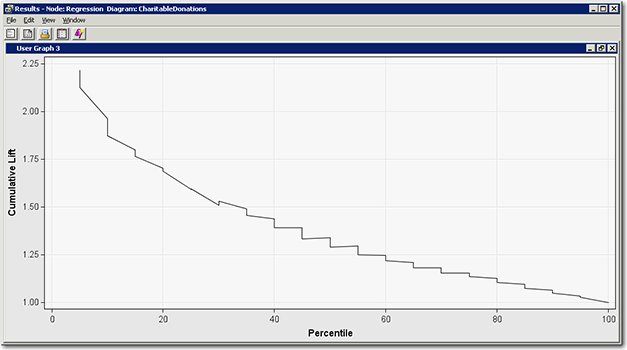
The application and the screen vividly illustrate three fundamental characteristics of a successful analytics endeavor.
1. A “must answer” question is addressed. Contributors need reminding. Donations fall if charities don’t reach out. Without an unlimited mailing budget, the charity is forced to ask, “Who should we contact?” The question must be answered one way or another. Analytics provides an answer through the logical analysis of facts.
It’s useful to contrast the question faced by the charity with a question such as, “Should I change the price of a gallon of milk?” Retailers need to set prices, but once prices are set, there’s considerable inertia for leaving them unchanged. A retailer doesn’t need to change prices tomorrow. Analytics can still bring tremendous value in this case, and pricing has received considerable attention by analytics practitioners. Nonetheless, it’s easier for analytics to be adopted in applications where there’s a question that unequivocally must be answered.
2. The solution is simple. It doesn’t take an advanced degree in mathematics to understand either the problem or, at a general level, the logic behind the solution. Some people are more likely to respond to a mailer than others, and it’s possible to take an educated guess about who those people are based on historical data. And, recognizing that the question must be answered, it’s better to take an educated guess than a shot in the dark. The SAS system, along with similar systems offered by other analytics software vendors, allows users to pick among different mathematical methods for predicting who is most likely to respond. Modelers can then choose the method they feel most comfortable with to support an educated guess.
3. A specific action is proposed. The screen shows the expected lift from mailing to the right customers, but more importantly, in the background it identifies those customers who should receive mailers. Once the analysis is run a very specific action results: mail to these customers.
Not all analytics applications provide such explicit actions. Reports provide useful information, but what to do with that information isn’t always clear. It’s of value to know that David closed $80,000 in business last month while his peers averaged $100,000, but what action should David’s manager take? When the action isn’t obvious, neither is the value. The value only becomes apparent when good business processes are put in place. In cases where the action is immediately apparent, the value is much easier to see.
It isn’t necessary for a successful application of analytics to demonstrate all three traits. Not all applications are so fortunate to have all of them. But when all three are present the case for analytics is extremely compelling, making life easier for everyone involved. We’ll return to look at other detailed examples in future columns.
Andrew Boyd, INFORMS Fellow, past INFORMS VP of Marketing, Communications and Outreach, was an executive and chief scientist at an analytics firm for many years.
([email protected])