April 2, 2012 in Viewpoint
I’m in the mood for…Doritos?
How analyzing Super Bowl ads using mood states is more revealing than sentiment alone.
SHARE: PRINT ARTICLE: https://doi.org/10.1287/LYTX.2012.02.11
This year’s Super Bowl was a terrific game, but for people like me, the ads are the real Super Bowl snacks. I spent a lot of time thinking about the best way to analyze the Super Bowl ads.
It struck me that most ads are trying to make a statement – to influence people on an emotional level, so I decided to look at what it would take to analyze the emotional impact of the Super Bowl ads.
There has been a lot of research on parsing words and phrases to understand the mood of the author. For example the ANEW (Affective Norms for English Words) word list proposes standardized emotional ratings for certain English words. It is possible to use words to not only look at the sentiment but also at the mood associated with the sentiment. For this analysis, I decided to evaluate the “passion” component, or what I will call intensity.
Intensity is different than sentiment. Not all positive words have positive intensity and not all negative words have negative intensity. For example, the statement “I hate this” has a strong emotional attachment and will have a high intensity. “That is nice,” on the other hand, has positive sentiment and low intensity.
This becomes even more nuanced when you include “dampeners” and “amplifiers” into the measurements. A dampener – e.g. “so far” – lowers the emotional intensity, but not the sentiment; an amplifier – “freakin’ ” – increases both the intensity and the sentiment score. A tweet with a listed ranking – “I rank them as follows 1. M&M, 2. Doritos Dog Assassin, 3. Bud Lite Dog” – shows sentiment but not much passion, whereas “best/worst” shows intensity as well as sentiment.
I analyzed more than 140,000 tweets using this methodology, this way:
- I categorized the tweets by the commercial they referenced.
- I scored each tweet based on a scaled intensity and sentiment weighting.
- I then applied statistical analysis to come up with an overall score for each commercial with their standard deviation, which shows how much people agreed or disagreed.
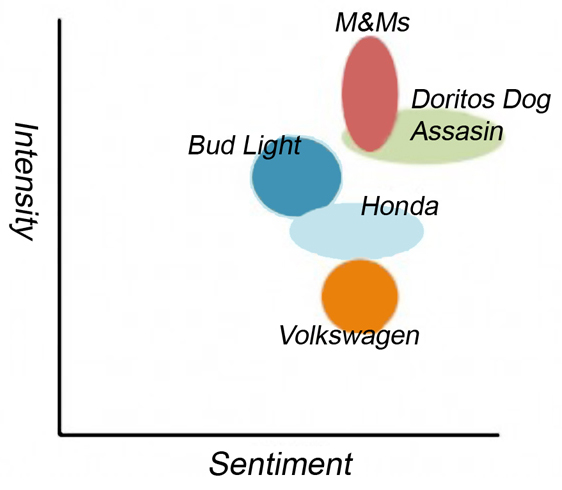
M&Ms are Intense
The higher and more to the right a commercial is on the chart, the more positive sentiment and the higher intensity associated with that ad. The width shows the sentiment deviation and the height shows the intensity deviation.
As you can see, M&M’s had the highest intensity, but the Doritos dog had the highest sentiment score.
Commercials such as the Chrysler or Ronald McDonald House spots may not have generated a lot of standard positive sentiment tweets, but the emotional attachment was high. In other words, those ads yielded a high intensity, even though few tweets were “positive,” but in this case the ads created the tone desired by the advertisers.
MetLife had had a nice winner, despite few tweets; it definitely hit the nostalgia chord.
Many more dimensions would have teased out more subtleties such as confidence levels where listed rankings would have a higher value.
And the winner is …
Sorry, the answer is “it depends.” What matters is the intent – what each commercial is trying to convey. Mood analysis can go a long way in understanding the true impact of a commercial, as well as understanding the intent of the message.
Richard Foley is a worldwide product manager and strategist for text analytics at SAS. Foley served as president of the Web Analytics Association and has been active in the web analytics community since 1996 where he worked on implementing information architecture, Web analytics standards and KPIs. This article appeared in the Text Frontiers blog.