

June 3, 2013 in Analytics
Integrating data mining and forecasting
The Dow Chemical approach to leveraging time-series data and demand sensing.
SHARE: PRINT ARTICLE: https://doi.org/10.1287/LYTX.2013.02.03
Big data means different things to different people. In the context of forecasting, the savvy decision-maker needs to find ways to derive value from big data. Data mining for forecasting offers the opportunity to leverage the numerous sources of time series data, both internal and external, now readily available to the business decision-maker, into actionable strategies that can directly impact profitability. Deciding what to make, when to make it and for whom is a complex process. Understanding what factors drive demand, and how these factors (e.g., raw materials, logistics, labor, etc.) interact with production processes or demand and change over time are keys to deriving value in this context.
The Dow Chemical Company was interested in developing an approach for demand sensing that would provide:
Cost reduction
- reduction in resource expenses for data collection and presentation
- consistent automated source of data for leading indicator trends
Agility in the Market
- shifting to external and future looks from internal history
- broader dissemination of key leading indicator data
- better timing on market trends … faster price responses, better resource planning (by reducing allocation/force major/share loss on the up side and reducing inventory carrying costs and asset costs on the down side)
Improved accuracy
- accuracy of timing and estimates for forecast models
Visualization
- understanding leading indicator relationships
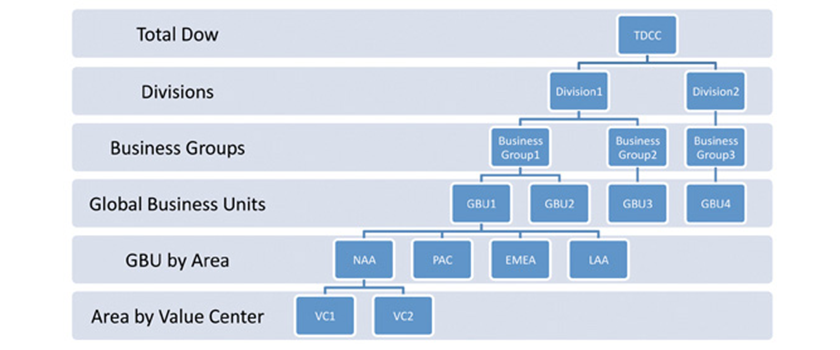
Dow (and its Advanced Analytics team) was keenly interested in better forecasting models for volume (demand), net sales, standard margin, inventory costs, asset utilization and EBIT (earnings before interest and taxes). This was to be done for all businesses and all geographies. Similar to many large corporations, Dow has a complex business/product hierarchy. This hierarchy starts at the top, total Dow, then moves down through divisions, business groups, global business units, value centers, performance centers, etc. As is the case in most large corporations, this hierarchy is always changing and is overlaid with geography. Even lower levels of the hierarchy exist when specific products are considered.
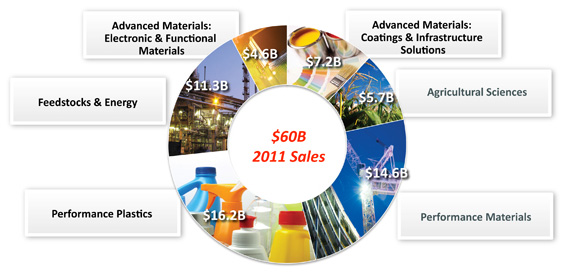
Dow operates in the vast majority of the 16 global market segments as defined in the ISIC (International Standard Industrial Classification) market segment structure, some of which are: agriculture, hunting and forestry, mining and quarrying, manufacturing, electricity, gas and water supply, construction, wholesale and retail trade, hotels and restaurants, transport, storage and communications, health and social work, etc. This includes commodities, differentiated commodities and specialty products and thus makes the mix even more complex. The value chains Dow is involved in are very deep and complex, and often connect the earliest stages of hydrocarbons extraction and production all the way to the consumer on the street.
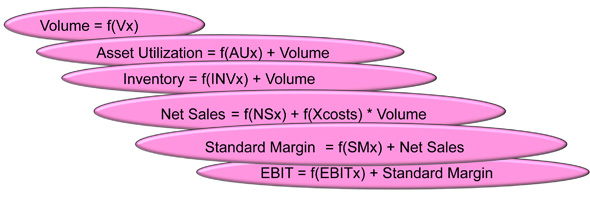
Before embarking on the project, the team contemplated a few “industrial” and economic considerations to attack. First, simply multiplying out the number of models, the team saw that they would have around 7,000 exogenous variable models to build, so we focused on the top global business units (by area combinations in each division, restricting our initial effort to covering 80 percent of net sales). Next, we realized that the target variables of interest (volume, asset utilization, net sales, standard margin, inventory costs and EBIT) are generally related to one another. Thus, volume is a function of volume “drivers” (Vx), represented by f(Vx); asset utilization (AU) is a function of volume and AU “drivers” f(AUx); inventory is a function of volume and inventory (INV) “drivers” f(INVx); net sales is driven by volume, various costs (xcosts) and net sales “drivers” f(NSx); standard margin is driven by net sales and standard margin “drivers” f(SMx); and finally EBIT is driven by standard margin and EBIT “drivers” f(EBITx).
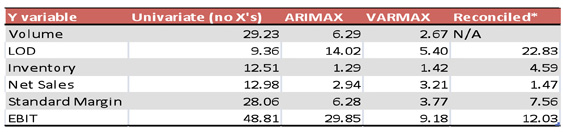
The problem, if done only at one level of the hierarchy, fits into a multivariate in Y approach that could be solved using a VARMAX (vector auto regressive moving average with exogenous variables) system. The complexity here is that we needed to solve the problem across the hierarchy shown above. We proposed that we could mimic the VARMAX structure by building the models in a “daisy chain” fashion shown in Figure 3. As a baseline, we thus compared a traditional VARMAX approach to the daisy chain approach at the total Dow level. We also did a traditional univariate model, as well as a traditional ARIMAX model for each Y. The “Reconciled” column in Table 1 was the daisy chain approach used in the hierarchy (implemented via SAS Forecast Studio) and then reconciled up. Given the results in Table 1, we were confident we could use the daisy chain approach across the hierarchy and get similar benefit to the VARMAX approach. All of the above was accomplished with various SAS forecasting platforms.
Following the data mining for forecasting process described in “Applied Data Mining For Forecasting Using SAS” (Rey, Kordon and Wells (2012)) – Chapters 2 and then 7 – which covers exogenous variable identification and then Reduction and Selection for forecasting leads to conducting dozens of mind mapping sessions to have the businesses propose various sets of “drivers” for the numerous GBU and VC by geographic area combinations. This leads to using thousands (more than 15,000 in this case!) of potential exogenous variables of interest for the 7,000 models in the hierarchy. This is truly a big data, large-scale forecasting problem. A lot of automation was necessary for first setting up initial research projects, as well as automatically building initial univariate and daisy chain models.
Lastly, concerning visualization, the business can gain access to these forecasts in a corporate-wide business intelligence delivery system where they can see the history, model, forecast, confidence limits and drivers.
Big data mandates big judgment. Big judgment has to have short “ask-to-answer” cycles. These opportunities call for the use of data mining for forecasting approaches that lead to using special techniques for variable reduction and selection on time series data.
Fenton (Chip) Wells is a statistical services specialist in SAS Education at SAS. They are co-authors of the book, “Applied Data Mining and Forecasting Using SAS.”

([email protected])