

June 3, 2013 in Five-Minute Analyst
The raffle
SHARE: PRINT ARTICLE: https://doi.org/10.1287/LYTX.2013.02.12
The following question was submitted from a friend at sea:
“We are having a raffle with numerous prizes on our ship, which has approximately 2,000 persons on board. The ship is split up into two groups, “management” (or “khaki”), which consists of about 200 persons, and “non-khaki,” which make up the remainder of the crew. So far, only three khakis have been selected as winners – is that low?”
This is a great question for the Five-Minute Analyst because, while it is in the sense of mid-term exams “poorly posed,” it is a real question, and it is formulated the way that customers (real people) ask questions.
As a preliminary step, if we define a khaki winning a prize as “success” ( X ), assuming independence and say that the probability of a khaki winning any particular drawing is p = 200/2000 = .1 and if we knew there were Ndrawings made to the current time, then we know that the distribution of successes in a fixed number of independent trials with a constant probability of success is binomial. Done, right?
The answer is OK except that it solves the problem he doesn’t have! Moreover, it falls into a category professional analysts should avoid: “true but not useful.” We could, of course, go back to our friend and ask, ‘How many drawings have there been?” but this requires him to send another e-mail and that’s difficult for him (for those with no shipboard experience, imagine solving this problem for the Curiosity Mars rover). We’d think we can give him a “turn-key” answer that tells him the information he needs and immediately solves the problem.
Our friend’s real question is: “How many drawings can we have with only three khakis being selected before we determine that the raffle is unfair?” We are interested in the number of trials resulting in a fixed number of successes; X is fixed and N – X is a random variable. This situation is described by the Negative Binomial Distribution, which counts the number of failures before a fixed number of successes. Many of us are already familiar with the Geometric Distribution, which is a special case of the binomial distribution with X = 1. If you have Excel 2010, you can use NEGBINOM.DIST(), which gives the option of computing the cumulative distribution; otherwise, you can use NEGBINOMDIST(), to get the PDF and find the CDF by keeping a running tally. So we’re half way to an answer.
The other piece is that we are unsure what our friend plans to do with the answer; implicitly we need to know something about our friend’s risk tolerance. Again, we’re imagining he’s on Mars, so we’d like to give him an answer in a form that he can use.
What we send him looks like Figure 1.
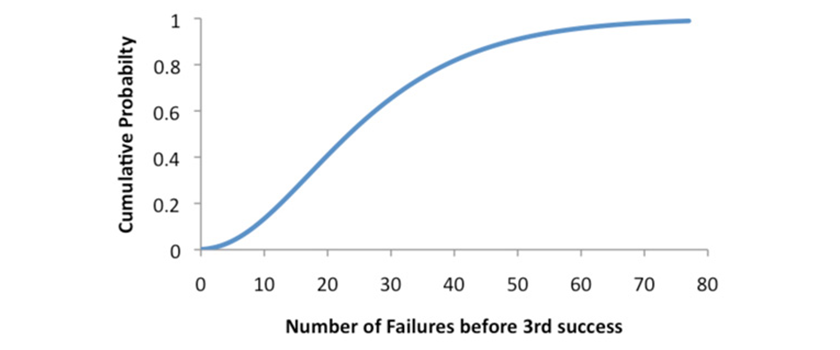
Using Figure 1, we can see that if our friend wants to be 90 percent certain that the drawing is unfairly tilted toward non-khakis, there would have needed to be more than 48 prizes awarded to non-khakis to the three awarded to khakis. If he wanted to be 95 percent certain, the number jumps to 57.
The point of this month’s column is twofold: First, to demonstrate that many situations appear to be unfair when in fact (at least in statistical terms) they are fair. Second, to remind analysts in all applications that the answer not only has to be “true” but also “useful.” If we can answer our customer’s question, OK, but if we can answer all questions that might arise from a given scenario at once (as we have done here) – even better. As a side benefit, we have reminded our readers of the power of the negative binomial distribution, the geometric distribution’s frequently neglected big brother.
Harrison Schramm, CAP, PStat, is a senior lecturer at Naval Postgraduate School, splitting his time between Defense Management and Operations Research where, in addition to teaching, he runs the Contested At-Sea Logistics Lab (CASLL). He served as the inaugural chair of the INFORMS Security Conference and is a past president of the INFORMS Analytics Society.
([email protected])