

December 1, 2014 in Five-Minute Analyst
Bicycle Counters
SHARE: PRINT ARTICLE: https://doi.org/10.1287/LYTX.2014.06.13
As longtime readers and friends know, I like bicycles almost as much as I like analysis, and I frequently think about both on a long ride. I cycle for fitness, fun and as transportation – I have been a bicycle commuter for almost 15 years now. For these reasons, I was overjoyed to discover that the city of Arlington, Va., has installed pedestrian / bicycle counters along the “Arlington Loop” [1] and, even better, the data is freely available on the Internet [2]. The good folks at Bike Arlington have already done some very nice analyses of the data on their website, and it is really cool that they are using trail usage data to determine how to invest in future trails. The Arlington data set is particularly nice because it includes daily weather information in the same portal.
As with most analytic tasks, the hard part is not the actual analysis itself per se, but rather the import and cleaning of data. I used MS Excel 2013 to pull the data from the Web via XML, and with minimal cleaning, the data was ready for analysis. The 2012 year data was “cleaner” than the 2013 data, so that is what is used here.
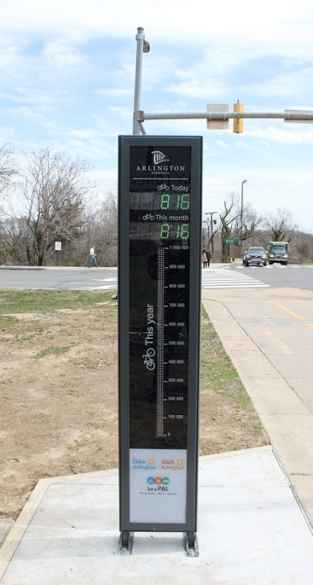
Arlington Loop. This sign is one of several
bike counters installed by Arlington to
monitor bicycle traffic.
Unlike many data sets, the historic weather information is also included. While this doesn’t sound like a big deal, it makes analysis much easier. It is natural to ask if the weather, as measured by daily average outside air temperature, has an effect on cyclists.
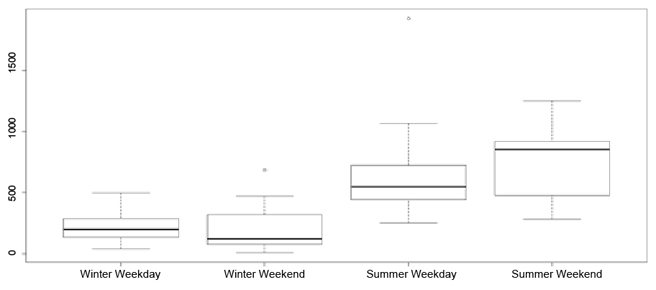
We can also use this data to think about trail utilization during the week as opposed to the weekend. This is interesting because in major cities, bicycle trails are not just for recreation but are also used by a large number of commuters for work. Here, the “WEEKDAY()” function in Excel was handy to identify the weekdays vs. weekends. We have chosen to compare the behavior of cyclists during “winter” (January/February) and “summer” (June/July).
Figure 3 may suggest that commuters are the major contributors to trail usage in the winter, and “sport” riders are the contributors in the summer months. Conversely, it may be that the winter riders have made the investment in proper winter “kit” because they have to, and use the same kit on the weekends to ride.
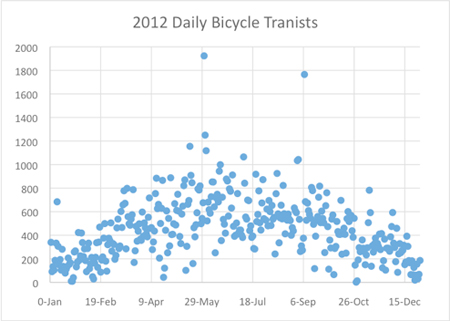
cycling in the summer months and less cycling in the winter. There are two outliers: June 1 and Sept. 8.
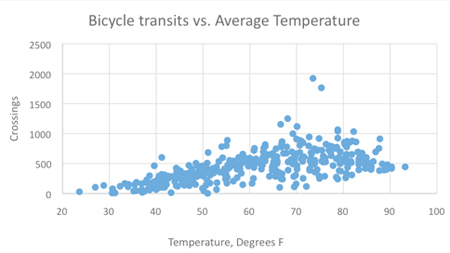
average temperature of 1 degree Fahrenheit translates to approximately 10 additional riders (Regression p-value = 0).
In conclusion, this is a rich data set, and our analysis here has just scraped the surface, and we hope that some of you will take an interest in it as well.
A note on software: Longtime readers will note that I sometimes use Excel, sometimes use R and sometimes use both in the same article. While both have their strengths, I found parsing XML data to be easier in Excel, and Boxplots to be easier to build in R.
REFERENCES
- For a map see: http://www.bikearlington.com/tasks/sites/bike/assets/File/Arlington-Loop.jpg.
- See http://www.bikearlington.com/pages/biking-in-arlington/counting-bikes-to-plan-for-bikes/data-for-developers/. From here, you can create an XML query and pull the data into your favorite analysis package.
Harrison Schramm, CAP, PStat, is a senior lecturer at Naval Postgraduate School, splitting his time between Defense Management and Operations Research where, in addition to teaching, he runs the Contested At-Sea Logistics Lab (CASLL). He served as the inaugural chair of the INFORMS Security Conference and is a past president of the INFORMS Analytics Society.
([email protected])