

July 6, 2015 in Future Trends
Network Science: Network analytics for everyone
SHARE: PRINT ARTICLE: https://doi.org/10.1287/LYTX.2015.04.04
Fields ranging from social media and finance to healthcare and government are turning to network science for greater insight. Still in its early stages of development, the discipline will continue to gain influence as the world becomes increasingly interconnected. Analytical platforms currently available help us to better understand the structure of networks. However, many questions about how complex systems operate remain unanswered, calling for openness to unexpected possibilities when making predictions about networks.
There are a number of publicly available tools for exploring complex networks. Gephi, for example, is a flexible open source platform with robust analytical and data visualization capabilities. This article presents analysis of OECD trade data using Gephi and provides a few tips to help those new to network analytics to get up and running. More broadly, the exercise sheds light on the value of network analysis as a complement to more traditional statistics. The exercise also underscores the importance of circumspect when using popular theories to predict how networks might evolve.
Visualizing World Trade
The world trade network has undergone massive transformation over the past two decades. One of the most notable changes is the momentous rise of China as a central trading member and its creation of a new economic community. In the process, China overtook Japan as the largest non-Western power and now balances the United States and Germany economically.
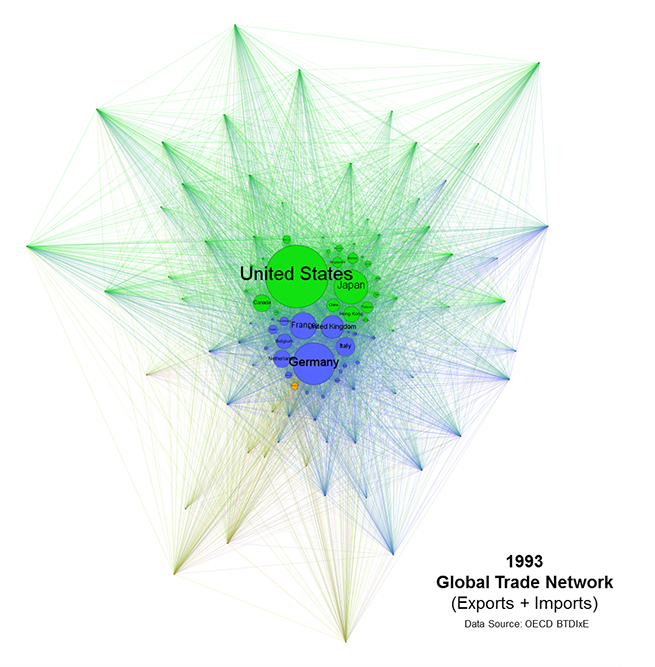
In 1993, the United States, Germany and Japan were the three largest trading nations, accounting for roughly one-third of world exports. While Japan was the third largest exporting country, it was heavily dependent on the United States, which represented 29 percent of its outbound goods. As a result, the world trade network was characterized by two major communities. The United States was at the center of one (Americas and Asia), and Germany was at the center of another (Europe). Russia led a third much smaller community of previous Soviet bloc countries (see Figure 1).
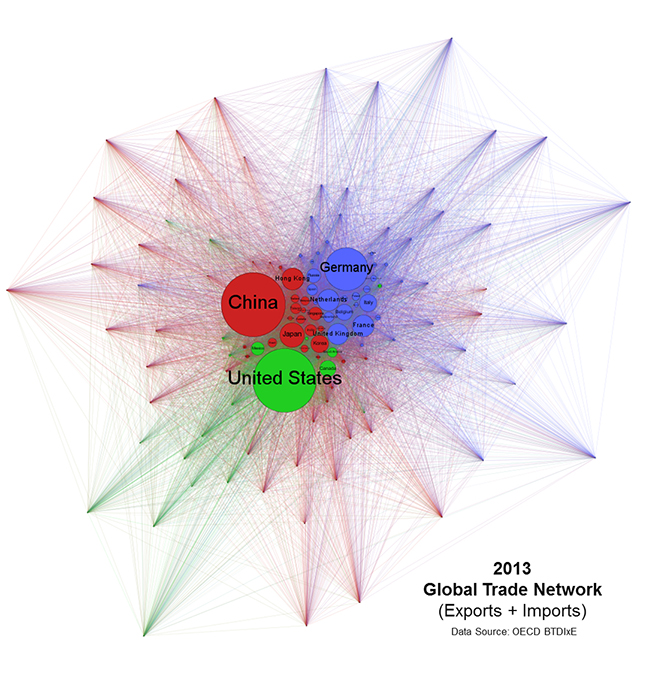
China only accounted for 2 percent of world exports in 1993, but by 2013 it represented 12 percent, making it the largest exporter of goods. Meanwhile, the combined share of U.S., German and Japanese exports dropped to 20 percent in 2013. China had also created a third trading community, comprised of other Asian markets including Japan (see Figure 2).
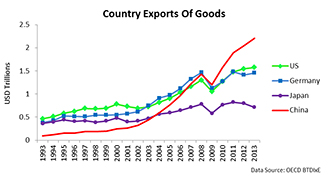
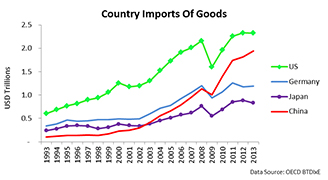
Basic trade statistics and charts reflect many of these dynamics (see Figure 3a and Figure 3b). Where network analysis adds value is illustrating the degree of network member interconnectedness and centrality. There’s also the argument that the interactivity and visualization possible through platforms such as Gephi facilitate greater exploration and reasoning.
Predicting Future Trends
Two constructs that, when applied together, potentially lend themselves to predicting how networks might evolve are the “power law” [1] and “preferential attachment” [2]. Under the power law, a small number of network members are significantly above average in their number of connections or power while most members are significantly below average (“the long tail”). Under preferential attachment, network members attract new relationships or power in proportion to existing allocations, thereby reinforcing imbalances (“the rich get richer”). If both the power law and preferential attachment hold, future conditions of a network should be predictable taking into consideration current structural characteristics and assumed rates of change.
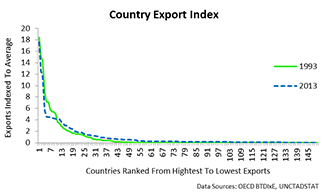
Analysis of world trade gives credence to the power law. Whether 1993 or 2013, there were large disparities between countries based on their level of exports. Long tails existed both years (see Figure 4). However, analysis doesn’t quite support preferential attachment, under which China would have had little chance of becoming the world’s largest exporter so rapidly. One possible explanation is that by competing on a new dimension – low-cost manufacturing – China skirted preferential attachment altogether. This hypothesis isn’t anything new, though it does highlight the need for caution when making predictions about networks.
Theoretical constructs such as the power law and preferential attachment can help us depict possible scenarios that might exist in the future. But the more complex the system, the more difficult it becomes to make accurate predictions. And as the case of China shows, seismic change can happen unexpectedly in a short time.
REFERENCES
Getting started with Gephi
Software: Download Gephi here.
Tutorials: Learn how to use Gephi here.
Data import: Gephi supports multiple file formats. You can import spreadsheets (CSV) easily with the Data Laboratory’s Import Spreadsheet
function. Columns reflecting edges need to be labeled “source” and
“target” in original spreadsheet. Accurately define data types when importing (e.g., string for text and float for numbers).
Graph layout: Gephi includes layout options to manage repulsion and attraction. However, it’s sensitive to large numbers so adjusting scale in original data sets may be needed before importing (e.g., if weights are included).
Data analysis: Statistical functions enhance the ability to visualize relationships and need to be run before related capabilities are available as display features. Filters are useful with long-tailed data.
Will Towler is an analytics and insights specialist. The views expressed in this article are those of the author and do not necessarily represent the views of an employer or business partners. He is a member of INFORMS.
([email protected])