

July 6, 2015 in Five-Minute Analyst
Markov’s Abbey
SHARE: PRINT ARTICLE: https://doi.org/10.1287/LYTX.2015.04.15
Like many people in the English-speaking world, I have spent some hours over the past five years watching a drama called “Downton Abbey.” This period show centers around an aristocratic family – the Crawleys – and their trials and tribulations. Those who watch it with an analytic eye (perhaps under duress) are quick to see that the show seems to have recurring plot elements to wit: the estate seems to run short of money occasionally, Mr. Molesley has a hard time keeping up with his duties, and Lord Grantham’s favored valet, Mr. Bates, seems to be eternally afoul of the law, although he has done nothing wrong, and so on. While there are no shortage of disasters to befall Downton and its occupants, I started to wonder if there were some sorts of patterns or analysis that could be performed.
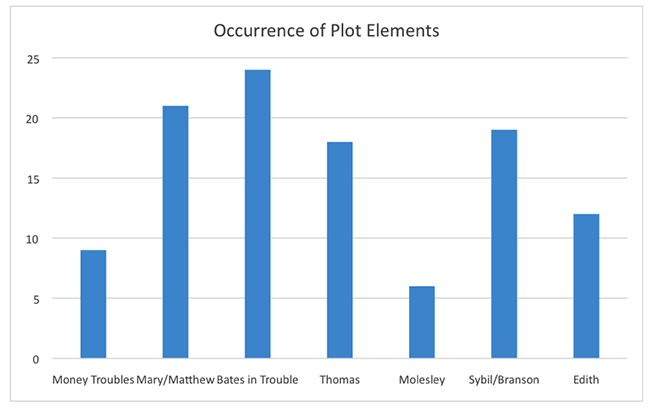
I have arbitrarily selected several plotlines I found interesting, and have extracted data from the Wikipedia page [1] on “Downton Abbey” episodes to create the graph shown in Figure 1.
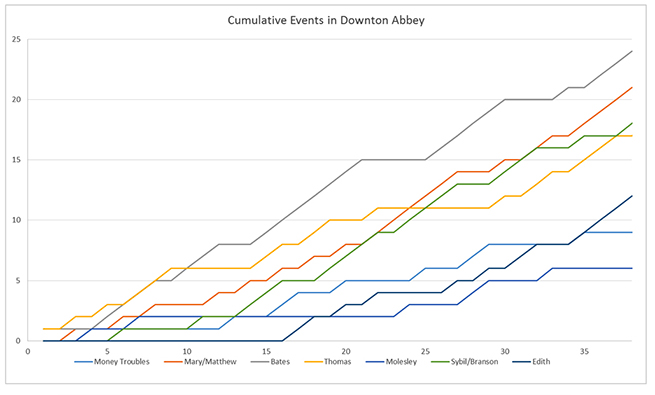
Before we go too much further, please note that the choice of plot elements and scoring is mostly subjective. They were chosen partly because they are themes that follow the entire series (for example, Lady Rose is absent because she was mostly in Seasons 4 and 5). If someone were to choose different plot elements to follow, they would get different answers! It’s important in our business to recognize when we are “performing” objective analysis on subjective data. My practice is to acknowledge the subjective nature of the data, but to go forward with the full-power objective methods. Specifically, if I were to count Mary and Matthew as separate plots, then they would be strongly correlated!
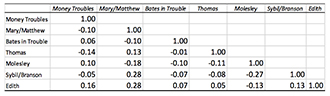
Before thinking about transition matrices, it’s useful to compute the correlation coefficient between the different plot elements (Figure 3).
The correlation matrix dissuaded me from trying to calculate the joint probabilities between any of the plotlines. As there are seven total plotlines tracked in this analysis, there are a total of 27 = 128 possible states. There may be more nuanced relationships in the data; these are beyond the scope of the current effort.
Note that the single most common plot element in “Downton Abbey” is “Mr. Bates in trouble.” There’s a very clever package in R called “markovchain” [2] that will allow you to compute the transition matrix from state data. This can also be done by hand, but can be cumbersome. For our data, Mr. Bates transition matrix is:
We may compare Mr. Bates transition matrix with Thomas’.
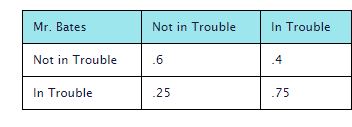
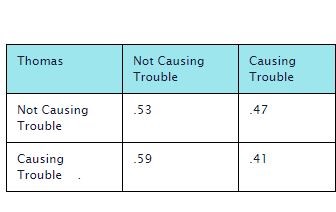
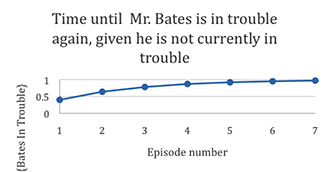
Analyzing the matrix, we can see that at “steady state” Mr. Bates is in trouble 61 percent of the time. There are two ways to do this; the elegant method is to solve two equations in two unknowns. The inelegant method (which truth be told I prefer) is to simply use MMULT() repeatedly. Similarly, Thomas is causing trouble 44 percent of the time. We can also use matrix multiplication to compute the “first passage time” until Mr. Bates is again in trouble. We do this by replacing the bottom row with the vector {0,1}, and get the result shown in Figure 4.
Finally, according to our analysis, there is a three-way tie for “most interesting episode of ‘Downton’”: Season 3, #1, Season 3, #5 and Season 5, #4. Each of these had five out of seven plot elements. The least interesting episode of “Downton” was Season 1, #2, which had none of the tracked plot elements.
There is an interesting historical connection [3]; Markov originally applied his methods to study the Pushkin’s novel Eugene Onegin [4] – a work of fiction. It seems that more than 100 years later, we are using the same method to tackle a new problem.
End notes
- On the use of Wikipedia: I typically do not like to use it for “serious” work, where there are better references. However, when the research question is on the plot of television shows, it is appropriate.
- I had as much fun coming up with my “title and style” as writing the rest of this column. What would your “math style” be? I’ll give 100 points for the best one (via email).
References
- http://en.wikipedia.org/wiki/List_of_Downton_Abbey_episodes, accessed May 25.
- http://cran.r-project.org/web/packages/markovchain/vignettes/an_introduction_to_markovchain_package.pdf
- Thank you to Jim Mosora for pointing this out!
- http://www.americanscientist.org/issues/pub/first-links-in-the-markov-chain
Harrison Schramm, CAP, PStat, is a senior lecturer at Naval Postgraduate School, splitting his time between Defense Management and Operations Research where, in addition to teaching, he runs the Contested At-Sea Logistics Lab (CASLL). He served as the inaugural chair of the INFORMS Security Conference and is a past president of the INFORMS Analytics Society.
([email protected])