

January 4, 2016 in Five-Minute Analyst
Predicting Navy football games
SHARE: PRINT ARTICLE: https://doi.org/10.1287/LYTX.2016.01.12

My longtime followers will know that as a graduate of the U.S. Naval Academy, I have a soft spot for Navy football. I’ve written about it before (Analytics magazine, November/December 2013 issue). I also have been very excited about the re-launch of the INFORMS Section on O.R. in Sports (SpORts) led by Walt DeGrange and Scott Nestler. With the epic season that Navy just had combined with new directions in INFORMS, I decided to write about predicting football games.
Now, there are people who make a living at this, and what I propose here is just to spark discussion and pique interest. Taking the game history to date, we can use the (observed) expected points scored and variance to compute a probability of win by imposing normality. (I say “impose” normality because I have no basis on which to assume it.) Letting X denote the differential score (to date), N denote Navy and O denote opponent, we have:
Assessing the Prediction
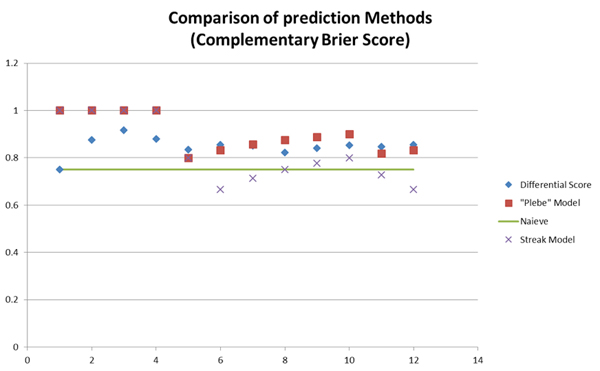
This turned out to be more difficult than expected. Instead of constructing a rigorous hypothesis test, we instead will compare our differential methods with some other candidate metrics:
- The “Null” method, which assumes a probability of .5 for each game
- The “Plebe” method, which chooses Navy as winner every game
- The “Streak” method, which takes the previous game as a predictor for success in the next game
We use a “Complementary Brier Score.” We chose this somewhat arbitrarily; making arbitrary choices is a benefit of authorship. The Brier Score is defined as:
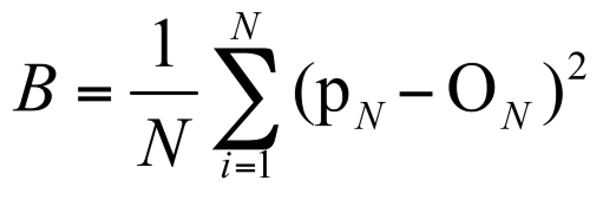
Where p is the predicted probability and O is the outcome (1 = win, 0 = loss). In this application, the Brier Score is the same as Mean Square Error. We use the complementary score, i.e., 1-B, to rescale and let better scores correlate with better outcomes. While this is trivial mathematically, it has the desirable property of giving better predictions a higher score (see Figure 1).
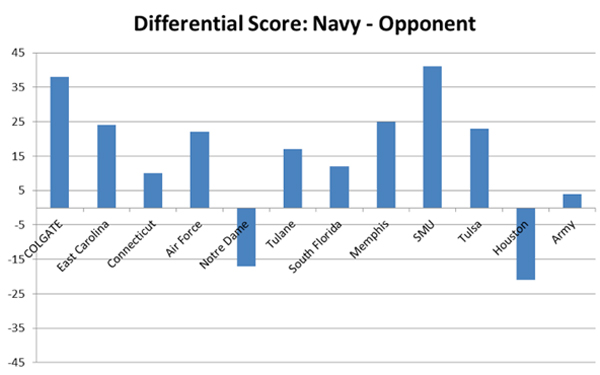
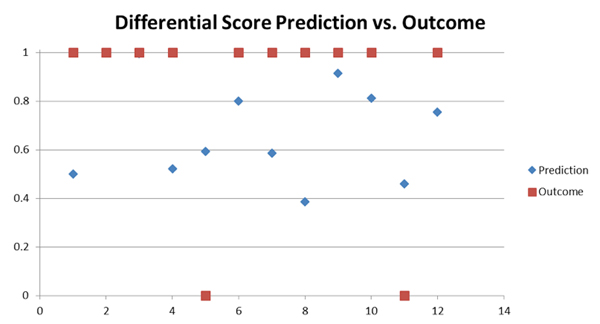
Now, we show in Figure 2 our predicted game outcomes (in terms of probability of Navy win) vs. the actual data. Note that care was taken to ensure that only the game history to date was used in the prediction.
If we are going to predict the outcome of a sporting event, we should see how well our predictions performed. To this end, we compare it with three other potential scoring methods: the “plebe” method which always picks a Navy win; the “Streak” method, which uses that previous games’ outcome as the next game’s prediction; and the “naïve” method, which simply gives Navy a 50 percent chance of winning each game. The results of these predictions are presented in Figure 3.
Conclusion: While I don’t plan to give up my daytime operations research job and go into sports analysis, this was a fun and interesting case study. I’d be curious to think about what other methods could be applied with a minimum of data and computing power.
Harrison Schramm, CAP, PStat, is a senior lecturer at Naval Postgraduate School, splitting his time between Defense Management and Operations Research where, in addition to teaching, he runs the Contested At-Sea Logistics Lab (CASLL). He served as the inaugural chair of the INFORMS Security Conference and is a past president of the INFORMS Analytics Society.
([email protected])