
September 5, 2016 in visualization
Making effective decisions in real time
Situational intelligence brings together advanced analytics, data visualization and IoT for a 360-degree operational view.
SHARE: PRINT ARTICLE: https://doi.org/10.1287/LYTX.2016.05.02
Decision-making based on data has historically been slow and cumbersome due to the time and effort required to store and prepare it prior to personnel analyzing it. It is no longer viable for people to analyze data themselves due to the volume, velocity and variety of data from business systems and from operational systems and the Internet of Things (IoT) that stream data in real time. In addition, to fully leverage the value in data, organizations can no longer afford to wait hours, let alone days or weeks, for details and/or requisite information that supports decisions.
New technologies are becoming available to replace manual processes and their shortcomings, and to leverage data to provide actionable insights that drive decisions and optimize outcomes, including in real time. This is great news for organizations eager to understand and respond to what is happening in real time so they can achieve benefits such as: making timely decisions that ensure committed service level agreements are met; keeping operations running at optimal levels; and averting or minimizing the consequences of service disruptions and catastrophic events.
Analytics Needed to do What Humans Cannot
Organizations are already accumulating data that contains a wealth of information. The quantity and nature of this data is likely to increase significantly as more IoT and mobile devices are connected, and weather, fire, market and other external data are considered, adding more time-series, spatial and unstructured data to the mix. Real-time device data is also subject to variances in quality and sequencing that must be rectified before it is used.
To gain actionable insights from this data, it must be analyzed and presented to users in a way that improves understanding and the quality of decision-making.
Three categories of analytics play a role in deriving an understanding of real-time data:
Diagnostic [or descriptive] analytics identifies details about an asset, event or situation including where, when and why something occurred. Diagnostic analytics is useful for trouble-shooting and determining root causes.
Predictive analytics identifies a probable outcome, enabling organizations to take proactive measures to avert a situation or take advantage of an opportunity. Predictive analytics forecasts what is likely to happen so users can take appropriate actions such as proactively replacing an asset at risk of failing, averting a service disruption.
Prescriptive analytics identifies the optimal actions to take from among a set of possible outcomes. It works well when conditions are uncertain or constantly changing, because the models can adjust to variable inputs. Prescriptive analytics makes decisions and automates or recommends specific actions, a powerful capability for time-critical decisions.
Data Visualization is as Important as Analytics
Data visualization enables decision-makers to readily understand what is important at any moment so they can focus on, fully understand and explore details to consistently make timely decisions. It is important for data of all types and from all relevant sources plus analysis results to be displayed with contextual relevance. “Contextual relevance” means, for example, understanding the location and time of an unplanned event, the assets, resources and environmental factors involved, and the outcome and its significance. In short, data visualization is a friction-free way to broadly operationalize analytics for non-technical personnel.
Considerations for data visualization in real-time environments include the following:
• The analysis of real-time data is generally pushed to user screens as opposed to users clicking a button to retrieve it. The goal is to highlight areas that need attention as soon as possible. This can be done by changing the color of data points, or by generating an alert that flashes on the screen, complemented by sending an email or text message to appropriate recipients.
• With a lot of data being generated in a short amount of time, it is easy for users to be overwhelmed, especially since the real-time data by itself is not actionable. Analysis of real-time data used in conjunction with visualization addresses this. As an example – instead of presenting raw streamed data to users of, for example, which trucks are in motion, an analysis of the data might result in issues highlighted using icons on a map that change color based on, for example, how far deliveries are behind schedule.
• Data tables and charts are useful but insufficient for understanding issues in real-time environments. Showing activity at one or more locations and other geographic data requires geospatial displays and animation of time-series data is useful to show activity over time.
Bring it All Together with Situational Intelligence

The application of a situational intelligence approach improves the quality of analytics results in real-time environments, since real-time data is much more valuable when applied in the context of other operational data. For example, data from a sensor on an asset may show stress conditions, but to fully understand the situation, the location of the asset (from a geospatial information system), details about that asset and its maintenance record (from an asset management system), the nearest crew available to work on repairs (from a field service system), and perhaps temperature data, are needed. No single analytic does it all, so it is essential that any solution providing situational intelligence is able to bring together the results from multiple analytics in complementary ways. For example, consider the need for field service dispatch planners to create a schedule that optimizes human and capital resources. This task requires two types of analytics: predictive analytics to identify machinery mostly likely to fail and when, and prescriptive analytics that prioritizes the service or replacement of those machines based on importance, cost and any number of other factors.
Situational Intelligence in Action
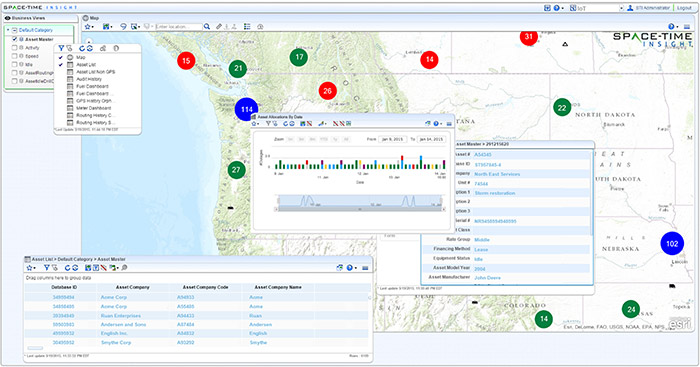
An example from an actual implementation is the best way to highlight the topics discussed so far and demonstrate the many areas of business value made possible by situational intelligence. The organization in this example is a provider of engineering and construction services. Telemetry data from thousands of vehicles and anti-theft devices attached to equipment is captured in real time, combined with spatial data, correlated with data in asset management and enterprise resource planning systems and visualized (see Figure 2).
Utilize their assets more efficiently. Predictive analytics identifies assets at risk of failing, reducing work stoppages and accidents. Visualization of assets on a map help users identify idle equipment that might be utilized at other locations.
Identify unauthorized equipment usage. Analysis of equipment usage and location is used to pinpoint these occurrences, facilitating appropriate action by managers.
Reduce accidental and intentional equipment losses. Alerts triggered by real-time analytics are delivered to personnel separated from assets or equipment designated as being under their control, reducing equipment being inadvertently left behind or misappropriated.
Obtain gas tax rebates when vehicles were driven off-road. Spatial analytics is used to identify these instances and justify tens of millions of dollars in annual rebates.
Reduce accidents and identify high-risk drivers. Real-time analytics is used to identify drivers exceeding the speed limit or speed appropriate to the vehicle being driven, and to provide them with information about more expedient and safer routes to take.
Summary
Understanding problems and situations in real time typically begins with knowing what happened and using that understanding to respond quickly and prevent reoccurrence. Solving problems and addressing the entire situation demands a greater understanding of the root causes, which means that the full context of what happened is required – knowing as much about where, when, why, how and who to paint a complete picture of current and potential future situations. Such information is rarely available in a single product that’s cogently presented with the clarity to drive timely decisions. That’s what is possible with situational intelligence – an approach that flexibly integrates data at rest and in motion, results from multiple analytics, and data visualization to support quick, confident decision-making.
Ron Stein, director of product marketing for Space-Time Insight, is a Silicon Valley marketing and product management veteran possessing experience that spans semiconductors, embedded systems (now referred to as IoT and IoE) and large-scale enterprise systems. His experience with advanced analytics, data visualization and IoT includes dedicated IoT and analytics solutions that help law enforcement and physical security agencies ameliorate violent crime, and extensive analytical models that help property and casualty insurers effectively manage exposure and risk.