January 2, 2017 in Five-Minute Analyst
The force is strong with correspondence analysis
SHARE: PRINT ARTICLE: https://doi.org/10.1287/LYTX.2017.01.13
“I am one with the data and the data is with me”
– Chirrut Imwe
This article is going to do two things I’ve never done before: first is to include a co-author, and second is to write about the same topic using (almost) the same data. To recap, in “The Force Awakens,” Kylo Ren fears that he will succumb to the light because he is not as dark as his hero, Darth Vader. We considered this problem in July 2016 using “Darkside Envelopment Analysis.” We repeat the data used as Table 1 (spoiler alert) slightly updated to reflect events of “Rogue One.”
Our previous work “shot first” by using data envelopment analysis implemented in MS Excel’s standard Simplex LP solver to maximize the ratio of “goods” to “bads” for each force practitioner’s achievements. To complete our training, we must unlearn, and move from mathematical optimization to correspondence analysis (CA), in this case wielding R package “ca,” an elegant weapon for a more civilized age. In this, we will create a biplot of achievements and failures, with Vader as the reference (Figure 1).
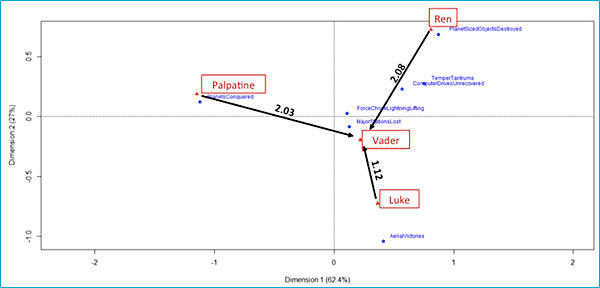
By this metric, Luke is the most Vader-like. It also suggests that Ren’s journey to the dark side is not yet complete. CA indicator score analysis of data separated into achievements and failures suggests that Vader is not necessarily the dark standard to which Ren should strive to achieve. There is another.
“Make ten lines of code feel like a hundred!”
– Cassian Andor
| Achievements | Vader | Ren | Luke | Palpatine |
| Planet-sized objects destroyed | 1 | 4 | 1 | 0 |
| Force Choking Lightening Lifting |
5 | 2 | 1 | 2 |
| Aerial Victories | 3 | 0 | 4 | 0 |
| Planets Conquered | 2 Hoth, Cloud City |
0 | 1 | 10 (Chancellor) |
| Failures | Vader | Ren | Luke | Palpatine |
| Major Stations Lost | 2 | 1 | 1 | 1 |
| Temper-tantrums | 1 | 2 | 1 | 0 |
| Computer Drives Unrecovered | 2 | 1 | 0 | 0 |
Table 1: Achievements and failures contingency table of Vader, Ren, Luke and Palpatine.
These indicator scores are calculated in three steps:
- Transform data into a contingency table.
- Use R’s ca package to create biplot row/column coordinates.
- Perpendicularly project column points onto row point lines and measure point-intercept distances to/from segment endpoints using a custom Rscript that performs the calculations onto the coordinates made available from the ca package.
This problem has the interesting – and surprisingly common characteristic – that the data fields are not inherently ordinal. While we might all agree that “destroying a planet (if you’re a Sith) or Death Star (for Jedi) is really good and that losing a Death Star is really bad,” but how do aerial victories compare to force choking and/or lightning lifting? Aerial victories are achievable by half-witted, scruffy-looking nerf herders, while force choking can punish a disturbing lack of faith.
We can create a more nuanced analysis by considering the CA indicator score analysis of achievements with multiple perpendicular projections. We will start by calculating Vader’s achievement CA indicator score set (see Figure 2).
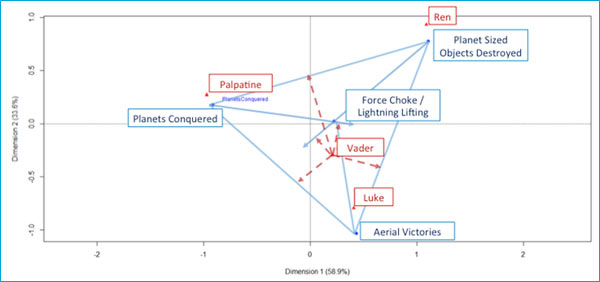
The general formula for calculating a single score S via projection onto line (i,j) is: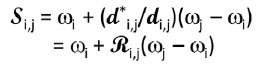
- where R is the intercept distance d* over projection space while weights wi and wj are the assigned achievement weights. Applying this to our previous data, we get Table 2. Table 3 compares three final indicator score calculation methods.
| Achievement Score | Failure Score | |
| Vader | 12.44 | 5.61 |
| Luke | 9.82 | 2.38 |
| Ren | 6.70 | 5.87 |
| Palpatine | 5.60 | 1.57 |
Table 2: Force practitioner CA achievement and failure scores, sorted by achievement scores.
| Achievement/Failure Ratio | Normalized Difference | CA Score Difference | |
| Luke | 4.13 | 0.84 | 7.44 |
| Palpatine | 3.57 | 0.41 | 4.03 |
| Vader | 2.22 | 0.20 | 6.83 |
| Ren | 1.14 | -0.84 | 0.83 |
Table 3: Force practitioner indicator score comparisons, sorted by achievement/failure ratios.
A technical note: Exploratory factor analysis of failure loads the same latent variable onto unrecovered computer drives and major stations lost, thereby confirming the relationship between increased station vulnerability and computer drive security while adding quantitative context as to why many Bothans died (and others) to retrieve the information on those drives.
A personal note: In the coming year, I don’t plan to have any regular co-authors, but would like to start bringing in some of the many padwans I’ve met along the way. It is my sincerest hope that eventually the students will become the masters.
Harrison Schramm, CAP, PStat, is a senior lecturer at Naval Postgraduate School, splitting his time between Defense Management and Operations Research where, in addition to teaching, he runs the Contested At-Sea Logistics Lab (CASLL). He served as the inaugural chair of the INFORMS Security Conference and is a past president of the INFORMS Analytics Society.
([email protected])