

January 1, 2018 in Five-Minute Analyst
Song of survival: the rock band Yes
SHARE: PRINT ARTICLE: https://doi.org/10.1287/LYTX.2018.01.12

It seems that rock stars are getting older. The Rolling Stones. Ozzy. Nikki Sixx of Motley Crue received a hip replacement this year. Rock and roll is, it seems, no longer a young man’s game.
The band that seems to be best suited for study is the iconic Yes. Yes, an English rock band that formed in 1968, is attractive because it has a large lineup (17 members of tenure of at least one year over their career). The band also seems to be hearty; the first death of any member – founding guitarist Peter Banks – happened in 2013, and the first death of a “classic lineup” member – bassist Chris Squire – was in 2015. (The “classic” period produced the albums “Fragile,” “Close to the Edge,” “Tales from Topographic Oceans” and “Relayer.”) For analysis purposes, most of the members of Yes were born around 1950, and the U.K. Office of National Statistics keeps charts of survival by cohort.
We can find data about the current and past members of Yes from Wikipedia. A summary appears in Table 1.
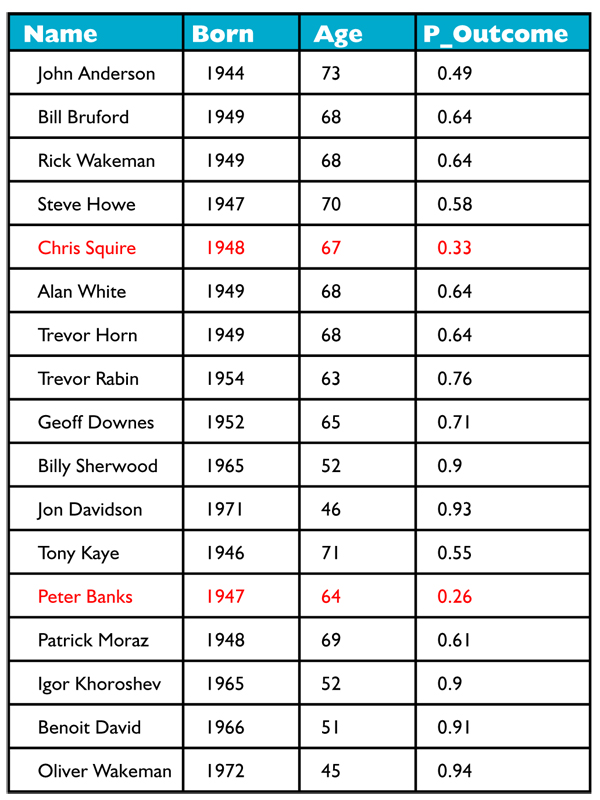
Table 1: Birth years and ages of current and past members of the progressive rock band Yes. Red font indicates those who have died. The probability of outcome is the probability that this member survived to their current age or passed at the age of their death.
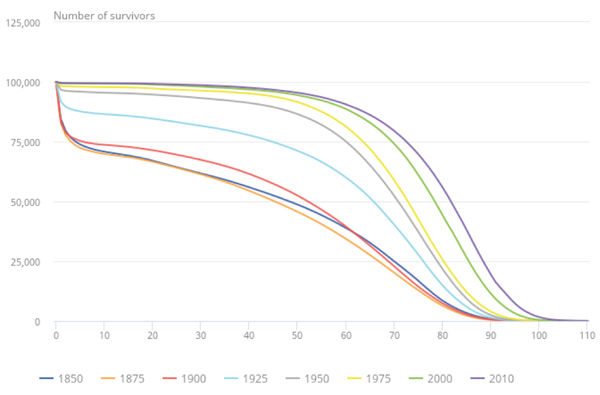
Figure 1: Survival by age and birth cohort, United Kingdom.
Constructing a Statistical Test
We want to know if the observed data matches our hypothetical model, in which we assume the members of Yes to have been drawn at random from the male population of the United Kingdom. So, we’ll see “how strange” it is for two or fewer (out of 17) members to have died to date, compute a p-value and make some inference.
Determining the probability of survival of the band is like the binomial distribution, but the probabilities of survival are not identical. The fact that there is no pre-made function in R or Excel called dYES() should not trouble us; we can simply use the same ideas from the binomial and apply to this case.
The binomial distribution is given by the formula:

We replace  with
with  and construct a statistic in the usual way.
Impatient to get on with the test? We’ll get there soon.
Result and a Comment on p-values
The result of this statistical test was surprising. I expected it to be unusual for 15 of 17 individuals born (approximately) in the 1950s to still be alive in 2017. When computed, the probability for this exact outcome was .06, and the p-value associated with two or fewer musicians dead was .08.
We’ve been thinking a lot about p-values over the past few years – both as individuals and as a community. It used to be that under the “bright-line” construct, we would choose a p-value – in this case, probably .05 but maybe .10, execute the test, and then compare the test result with the pre-chosen threshold value.
In a world after the ASA Statement on p-values, we are allowed to say, “I don’t know” or ‘it depends.” In this case, the data implies that being in Yes led to greater longevity than being a member of the population at large. Of course, we have no idea why members of Yes might be healthier than the average population.
Harrison Schramm, CAP, PStat, is a senior lecturer at Naval Postgraduate School, splitting his time between Defense Management and Operations Research where, in addition to teaching, he runs the Contested At-Sea Logistics Lab (CASLL). He served as the inaugural chair of the INFORMS Security Conference and is a past president of the INFORMS Analytics Society.
([email protected])