
January 7, 2019 in Data Science
Mining unstructured data using machine learning
Six practices to connect unstructured data to better business insights.
SHARE: PRINT ARTICLE: https://doi.org/10.1287/LYTX.2019.01.05

Historically, big data analytics relied on structured data where data was neatly organized in rows and columns of databases. However, with the advancements in machine learning as well as the availability of cheaper computing resources, big data analytics has pivoted to using unstructured data to extract meaningful business value. In my previous article, I took a stab at explaining unstructured data, its importance and different techniques to visualize unstructured data. In this article, I am going to outline the high-level processes that have helped me analyze unstructured data. Before we get into the weeds of how to analyze unstructured data, let’s do a quick recap on unstructured data and why it is so important.
What and Why of Unstructured Data
Structured data only accounts for about 20 percent of stored information. The rest is unstructured data – texts, blogs, documents, photos, videos, etc. Unstructured data, also known as dark data, includes information assets that organizations collect, process and store during regular business activities but generally fail to use for other purposes (for example, analytics, business relationships and direct monetizing). Unstructured data is the hidden part of the massive iceberg that has yet to be analyzed for useful decision-making (see Figure 1). In many circles, unstructured data is considered a burden that should be sorted and stored away. In reality, it contains valuable business insights that can significantly augment the business understanding that we have today from structured data.

Figure 1: The iceberg analogy for unstructured data.
In most cases, unstructured data is analyzed by extraction. For example, consider fingerprint matching (or even finger vein matching) where the actual fingerprint image is totally unstructured. To analyze a fingerprint, key points are identified and then mapped (for example, using Delaunay Triangulation Net to map/match fingerprints). In the end, the map, which is structured data, creates an integrated view of the data, enabling data scientists to extract meaningful business insights.
Traditional analytical processes are not adequate to fully understand unstructured data. Instead, newer methods such as natural language processing, semantic analysis, etc., are used to analyze unstructured data. Recent advancements in recurrent neural networks, convolutional neural networks and other methods are also helping to identify patterns in unstructured data.
Analyzing Unstructured Data
Data science is more than just building predictive models; it is also about explaining the models and using them to help people understand data and make decisions. Following are six practices that have helped me over the years as I sought to connect unstructured data to business insights.
- Set clear goals: Dealing with unstructured data can often feel like staring down an abyss. To avoiding getting lost, set clear goals for the analysis you’re going to do. For example, do you need a simple number, a time series or seasonal trend or something else? Knowing the end goal is essential to structuring the analysis of unstructured data.
Given the sheer volume of data that may be available for analysis, keep in mind that not all unstructured data will provide insight. At one point in my career, I was tasked to determine the market reaction to a new product launch. Instead of trying to analyze every piece of information from social media to email surveys across time ranges, I focused on analyzing relevant words/hashtags related to the launch. In the world of eCommerce for example, the data that we analyze and the methods we choose will be very different depending on what question we have set out to answer: How many orders should we expect this holiday season versus when will the holiday season sales start to pick up this year? Whether we end up working on classification and classification algorithms or seasonal trend analysis is very much dependent on the type of question being asked. Setting clear goals definitely helps in preventing scope creep.
- Identify data sources: Identifying clear data sources early in the analysis process saves a lot of time downstream when we get into the weeds of the data. As a rule, I make sure to use only those data sets that are entirely relevant to the problem I am working on. In the age of big data, it’s easy to get overwhelmed and inundated with data if you start including data sources that don’t directly relate to the problem at hand. For example, if you are looking at campaign data on channel 1, don’t go about looking for secondary effects on channels 2 and 3.
Limiting the data sets also keeps the data modeling process moving along by limiting the number of features that are being considered for the algorithm (rule-based or machine learning). This way, whenever the analyst figures they need more signals (features) for their models, they can go back and add new signals to the algorithms in future rounds of model development.
Another trick that I love using is leveraging structured data to narrow down unstructured data sources. Consider an example where your product is using a composer to get data from user, and you are tasked to build a classifier to bucket the data into categories. If you query beforehand on how many of these “composed data” used the free-form text field in some meaningful way (e.g., number of words), you can narrow down the amount of unstructured data needed to analyze and build the classifier in question.
- Evaluate data stacks and analytics tools: Big data analytics relies heavily on technology stacks that have made unstructured data analytics possible and cost-effective. Numerous approaches that have redefined ways data is managed by using the power of a distributed grid of computing resources have been defined and evangelized in the last decade. The final choice depends on the business use case. However, in general, data storage and information retrieval architecture are based on volume, diversity and scalability requirements. While volume is well understood and planned for, diversity of data (e.g., social media, emails, server logs, IOT sensor logs, etc.) and scalability requirements (e.g., scaling for peak seasonal periods) have become a huge topic of interest among big data practitioners.
When it comes to data stack, the two broad choices are data warehouse versus data lake. While data warehouses store data with defined structures, data lakes make it easier to use unstructured data because data can be accessed in its native format which in turn preserves the metadata and other properties that may be valuable in analysis. Figure 2 provides a quick comparison between data warehouses and data lakes.
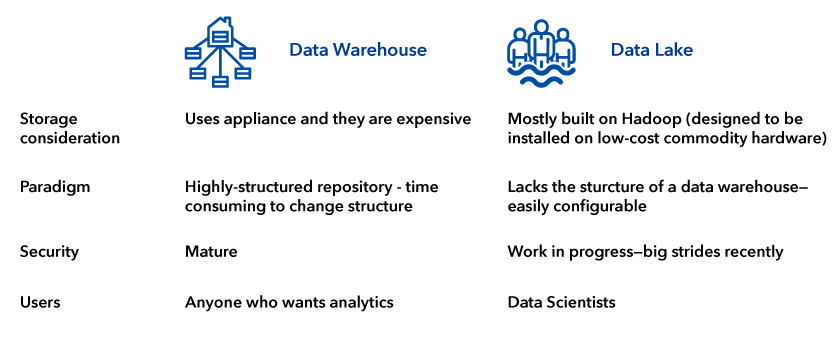
Figure 2: Data warehouse versus data lakes.
- Data clean-up: When working with unstructured data, data clean-up is the most time-consuming aspect of any analysis and/or machine learning model building. Cleaning data of whitespaces, symbols, etc., is a prerequisite before we can start diving into the details of the data. Another work that can be useful is to create relationship between sources and extracted entities, which will then help design a structured database for analysis purposes.
- Data analysis: Before we choose what methods/modeling/analysis techniques to use, it’s worth deliberating time to answer versus model complexity (see Figure 3). Depending on the business needs, sometimes it may be OK to fall back on less complex models that can deliver directional results in shorter time span, rather than wait for weeks to get a highly accurate answer.
In the case of machine learning modeling, depending on the type of problem, we may end up choosing supervised learning (classification and regression problems), unsupervised learning (association, clustering and dimensionality reduction) or reinforced learning (perform actions to maximize reward function). There are numerous great data science blogs that go into detail on these machine learning techniques.
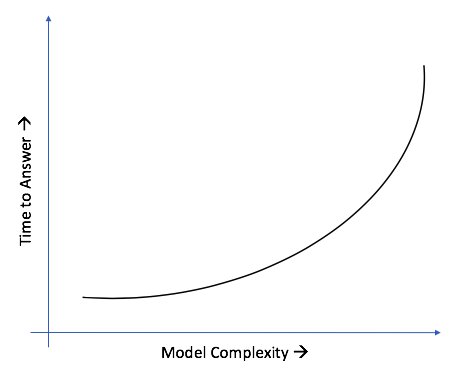
Figure 3: Time vs. complexity.
- Visualize data: Data visualization is an art that any data scientist needs to be good at in order to tell a compelling story from their analysis. The age-old wisdom that a picture is worth a thousand words applies to big data, too. Because of the way our brains are wired, charts and graphs that visualize data and analysis are easier to understand than endless spreadsheet reports oozing with data. Good data visualization helps decision-makers grasp analytical complexity and identify patterns. In short, a good visualization increases the ROI of data.
In Conclusion …
Unstructured data is heterogeneous and diverse in nature (text, image, video, sensors, etc.) and is growing faster than structured data. When analyzed properly, unstructured data analytics can reveal important insights that may be turned into a competitive advantage. I hope the nuggets described above will get you excited to explore the world of unstructured data and embrace big data analytics.
Navneet Kesher is the head of Platform Data Sciences at Facebook. Prior to joining Facebook, he served as a manager of analytics for Amazon. Based in the Greater Seattle Area, he holds an MBA from the University of Southern California.
([email protected])