April 2, 2020 in Coronavirus Chronicles
How to interpret coronavirus news in light of false negatives
SHARE: PRINT ARTICLE: https://doi.org/10.1287/LYTX.2020.03.01
As I write this, four people from my mother’s church in Williamsburg, Va. [1] are hospitalized with confirmed coronavirus. One of mom’s friends is very sick with respiratory illness, but her test result for coronavirus has come back negative. My first reaction was, “that’s probably a false negative.” There is plenty of evidence that some people who get negative test results actually do have the virus [2, 3]. As discussed here, there is a chance – a plausible number is 20% – that a person who does have the virus will nevertheless get a negative test result.
Many people interpret a negative result as an “all clear.” For example, a recent story describes a family isolating a new mother with COVID-19 from her new baby, but allowing her husband who had received one negative test result to care for the baby [4]. Others report staying isolated “until I test negative,” interpreting that as sufficient evidence of not being infectious [5]. And news reports also indicate doctors sometimes interpreting negative tests as definitive, for example, saying "I am shocked by the one or two negative results I receive during a shift" [6] and “The infectious disease doctors said one negative test here is good enough for us to rule out Covid” [7]. If we are going to use a negative test result as the basis for important decisions – such as whether to isolate yourself from family, whether a healthcare worker can continue working with patients – we should take into account the possibility of a false negative.
In addition, the total rate of positive tests is being used as the basis of estimates of the total incidence rate of the virus in the larger population. Neglecting false negatives can have a big impact on estimates of the true rate of cases (incidence) in the population at large. For example, a correspondence in The Lancet [8] (published March 12 and at press time cited five times according to Google Scholar) says, “Notably, the [true positive case rate] remains unknown because asymptomatic cases or patients with very mild symptoms might not be tested and will not be identified.” It doesn’t mention that people who are tested may also not be identified.
Even when the possibility of false negatives is acknowledged, their impact is not quantified. Applying what we know about false negatives, what can we say about the true incidence of the virus given estimates of the sensitivity and the observed positive test rate?
Coronavirus Testing
We focus on the novel coronavirus that appeared late last year in China, possibly transmitted to the human population by a bat, the virus that causes COVID-19, also known as SARS-CoV-2 [9] and the tests that detect RNA of the virus itself [10] rather than tests for antibodies to the virus or other signs of the disease. When we say “coronavirus test” we mean the combination of the collection of a sample (did the sample-taker really get a good smear of nasal secretions?), plus the handling of that sample through the laboratory testing for presence of the virus’ RNA and reporting the results. There is variability and potential for error at every step of the process. The Seattle Times reports on a story where a nurse simply misread a report, mistaking no result for a negative result [11].
What Are We Testing For?
Before addressing the accuracy of the test, it’s important to think about what a true positive case really means. If a person is a true positive case, does that mean they:
- are sick because of the virus?
- have been exposed to the virus?
- have the virus reproducing in their body?
- are shedding the virus, potentially infecting others?
This final definition is our working definition because it currently has the most impact on decisions – in many localities in the United States, test results are used to try to separate noninfected people from those infected by the virus.
Sensitivity vs. Specificity
Tests aren’t perfect – many of us are familiar with debates about the consequences of false positive cancer scares arising from mammograms and PSA tests, screening for breast cancer and prostate cancer.
The terms sensitivity and specificity are commonly used to summarize a test’s accuracy in terms of both false positives and false negatives, which can be confusing even for the mathematically savvy [12]. Sensitivity and specificity are attributes of the test itself and independent of the base (prior) rate of disease in the tested population, which we will call incidence. Table 1 shows how sensitivity and specificity and incidence determine the number of positive and negative test results.
|
|
|
Person’s true virus status |
|
|
|
|
|
Has virus |
Doesn’t have virus |
Total |
|
Test result |
Positive |
True positives P(positive test | virus)P(virus) = sensitivity x incidence |
False positives P(positive test | no virus)P(no virus) = (1-specificity)(1-incidence)If specificity is perfect, there are none of them |
All positive tests True positives plus false positives |
|
Negative |
False negatives P(negative test | virus)P(virus) = (1-sensitivity) incidence |
True negatives P(negative test | no virus)P(no virus) = specificity (1-incidence) |
All negative tests True negatives plus false negatives |
|
|
Total |
incidence |
1-incidence |
|
|
Table 1: Probability table showing how the rates of each result are calculated for the tested population depend on incidence (the proportion of tested people who do have the virus), sensitivity and specificity.
Specificity is the proportion of negative tests among all tests of people who do not have the virus. These are, by definition, tests with negative results: specificity = P(negative test | no virus). Perfect specificity is 100%, which means that 100% of people who do not have the virus correctly get negative test results. Using an analogy to hypothesis testing, if H0 (the null hypothesis) means the tested person does not have the virus, and HA (the alternative hypothesis) means they do, then the specificity is 1 - P(Type I error | H0), i.e. 1 - the probability of a false positive, given that H0 is true, i.e., the person does not have the virus.
Fortunately, the specificity of the RNA tests is nearly 100%, which makes sense because the test will come back negative unless the lab detects virus RNA, and there is quite a bit of history and testing showing that in the lab false positive results are rare.
On the other hand, as implemented, the test is not as sensitive as we would like – in other words, there is a chance that a person who has the virus will nevertheless test negative. Sensitivity is the proportion of positive tests among all tests of people who do have the virus. This can also be called the probability of detection – conditional on the case actually being positive (the person has the virus), is the probability of a positive test result. Using our hypothesis test analogy, the sensitivity is equivalent to the power of the test, i.e., 1 - P(Type II error | HA).
Importantly, we don’t know the sensitivity of the test as implemented. Some outlets are reporting that the test is highly sensitive [13], but this is based on tests on samples in the lab that are known to have the virus – this doesn’t account for problems in collection, reporting, etc.
Since “the test” includes all the steps from sampling through the laboratory test and reporting of results, there are many potential causes of a false negative [14]. Anecdotally, there is plenty of evidence that the sensitivity is not very high. The Washington Post reported on a case where a woman who contracted coronavirus on a cruise ship had mild symptoms, and reported having 14 tests, with results going back and forth including a “partial negative result” [15]. Remember early on hearing that 1,000 test kits meant only 500 people could be tested? That’s because the protocol was to take two samples from each person. The “partial negative” was a positive test on the nasal sample, but a negative result on the throat sample.
What is the sensitivity of the tests as implemented? We’ve seen estimates range from 66% to 98% [16], while values in the range of 70% to 80% may be realistic [17]. Moreover, as discussed above, there is a lot of variability in how testing is done – who is swabbing and how, how far samples travel, how long they wait, as well as inter-lab differences in how they are handled. And sensitivity could easily depend on the stage of the illness, and therefore change over time for a single individual with identical testing procedures. It could also change in a given population (e.g., locality) as the incidence in the tested population changes.
What does this mean for estimating the true incidence?
We can’t observe the true incidence, and we aren’t sure what the test sensitivity is, but we can use Bayes’ rule to relate the two. We can observe positive test rates, i.e., the proportion of the tested population that gets positive test results. Assuming perfect specificity, the total observed rate of positive tests, P(positive test) in the population can be written as:
P(positive test) = P(positive test | virus) x P(virus)
or, the observed positive rate = sensitivity x true infection rate.
Figure 1 shows the true incidence as a function of the observed positive rate for different values of the sensitivity. Since the false negative rate (1- specificity) is assumed zero, the relationship is linear. For example, if the sensitivity is 80%, the test gives positive results for 80% of cases who have the virus (and no false positives). Moreover, the observed positive rate tops out at 80%, which would occur if all people tested do have the virus.
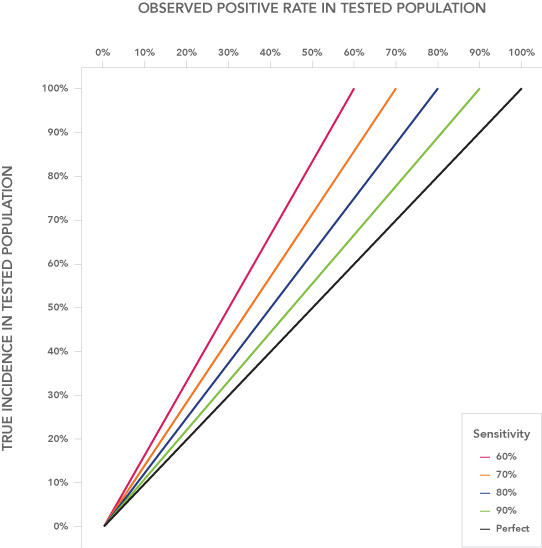
Interestingly, in the data from https://covidtracking.com/ on March 29, Delaware is currently showing an 86% observed positive rate. This is much higher than the rate for other states; New Jersey has the second-highest observed positive rate at 36%. Possibly, Delaware has a high sensitivity – really effective swabbing technique, etc. – and is testing only people with a very high prior probability of having the virus. 86% is on the high end of estimates of sensitivity, so Delaware’s observed positive rate suggests that nearly everyone getting tested in Delaware actually has the virus.
What does this mean for estimating the posterior risk following a negative test result?
The posterior risk – the probability that someone like my mom’s friend, who met the criteria for testing but received a negative test result and nevertheless has the virus – depends on the test sensitivity as well as true incidence, and the incidence can be estimated from the observed positive rate using sensitivity.
More specifically, still assuming 100% specificity,
P(virus | negative test) = P(negative test & virus) / P(negative test)=
P(negative test | virus) x P(virus) / P(negative test).
Figure 2 shows this posterior risk, P(virus | negative test), as a function of the observed positive rate for realistic possible values of the sensitivity. If the observed positive rate is 50%, the true incidence is 50%/80% = 62.5%. Of those 62.5 %, 20% (or 12.5% of the tested population) will get a false negative test result. Out of the 50% of the population that receives a negative test result, these false negatives are 25%.
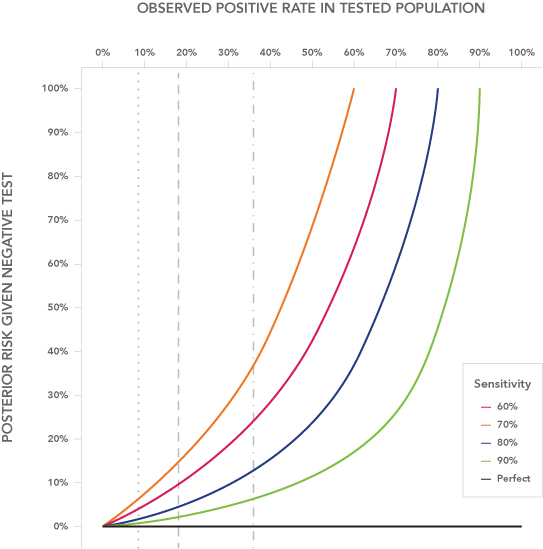
As the observed positive rate (and therefore the true incidence, per Figure 1) increases, the posterior risk goes up very fast. Note that the chances of an incorrect result increase as the incidence in the population goes up. Since we assumed perfect specificity, the only errors are a negative test for someone who does have the virus, so the more tested people who have the virus, the more errors. Another way to look at it is if there are fewer correct negatives (people who don’t have the virus) then the chances that a given individual with a negative result is one of those correct negatives goes down.
Sensitivity Analysis on Sensitivity and Incidence
If we can assume that sensitivity is the same over time and over different tested populations, then we can use the tested positive rate to infer differences in the incidence over time and for different tested populations. The tested population can change over time as the criteria for who gets tested change, and as the incidence rate changes in the population at large.
At the time of this writing, https://covidtracking.com is reporting New York, New Jersey and Michigan are the U.S. states with the highest total number of positive tests to date, and they are also the states with the highest true positive rates (excluding Delaware), all clustered at 34%–36%. California is the state with the fourth highest confirmed positive cases, but its observed positive rate is much lower at 18%. This probably means that its tested population has a lower incidence of the virus, perhaps because California is able to have less strict criteria for testing. California’s sensitivity would have to be half as high (e.g., 40% compared to an 80% sensitivity in New Jersey) for the difference in observed positive rate to reflect a similar true positive rate among the tested population.
If my mom’s friend in Virginia is typical of the tested population in Virginia, where the observed positive rate is 8.4%, her residual risk is less than 5% (calculated with a 65% sensitivity), which is pretty good news. If she were in Delaware, even at a 95% sensitivity, her residual risk would be 31%, and at 90% sensitivity, her residual risk would be 66%.
As discussed earlier, sensitivity is probably highly variable and hard to estimate. There generally won’t be a true result to validate against because getting a more reliable result for the same person at the same time is very unlikely. However, sensitivity could change over time, or from place to place. Since the personnel conducting the test don’t receive feedback on the quality of their testing that could help them improve sensitivity, we shouldn’t necessarily assume sensitivity will increase.
Takeaways
Understanding the incidence of the disease in the general population is very important for determining whether and when it will be safe to lift – or strengthen – social distancing policies. So far, the only data we have are the results for the tested population. Extrapolations to the larger population should account for the fact that even in the tested population we are not catching all the positive cases, and we should probably multiply the positive test rate by at least 120% (1/80%) to estimate the incidence among the tested population.
If test results are being used to support treatment decisions and especially isolation decisions, we need to understand how a negative result affects the estimate of risk for the tested person. That means we need better estimates of the true sensitivity of the test. Although it may seem to be a misuse of scarce resources to collect multiple tests, e.g., adding a CT scan, the information gained that could help interpret negative test results could make it worth the cost.
Author’s note: Interpreting negative results, and sensitivity/specificity, are reaching mainstream media outlets. On April 1, the New York Times published the following article: “If You Have Coronavirus Symptoms, Assume You Have the Illness, Even if You Test Negative.” The subhead read: “Just because a coronavirus test says you don’t have the virus doesn’t mean you aren’t infected – or infectious.”
References and Notes
- https://wuu.org/3-19-20-wuu-coronavirus-update-introducing-the-wuu-caring-ministry-excerpt-from-march-19-2020-spiral/
- https://www.mercurynews.com/2020/03/19/coronavirus-false-test-results-with-the-push-to-screen-come-questions-of-accuracy/
- https://www.bbc.com/news/health-51491763
- https://www.npr.org/2020/04/17/836719882/update-to-our-story-pregnant-and-worried-during-covid-19-pandemic
- https://pharmacy.ucsf.edu/news/2020/04/my-covid-19-journey
- https://www.nytimes.com/2020/04/14/magazine/coronavirus-er-doctor-diary-new-york-city.html?
- https://www.statnews.com/2020/04/15/covid-19-opens-unexpected-rifts-between-health-care-workers/
- Published March 12 and already cited five times according to Google Scholar, https://www.thelancet.com/journals/laninf/article/PIIS1473-3099(20)30195-X/fulltext.
- https://www.who.int/emergencies/diseases/novel-coronavirus-2019/technical-guidance/naming-the-coronavirus-disease-(covid-2019)-and-the-virus-that-causes-it
- There are other tests; for example, they’re developing antibody tests https://thehill.com/policy/healthcare/489723-uk-company-develops-prototype-of-cheap-10-minute-test-that-shows-if-you and https://www.sciencemag.org/news/2020/03/new-blood-tests-antibodies-could-show-true-scale-coronavirus-pandemic to detect the body’s reaction to the virus, which would indicate whether you had been exposed and developed antibodies. This would be useful for identifying people who could be more safely exposed to contagious patients.
- https://www.seattletimes.com/seattle-news/a-seattle-pilots-doctors-said-he-tested-negative-for-coronavirus-then-he-got-a-shocking-call/
- Fivethirtyeight.com apparently made a mistake in their first definition of sensitivity and specificity (see the note at the bottom of https://fivethirtyeight.com/features/how-coronavirus-tests-actually-work/).
- https://www.sciencemag.org/news/2020/03/standard-coronavirus-test-if-available-works-well-can-new-diagnostics-help-pandemic
- https://www.who.int/publications-detail/laboratory-testing-for-2019-novel-coronavirus-in-suspected-human-cases-20200117
- https://www.washingtonpost.com/outlook/2020/03/24/i-had-coronavirus/
- https://www.nature.com/articles/d41587-020-00010-2
- https://emcrit.org/ibcc/COVID19/#labs
Eva Regnier is a professor of decision science in the Graduate School of Defense Management at the Naval Postgraduate School in Monterey, Calif. Her research concerns summarizing uncertainty to improve both optimization and human decision-making.