February 17, 2021 in Baseball Analytics
From Moneyball to Betterball
MLB teams pitch analytics to build better players. So what’s on deck?
SHARE: PRINT ARTICLE: https://doi.org/10.1287/LYTX.2021.02.08

When someone mentions “sports analytics,” the first word that comes to mind for most people is likely “Moneyball,” the book by Michael Lewis and/or the movie starring Brad Pitt. In other words, baseball analytics. Baseball is the first sport where analytics took off and advanced most quickly for two very good reasons. First, because the majority of the game involves only two players at a time – the pitcher and the hitter. And second, due to the wealth of available data from 162 games per season for 100+ years.
In 2002, the innovation of Billy Beane and the Oakland A’s was in the area of player acquisition based largely on a batter’s on-base percentage (OBP). At the time a relatively obscure statistic, OBP includes other ways a batter can get on base besides hitting the ball (such as drawing a walk), in contrast to batting average, which was previously the key metric. The A’s success triggered teams to search for similar inefficiencies related to finding high performing players at a lower cost. But, as with financial market inefficiencies, these competitive advantages tend to close relatively quickly as other teams catch on and begin exploiting them too. Today, baseball has moved on from Moneyball to Betterball, where the focus is developing the players they already have, and keeping them healthy and injury-free.
Recent Trends
There will always be teams that spend money at the top of the free-agent market – Trevor Bauer’s recent record-breaking deal with the Los Angeles Dodgers echoes this sentiment. However, there is a reason top-selling baseball books today include The MVP Machine, The Performance Cortex, Homegrown and Future Value, all of which focus on building the best ballplayers instead of buying and acquiring them. In the era of mega-million-dollar free agent signings and contract extensions, teams are working to develop their stars of tomorrow from within the organization.
It begins with the idea of marking a player to market – determining the actual value of a player rather than their perceived value. Due to the nature of rookie contracts in Major League Baseball (MLB), players on these league-minimum contracts are often playing at a level that would warrant a multimillion-dollar contract on the open market. Teams fortunate enough to have these players on their roster are getting millions of dollars in value at a fraction of the price. Recognizing the value of these players is not an uncommon concept; in many ways, it simply builds upon what Billy Beane and the Oakland A’s did on the free-agent market. The advantage of using this value metric in the player development department is the ability to build the process on a much larger scale. For players as young as 16-18 years old, teams can begin to “build” players who can contribute at the major league level at a fraction of their market cost, as described by FanGraphs.
How do teams go about building these players? It starts with advances in technology. Not long ago, instant replay was considered among the leading technology advancements in baseball. Replay has already given way to both on- and off-field evaluation tools. Pitchers utilize Rapsodo and Edgertronic cameras to capture and design more effective pitches and wear core velocity belts during offseason workouts in an effort to strengthen their mechanics. Hitters utilize K-Vest, SwingTracker and Kinatrax for insights into mechanical tendencies that can lead to injury, fatigue or a decline in performance, as well as opportunities to improve. Those who spend time at any MLB team’s spring training complex will notice many of these devices in use during team workouts. Additionally, all fans who attended games in recent years at any major league ballpark may have seen the TrackMan/StatCast system in use behind home plate. Every play is captured with hundreds of data fields, ripe with information that is used to build better ballplayers.
The move toward player development and injury prevention within the analytics community is resulting in a stronger emphasis on biomechanics. Recent advancements in technology allow both players and coaches to break down and optimize a player’s movements to activate the kinetic chain, which is important for maximizing the force put upon the ball, as well as minimizing injury risk. Pitching labs such as Driveline Baseball rose to prominence with their emphasis on biomechanics as players discovered its potential to both accelerate and elongate their careers. These labs made use of high-speed video cameras such as Edgertronic, which allowed trainers to walk a player through their movements to make corrections and enhancements in real time. Many MLB teams now employ these biomechanics specialists, such as the Cincinnati Reds’ Kyle Boddy (Driveline Baseball), to consult players in-house.
Latest Advances
Advances in optical technology, such as MLB’s implementation of Hawkeye, now allow teams to analyze a pitcher’s biomechanics in-game. Using this technology, coaches can notice signs of fatigue or potential injury in real time. Many within the field believe that optical analysis is the future of baseball analytics, because it allows for the quantification of abilities and tendencies previously determined by the eye test. For example, Stats Perform uses video data to quantify a pitcher’s command with their Command+ metric, which measures the distance between the catcher’s mitt position and where the ball was pitched. At the 2019 MIT Sloan Sports Analytics Conference, Stats Perform’s Sujoy Ganguly explained how optical technology can also be used to break down the variability in a pitcher’s motion to determine tendencies for different pitch types. Analysts can now use optical analysis to find signals pointing to opponent pitching decisions, further embedding technology closer to the on-field competition.
While there is an increased prevalence in technology and analytics within baseball, a gap still exists between the findings of baseball analysts and the understanding of baseball players and coaches. For example, this gap is the difference between communicating a significant loss of kinetic energy in a player’s swing registered on a biomechanics device and implementing a workout routine to increase hip mobility. Younger players are becoming increasingly analytics-fluent due to their earlier exposure to baseball analytics in their training or in the media. However, there is a risk in having players drink straight from the firehose of analytics data. Because many technologies’ outputs use thousands of data points – many of them useless or confusing without context – it is the role of analysts to convert data into actionable insights.
Because of the recent explosion in the amount of data available to analysts, teams are employing much larger analytics teams and infrastructure to make analytics manageable and maintain their competitive advantage. For example, the Dodgers employ five performance science analysts, 10 quantitative analysts and two biomechanics specialists in their front office. When compared with four player development and eight scouting personnel, the importance of STEM-related fields in modern baseball is apparent. The value a strong analytics staff can bring to help win baseball games has led to a rise in analytics staff size, with a stronger correlation between analytics staff size and winning percentage than player payroll (see Figures 1 and 2).
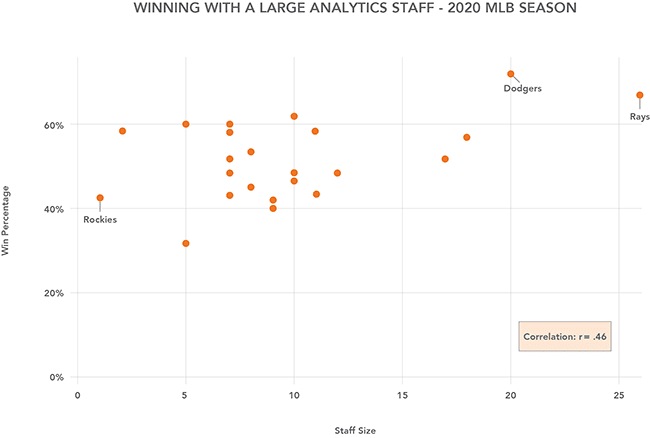
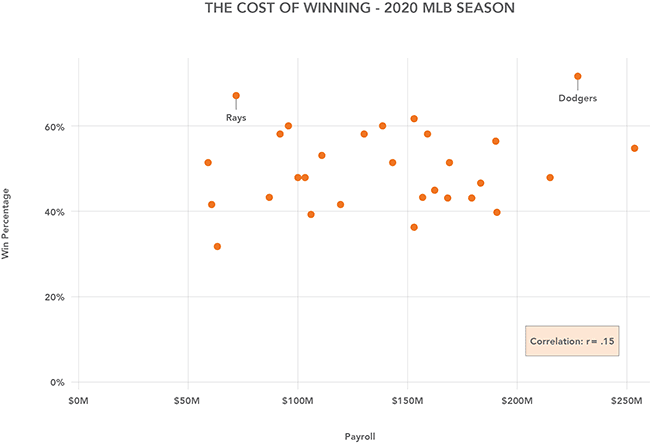
Figure 1 (top) and Figure 2 (bottom): Analytics staff size has a stronger correlation to winning percentage than player payroll.
Sources: Baseball Reference, MLB.com, Statista
Teams employ large analytics teams so that data-driven insights can be embedded in every level – across front office operations, in-game decisions and player development. Analytics becomes part of a team’s culture and operating model. Many front offices now make free agency decisions based on predictive models, one cause of the slow market in recent off-seasons. Radar, biomechanics and other technologies are present at facilities at each level, with the data analyzed by a centralized group so that the team has awareness and influence over the performance and development of each player in the organization. Teams focus on lessening the gap between analysts and baseball personnel so that players and coaches have a better understanding of the decisions and insights from the data.
Increased accessibility to, and awareness of, baseball analytics tools has allowed analytics to spread well beyond MLB. Many Division 1 college baseball teams have Trackman systems in their ballparks, allowing them to collect similar data points from games. Many programs also make use of other technology systems such as Rapsodo and Edgertronic, bringing analytics and biomechanics capabilities into college bullpens. Analytical-minded college students took advantage of this sudden influx of data, and baseball analytics teams popped up across college campuses, including Notre Dame and the University of North Carolina. As a result, collegiate athletes and analysts are now exploring data-based scouting, game planning and player development.
What’s Next?
Where does the sport go from here? One frontier that will continue to be explored is informing the fans on how the game is evolving. In small ways, this process has already begun. At American Family Field (formerly Miller Park) in Milwaukee, a player’s on-base plus slugging percentage (OPS) replaced their batting average (BA) on the Jumbotron. At Guaranteed Rate Field in Chicago, an “Advanced Stats” section routinely comes up for players on a video board. These practices are not limited to at-the-ballpark experiences. StatCast broadcasts occur from time to time, introducing fans to the game’s numbers in a conversational, digestible fashion. As the game continues to evolve, heightened importance will be placed on showing fans that while the game is changing, it is still the same game they all grew up to love.
With the vast domain of information available to players, two questions remain the same: “How do we interpret this data?” and “What insights can be gained and what positive changes can be implemented from this information?” These questions continue to drive the industry forward, and as a result, will soon make the analysis of today this decade’s version of Moneyball.
Note: This is the first in a series on sports analytics.
Analytics in the Dugout
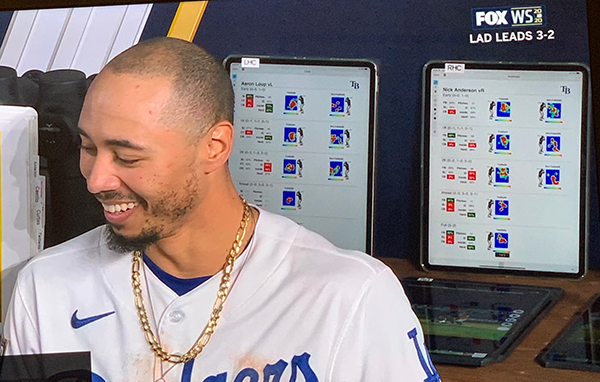
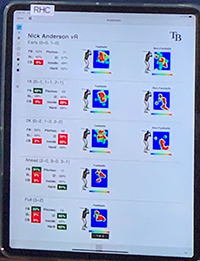
Dodgers star Mookie Betts gives a dugout interview for Fox Sports in Game 6 of the 2020 World Series. In the background, fans watching get a view of some of the Dodgers’ scouting reports on the Tampa Bay Rays’ pitching staff. Included appear to be heat maps by pitcher and pitch type, as well as video of each pitcher in the Rays’ bullpen. This quick snapshot shows just how far technology for players and coaches has come – up until moments before an at-bat, hitters can get more detailed information on their opponent than ever before.
Kenta Sachen is a full-time student and the Baseball Analytics team lead at the University of Notre Dame (UND). Jordan Lazowski is a 2019 UND graduate currently working as a consultant for AArete. Luke Vandertie, a 2019 UND graduate, is a technology consulting associate with PwC. Scott Nestler, PhD, CAP-X, PStat, is professor of practice and sport management at the University of Florida and director of the UF Sports Analytics Lab.