

September 23, 2021 in Revenue Forecasting
Revenue Forecasting at RealWear
Use case: The design and implementation of an ensemble machine-learning model
SHARE: PRINT ARTICLE: https://doi.org/10.1287/LYTX.2021.06.04

Measuring revenue or sales can provide monetizable and actionable insights about a business because important details about its customers, products, services, quantities, prices, discounts and more are reflected in revenue. Forecasting revenue helps a business be proactive, make good decisions and take companies to a higher level.
RealWear, a world leader in assisted reality devices for frontline workers, requested a quarterly revenue forecasting model (RFM) to proactively manage its business. Headquartered in Vancouver, Wash., with local offices in the United Kingdom, India, Singapore, Germany, Australia, the Netherlands and Korea, RealWear’s world-class customers include Shell, Goodyear, Mars, Colgate-Palmolive and BMW. RealWear has shipped wearable devices to thousands of enterprise customers worldwide in a range of industries, including energy, manufacturing, food and beverage, automotive and telecommunications. This article describes the RFM ensemble machine-learning model designed and implemented for RealWear.
Ideal Customer
Given the importance of revenue in business success, RealWear wanted to develop the RFM for the sales of HMT-1, its flagship product. An ideal customer of RealWear’s HMT-1 device is one that:
- is in process and continuous manufacturing industries such as automotive and food and beverage;
- deploys devices at scale across multiple sites to large workforces;
- is capital intensive and “safety-first” such as in oil and gas, mining or petrochemical;
- has frontline workers who require both hands for the job but still need access to information in real time; and
- has a distributed workforce and knowledge, such as the telecom and utilities sectors.
The quarterly RFM is important to RealWear for three main reasons:
- It offers better customer service with improved inventory management of the RealWear HMT-1 assisted reality devices (along with software and services).
- It improves spend management with ICC (inventory carrying cost) and NWC (net working capital) optimization.
- It provides accurate guidance to investors and the board of directors.
In short, RealWear wanted a predictive analytics “what-will-happen” solution to make it a more proactive business. Predictive analytics enables business enterprises to proactively anticipate business outcomes, behaviors and events to better plan and respond. However, a forecast or prediction is based on several variables. Just as a weatherman looks at humidity, wind speed and other factors to forecast the daily weather, revenue forecasts are dependent on many factors, such as past financial performance, product maturity, market sentiments, sales pipelines and other pertinent economic and business factors.
It is nearly impossible to precisely predict revenues. According to Nobel Prize laureate Niels Bohr, “Prediction is very difficult, especially if it is about the future.” However, it is important for companies such as RealWear to create reliable forecasting models so that they have a good understanding of the market, the customers and the company. Even a prediction model that is 80% accurate is more valuable than not having any revenue forecasts and, consequently, being reactive and blindly guessing market needs. As quality guru Edward Deming once said, “Management is prediction.”
RFM Solution
The RFM solution for RealWear was to leverage ensemble data analytics models in combination with aggregates, confidence intervals and quality historical data to predict the revenue for the next four financial quarters. Fundamentally, ensemble methods use multiple diverse data analytics models with appropriate weights for each of these models to perform predictive analytics. The weights assigned to the models represent relative importance to calculate an optimal or weighted average prediction output. The value of ensemble models is that they reduce the variance and risk in the individual models by combining outputs from multiple data analytics models.
The RFM ensemble model for RealWear was designed using a combination of two diverse frameworks, with eight different models coming from each of the two frameworks. The two diverse frameworks are causal and timeseries. Each of these frameworks has weights (i.e., the relative importance and weights for each of the three frameworks). The eight different models were selected from feedback from field intelligence (i.e., both internal RealWear team and external experts). The integrated RFM is shown in Figure 1.
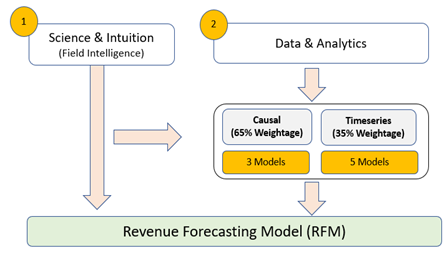
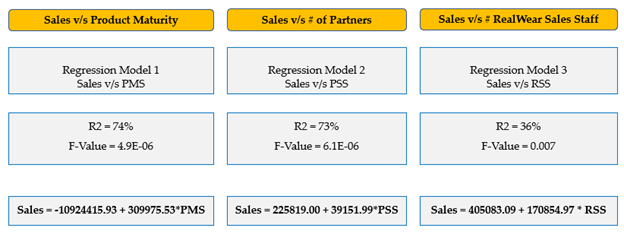
The first framework in the RFM ensemble model is the causal framework. Causal frameworks rely on regression models to make predictions on the dependent or output variable using the independent or explanatory variables. Regression is a statistical method that allows one to examine the relationship between two or more variables of interest. At the core, regression models examine the influence of one or more independent variables (predictor) on a dependent variable (target). In the regression prediction model for RealWear, the dependent variable or effect is the revenue, while the independent variables or the causes are explanatory variables such as HMT-1 product maturity, the number of channel partners, and the number of staff on the RealWear sales team.
We found high level of correlations between the independent variables (i.e., HMT-1 product maturity scores, number of channel partners and the RealWear sales team). This association, which is technically called multicollinearity, prevents us from using a single multiple linear regression model. Hence, three separate, simple linear regression models were considered over one multiple linear regression model. The causal framework with the three data analytics models or the regression models with the respective weights is shown in Figure 2. After exploring several different explanatory variables that affect revenue, we found three variables that are reliably correlated to sales, as measured by the R-squared value.
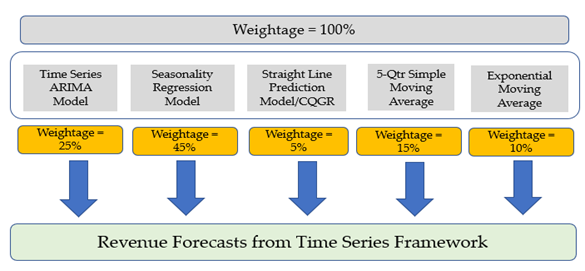
The second framework in the RFM ensemble model is the timeseries framework. Timeseries prediction algorithms help in deciding how a variable will perform in the future in regard to time. Any process that is observed sequentially or at regular intervals of time (e.g., hourly, daily, weekly, monthly, quarterly or annually) is noted as timeseries. The timeseries framework in the RFM model encompasses five timeseries models acting on the historical data of 17 financial quarters and is depicted in Figure 3.
Finally, the two frameworks (causal and timeseries) are combined to form one integrated RFM model (Table 1). (For confidentially reasons, the predicted revenue figures are not displayed.)
|
Year |
Qtr |
Causal Model (65%) |
Time Series Model (35%) |
Weighted Average |
Variation |
Low Range |
High Range |
|
2021 |
Q3 |
||||||
|
2021 |
Q4 |
||||||
|
2022 |
Q1 |
||||||
|
2022 |
Q2 |
Table1 : Integrated RFM model.
This RealWear ensemble RFM model has some constraints and assumptions:
- The causal regression models assume that HMT-1 product maturity improves by 3%, RealWear sales staff grows at 15%, and the channel grows at 6% quarter-over-quarter.
- The forecasts were done using data from 17 financial quarters considering that RealWear started operations in 2017. With more data, the model will likely change.
- Large, one-time sales might affect the forecast accuracy. No drastic digital disruption solutions in the wearable technologies segment and force majeure events are seen for the next four financial quarters.
- RealWear’s business model largely remains the same with no sale, acquisitions, etc., and new product launches or acquisitions are planned over the next four quarters.
- The RealWear HMT-1 retail price will not drastically change.
Former CEO of General Electric Jack Welch once said, “An organization’s ability to translate insights into action is the ultimate competitive advantage.” In today’s digital and data-centric economy, no organization can afford to ignore the value of data to derive insights to make better decisions. Predictive analytics, “what will happen,” is the use of data, algorithms, assumptions and ethics to identify the likelihood of future outcomes and make better decisions. Predictive analytics in combination with field intelligence and prescriptive analytics (i.e., optimization and sensitivity analysis) will not only help in proactive decision-making, but will also facilitate better resource, capacity and capability management, and offer a clear competitive advantage to the company.
References
- Levy, Marty, 2018, “Four Reasons Why Revenue Growth is Important,” Feb. 13, https://levelupgrowth.com/f/four-reasons-why-revenue-growth-is-important.
- Maisel, Lawrence and Cokins, Gary, 2014, “Predictive Business Analytics,” Wiley.
- Southekal, Prashanth, 2020, “Analytics Best Practices,” Technics.
Prashanth Southekal ([email protected]) is the managing principal of DBP-Institute (www.dbp-institute.com), a data and analytics consulting and education firm. He has consulted for more than 75 organizations including P&G, GE, Shell, Apple and SAP. Southekal is the author of two books – “Data for Business Performance” and “Analytics Best Practices” – and regularly writes on data, analytics and machine learning for business publications. Apart from consulting pursuits, he has trained thousands of professionals worldwide in data and analytics. He is also an adjunct professor of data analytics at IE Business School (Madrid, Spain), and has a Ph.D. from ESC Lille (France) and an MBA from the Kellogg School of Management (Northwestern University). Andrew Lee ([email protected]) is the chief financial officer (CFO) of RealWear. He is a licensed CPA and holds an MBA degree from Washington State University. Prior to joining RealWear, Lee led finance and operations as the CFO of Ryonet Corporation in Vancouver, Wash. He is a director on the board of AmpliTech, Inc., where he also serves as the chairman of the audit committee. Gary Cokins is an internationally recognized expert, speaker and author in enterprise and corporate performance management systems. He is the founder of Analytics-Based Performance Management and also serves as an advisor at DBP-Institute. He began his career in industry with a Fortune 100 company in CFO and operations roles, followed by 15 years in consulting with Deloitte, KPMG and EDS. From 1997 to 2013, he was a principal consultant with SAS. His most recent books are “Performance Management: Integrating Strategy Execution,” “Methodologies, Risk and Analytics” and “Predictive Business Analytics: Forward Looking Capabilities to Improve Business Performance.”


([email protected])