September 9, 2026 in Sports analytics
Playing by the Framework
Applying the INFORMS Analytics Framework to Sport Analytics
SHARE: PRINT ARTICLE: https://doi.org/10.1287/LYTX.2026.03.06

Last fall (prior to the dismissal of former Gators football coach Billy Napier), a Florida fan stopped by my office and asked what he thought would be a simple question to answer with some data and a model.
“Which defensive formations give our next opponent’s short-yardage offense the most trouble?”
He wanted something useful to share with the coaches in a couple of days. But what he was describing, without knowing it, was a compressed analytics project, one that required framing the right question, finding the right data, building something reliable under time pressure, and delivering it in a form a coaching staff could use. That last part – the delivery – is where a lot of analytics work quietly falls apart.
Sports analytics has come a long way. It has moved from spreadsheets in the back office to dedicated departments in every major professional franchise and many college programs. But maturity in tools has not always meant maturity in processes. Too many analytics efforts still treat the life cycle as a straight line from data to output, skipping the structured thinking in between. The INFORMS Analytics FrameworkTM (IAF) exists precisely to fill that gap. It turns out sports analytics is one of the best places to show why that structure matters.
What Is the IAF?
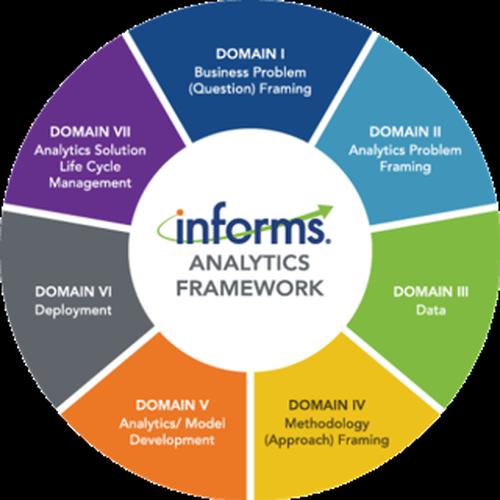
The IAF organizes analytics work into seven sequential domains: Business Problem (Question) Framing, Analytics Problem Framing, Data, Methodology (Approach) Selection, Analytics/Model Development, Deployment, and Life Cycle Management. It started as the conceptual backbone of the Certified Analytics Professional® (CAP) examination, providing a way to define what a well-rounded analytics professional knows and does. Over time, it has been updated to reflect modern realities – including machine learning and generative AI – and it now underpins a three-tier credentialing structure that ranges from foundational to expert-level practice.
CAP - Choose Your Level
The IAF provides a structure for thinking and making sure the work done in Domain V solves the problem defined in Domain I. Skipping domains does not save time. It just moves the rework to the end, usually right before a big presentation.
Sports as a High-Stakes Testbed
Sports analytics is harder than it looks from the outside. The data is plentiful, but it is often proprietary, inconsistently formatted, and laden with quality issues. The stakeholders (coaches, athletic trainers, general managers, and sport performance directors) each have different questions, vocabularies, and levels of trust in numbers. The sample sizes are small: a college football team plays twelve regular-season games. The decisions are visible. And the deadline is always soon.
At the UF Sports Analytics Lab, our team of roughly 40 students works alongside athletic programs across more than a dozen sports. Besides football and basketball, our programs also include gymnastics, swimming, and golf. We build predictive models, automated scouting reports, interactive dashboards, and injury-risk tools. Over time, I have noticed a consistent pattern: the projects that deliver real value are the ones in which we spent serious time on the early domains. The projects that stall or disappoint almost always skipped earlier domains.
But every domain plays an important role in sports analytics.
Domain I: Business (Question) Framing
The most common reason for failure in sports analytics is not a bad model, but a bad question. The coach asking about short-yardage defense does not really want a general report on defensive analytics. He wants to know whether to run a base 4-3 or bring in a nickel package against this specific opponent’s personnel grouping on third-and-one. Those are very different deliverables. Domain I is where you figure out which deliverable you are actually building, and who, specifically, is going to make a decision based on it.
Domain II: Analytics Problem Framing
Once the real question is clear, it must be translated into an analytics one. Is this a descriptive problem (“What happened last season?”), a diagnostic one (“Why did our offense struggle in the fourth quarter?”), a predictive one (“Which recruits are most likely to become starters?”), or a prescriptive one (“How should we sequence the pitching rotation this weekend?”).
Each type pulls you toward different methods, different data requirements, and a different definition of success. Teams that skip this step often produce elegant analyses that answer the wrong question with impressive precision.
Domain III: Data
Sports is simultaneously data-rich and data-messy. Sources like tracking feeds, biometric wearables, video systems, and internal practice logs multiply rapidly – and so do any inconsistencies. Domain III is where you sort out what data you have, whether it is good enough to support the analysis you are planning, and where the gaps are. This is also where AI is changing the game: large language models can now extract useful signals from unstructured scouting notes and coach observations that used to be invisible to analytics. However, LLM outputs still need to be validated before you make any decision.
Domain IV: Methodology (Approach) Selection
The right method is not the most sophisticated one. It is the one best matched to the problem, the data, and the person who will use the result. A Bayesian hierarchical model might be technically optimal for estimating pitcher fatigue, but if the pitching coach cannot engage with a posterior distribution, a well-calibrated logistic regression with clean confidence intervals will do more good. Methodology framing also means being honest about what is feasible: what your team can build in the time available on the infrastructure you have.
Domain V: Analytics/Model Development
This is where most sports analytics conversations start. It should be where they arrive, not where they begin. Model development in sports requires real care regarding validation: back-testing against prior seasons, out-of-sample testing with held-out games, and honest accounting for how fast performance degrades when rosters change. AI tools have genuinely expanded what is possible here, particularly with computer vision for biomechanics and LLMs for automated narrative generation. However, they have also introduced a new class of failure modes that are easy to miss.
Domain VI: Deployment
The most under-appreciated domain in sports analytics is getting the work used. A good model that lives in a Jupyter notebook and gets emailed as a PDF the night before a game is not deployed, but rather delivered just once. Real deployment means building tools coaching staff can access on their own: interactive dashboards, automated weekly reports, or natural language interfaces that let a non-technical user ask follow-up questions without calling an analyst.
Earning that level of adoption also requires something less technical – trust. Coaches have been burned by overconfident analysis before; making the work accessible and easy to interrogate is how you start to earn it back.
Deployment is also where analytical rigor lives or dies in practice. In a recent presentation, “Trusted Numbers, Trustworthy Code,” I argued that many analytics teams quietly undermine their own deployed work through avoidable process failures: ad hoc file versioning, monolithic scripts no one else can read, and analysis done without peer review. Three habits address most of it: 1) version control so every pipeline change is traceable; 2) code quality standards so work can be handed off; and 3) lightweight automated tests that catch silent failures before they reach a coach’s screen. When a deployed model corrupts a key metric because a join silently dropped 18% of rows, that is not a statistics problem. It is a process problem, and it is preventable.
Domain VII: Analytics Solution Life Cycle Management
This is the domain where most sports analytics programs fail quietly, well after the initial launch. A model built in August for football season can be stale by November if key personnel change. A recruiting model trained on last year’s class may not transfer cleanly to this year’s class. Life cycle management means being deliberate about ownership. Someone must be responsible for monitoring performance and triggering retraining. It also means being deliberate about timing, since sports have natural rhythms (off-season, pre-season, in-season, post-season) that analytics programs should align with. This is one genuine advantage of a university-based lab; even as individual students rotate through, the institutional infrastructure persists.
The Common Thread: Trust
I mentioned earlier that trust, which runs through every domain of the IAF, does not show up explicitly in any of them. Domain I builds it by confirming that analysts and decision-makers are working on the same problem. Domains III and V build it through data integrity and honest validation. Domain VI builds it by making the work accessible and transparent. Domain VII sustains it by keeping the work accurate over time.
Analytical trustworthiness is a property of the process, not just the model. A single brilliant analysis that cannot be reproduced, updated, or explained is a one-time event, not a durable capability. The sports organizations building real analytics programs, where coaches change decisions because of the analytic work, are the ones that have invested in the process infrastructure that makes trust reproducible.
What Sports Teaches the Rest of Us
Enterprise analytics professionals sometimes look at sports analytics as a niche application, meaning that it is interesting, but obviously not relevant to financial services or supply chain or healthcare. I would argue the opposite.
The features that make sports analytics difficult, including impatient stakeholders, real-time decisions, small sample sizes, noisy data, and high public visibility, are increasingly common in corporate environments as well. The solutions are the same: frame the problem before you touch the data, match the method to the audience, treat deployment as a first-class responsibility, and plan for lifecycle management from the beginning.
The sports analytics market is projected to exceed $23 billion globally by 2033. As AI lowers the technical bar for building models, the differentiating factor will not be who has the most sophisticated algorithm. It will be who has the most disciplined process. The IAF is a well-tested answer to that question, and sports analytics is a great place to see it in action.
Building the Process
When a coach asks for analysis by Wednesday, the instinct is to open the data right away. The better move is to start with the question. What decision do you want to make? Who will make it? What would change their mind? That discipline – of framing first and building second – is at the heart of both the INFORMS Analytics Framework and good sports analytics practice. The seven domains are not obstacles. They are the difference between analysis that gets filed away and analysis that changes what happens on the field.
Scott Nestler, PhD, CAP-X, PStat, is professor of practice and sport management at the University of Florida and director of the UF Sports Analytics Lab.