November 17, 2026 in revenue
A Strategic Blind Spot
Revenue Predictions Without Intervention Awareness Sacrifice Accuracy
SHARE: PRINT ARTICLE: https://doi.org/10.1287/LYTX.2026.03.22

You are in a meeting with your company’s finance team, which is presenting its annual revenue forecast as a nice curve developing from the historical data. The product team then announces that they will release a major new feature in Q3. The marketing team follows up by announcing a big campaign blitz to promote that feature. Everyone in the room silently wonders if the finance team’s forecast has considered whether the announcements by the product and marketing teams will impact its third quarter revenue predictions.
While meetings during which million-dollar bets are made based on forecasts have become the norm, most of these forecasts do not take into account the work that different teams are doing to drive the number the finance model is predicting. This work, which should be the basis for the finance team’s forecast, is typically left to other departments such as the product team, which has its own processes, tools, and systems to drive user growth and capture related user activity.
Traditional forecasting models learn from past data to forecast future numbers, which assumes the future will be a continuation of the past. However, those models may not account for a promotion that is scheduled to launch in the current quarter, a feature that will launch in a month, or a market the company is going to enter in the next quarter.
This is not a minor issue that can be fixed by slightly recalibrating a few numbers. There is a strategic blind spot here that can cost organizations a lot of money.
Limits of Traditional Forecasting
Traditional forecasting learns patterns from a company’s historical KPIs and projects them forward in time, accounting for appropriate trends and seasonality and then approximating future values. Often this approach can coast along for long periods of time until the day the forecast no longer makes sense.
But large companies do not just coast along. They intervene in their processes to achieve further growth.
For example, say a product team decides to launch a major feature, and the finance team asks for a revenue forecast that reflects it. The data scientist who owns the company’s forecast model runs it using the details the product team provides. But the model only knows the trends and seasonality in past revenue, so its projection cannot account for the launch itself or for the marketing campaign planned to promote it. To fill the gap, someone adds a flat 15% on top of the model’s number as a rough estimate of the campaign’s lift.
That’s not forecasting. That’s guessing with extra steps.
There are additional challenges to modeling the interactions of multiple interventions.1 Consider a product launch with a promotion in the middle of a seasonal holiday. The effects of non-linear interactions between interventions need to be captured, so decision-makers will be interested in not only a single point forecast, but also in the analysis of alternative scenarios (e.g., running a promotion in Q3 instead of in Q4). The consequence of not intervening in the market is also important to understand.
Here are a few familiar scenarios that all tech leaders will recognize:
- The Feature Launch Dilemma: A product team wants to launch a feature in six months, but the cost is $2M to accelerate the launch so it is ready within that time frame. Would the incremental revenue justify the extra expense? A traditional forecast will give you one single trajectory in time. Two single trajectories, one including the expense for the accelerated launch and the other not including it, are necessary to make a good data-driven decision.
- Campaign Timing: Many companies give their marketing team a single annual budget. In the launch example above, the team must decide when to spend it. Running the campaign at the same time as the launch may produce a bigger combined effect, but it becomes hard to tell how much of the lift came from the feature and how much from the campaign. Running the campaign a few weeks later makes each effect easier to measure, but that may give up some of the combined boost. Today this choice is usually made on gut feel and justified after the fact. It would be far more useful to simulate and compare both scenarios before spending any money.
- Expansion Risk Assessment: A company wants to enter a new market and plans heavy promotions to build early demand. The risk is that revenue may look strong while the promotions run, then fall away once they stop, leaving the company with costs it cannot recover. A traditional forecast cannot tell leaders how much of that early revenue will last. An intervention-aware forecast, which learns how revenue responds to promotional intensity, can estimate both expected uplift and how long the effect persists after promotions end.
How Do We Fix This?
By implementing an encoder-decoder model using an intervention embeddings, transformer-based encoder-decoder system, we can forecast the impact of KPIs, such as revenue, user growth, etc., on a company’s historical data as well as on future planned interventions. The interventions are causal inputs to the KPIs and thus are treated as features of the model. The historical data temporal patterns interact with the intervention embeddings through gating mechanisms.3 The model can learn how much an intervention matters, when its effect peaks, and how quickly it decays.
Importantly, all interventions can be toggled on or off at inference time. This means that for any given set of input features, the model can generate corresponding counterfactual scenarios, such as, what would happen if no campaign was run, or if the campaign in question was larger?
The Numbers Tell the Story
We validated the intervention-aware model on the public Rossmann Store Sales dataset, treating promotional periods as intervention signals.4 Here is what we found:
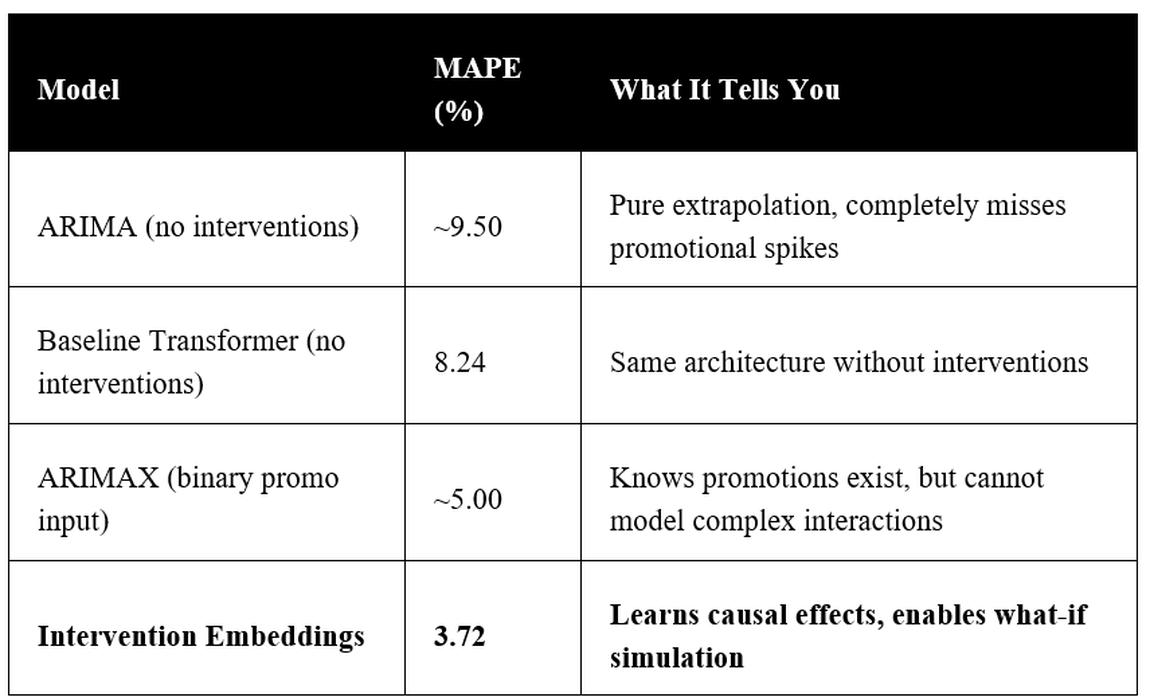
That’s more than a 50% reduction in forecasting error. Translated into language an executive would understand, for a company with $1B in revenue, an 8% mean absolute percentage error (MAPE) means planning around ±$80M of uncertainty. You need large cash reserves and conservative hiring to do that. At 3.72% MAPE, that uncertainty band shrinks to ±$37M. You just freed approximately $43M in capital that can go toward growth, R&D, or shareholder returns.
When the promotion signal was active, the model predicted approximately 20% revenue uplift during the promotion month and a 5%-10% sustained lift in the following months from retained customers. Toggle the promotion off, and it reverts to the baseline trajectory. That’s not just accuracy improvement. That’s decision intelligence.
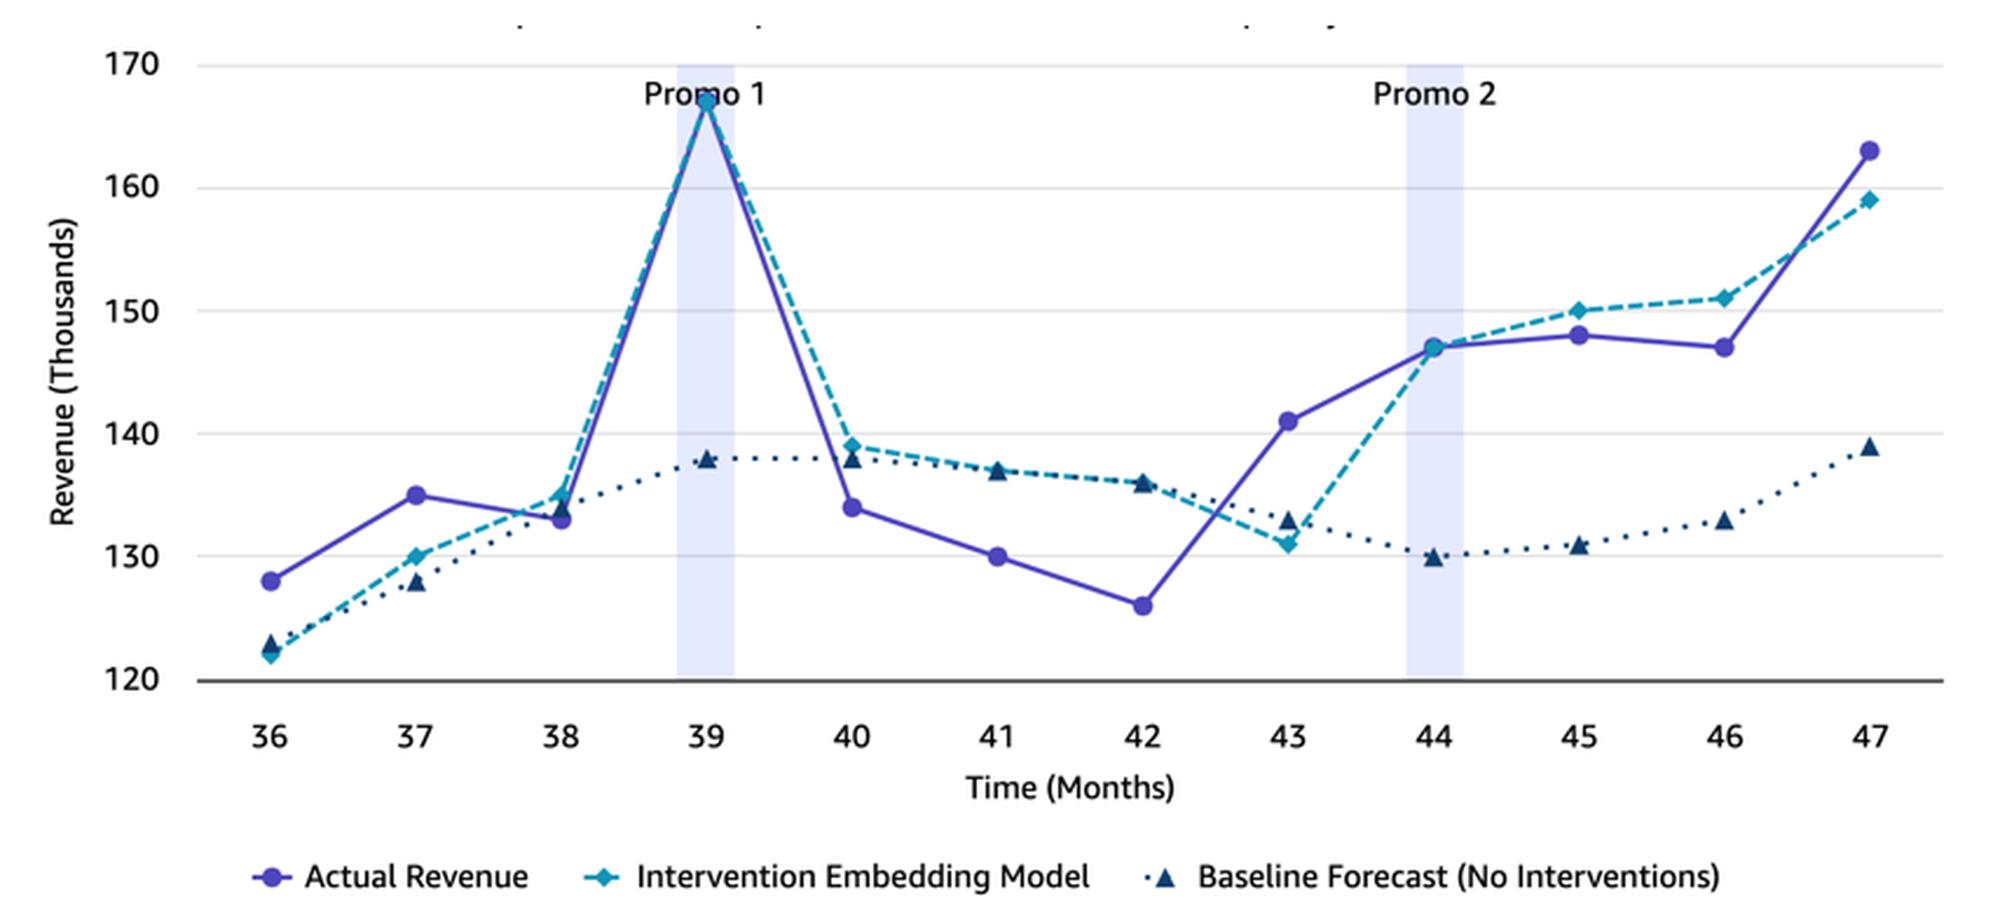
Fig 1: Example Scenario Forecasting with and without Interventions
Why This Matters
Three trends make it urgent to build causal AI into decision intelligence systems. First, the market for causal AI is projected to grow from $56.2M in 2024 to $456.8M by 2030.1 Second, in a capital-constrained environment, every investment is closely scrutinized and needs a projected return on investment (ROI) before it is approved. Third, leading companies are already moving. Uber, for example, is building tools around counterfactual simulators.2 Together, these trends mean that forecasts that cannot model the expected impact of proposed actions and decisions are quickly becoming insufficient for the boardroom.
Actions to Take Now
Stop treating financial forecasts and plans as though they are entirely separate.
The forecast should function as a component of the plan, influenced by the interventions that companies intend to make. Any forecasting system that does not take a planning intervention calendar as input will produce an incomplete view of reality.
Demand counterfactual capability.
The most valuable question for any forecast is, what will revenue be if we do X versus Y? A company’s forecasting infrastructure should support scenario comparison natively. A well-designed promotion can have a lasting effect on sales, even after the immediate impact of a campaign. For example, if a retailer acquires customers as a result of a promotion who then go on to generate revenue for months or even years after the promotion, it is important to include decay dynamics in a model of promotion effects.
Start with what you have.
You don’t need perfect intervention data to begin to better your existing models. For example, binary indicators for whether a promotion is active or if a feature has been launched already greatly improve upon intervention-unaware models.
Turn your forecasts into decision tools.
In the end, it doesn’t matter whether you are simply tracking trends and calling them “forecasting.” The winning organizations will continue to ask “what if” and trust the resulting answer to guide their actions.
References
- Uddandarao, D. P., 2026, "From Prediction to Intervention: Integrating Counterfactual Reasoning into AI Decision-Making." Communications of the ACM Blog.
- Uber Engineering Blog, "Unleashing the Power of Ads Simulation."
- Lim, B., et al., 2021, "Temporal Fusion Transformers for Interpretable Multi-horizon Time Series Forecasting," International Journal of Forecasting, Vol. 37, No. 4, pp.1748-1764.F.
- Kaggle, 2015, Rossmann Store Sales data, https://www.kaggle.com/c/rossmann-store-sales.
Dharmateja Priyadarshi Uddandarao is a data scientist and economic statistician working at the intersection of data science, statistics, economics, and machine learning. He holds a master’s degree in analytics with a specialization in statistical modeling from Northeastern University and a bachelor’s degree in computer science and engineering with a specialization in data science from the National Institute of Technology, Tiruchirappalli. He has served in senior data science and stat roles at big tech giants like Amazon, Capital One, and Aetna. He is a fellow of the Institute of Analytics and of the Royal Statistical Society, an elected member of International Statistical Institute, and he holds the RSS CStat award, ASA’s PStat accreditation. He is also an active community leader, serving as president of the INFORMS Pacific Northwest Chapter, representative of the ASA Puget Sound Chapter, and a member of the board of vice presidents at the Data Management Association.