
March 29, 2023 in Innovative Education
How to Get Away with Murderball
An End-to-End Analytics Case Study to Construct Lineups in Wheelchair Rugby
SHARE: PRINT ARTICLE: https://doi.org/10.1287/orms.2023.02.03
Student engagement and the ability for students to apply their knowledge outside of the classroom are key goals for instructors. Sports is a popular application area used to teach analytics and operations research (O.R.) concepts. Some examples include Markov models in baseball [1, 2], simulation in hockey [3] and integer programming in cycling [4]. It’s also important for students to experience problems that require multiple types of analytics to replicate the open-ended problems they will encounter in the real world. This can be done through case studies, such as a set of cases in airline revenue management [5], or designed throughout an entire course, such as an undergraduate O.R. course that combines machine learning and optimization with practical examples [6].
In our case study, “Moneyball for Murderball: Using Analytics to Construct Lineups in Wheelchair Rugby” [7, 8], students develop an end-to-end analytics solution approach that covers descriptive, predictive and prescriptive analytics for a complex, real-world problem based on the sport of wheelchair rugby (WCR). In addition to being a novel and interesting application area, we also hope our work increases the representation and visibility of Paralympic sports in scholarly activities.
What is Murderball?
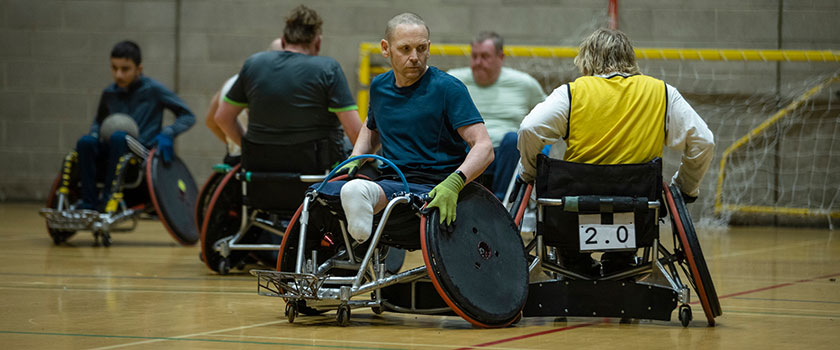
Murderball, officially referred to as wheelchair rugby, is a co-ed sport played on a standard basketball court with a goal line and key area at each end (see Figure 1). The object of the game is to score more goals than the opponent by bringing the volleyball-sized ball across the goal line. Teams are made up of 12 players, with four players allowed on the court at any given time. There are unlimited substitutions, but only during a stoppage in play, which occurs after a goal, foul or time violation. The game is played in four 8-minute quarters, with possible 3-minute overtime periods.

 One of the most unique aspects of the sport is the player classification system, which is based on physical ability. Players are assigned a physical rating between 0.0 and 3.5, in increments of 0.5. The physical rating is determined by the player’s level of mobility, with a lower rating for those with more limited mobility. For example, an athlete rated 0.5 might have extensive weakness in their upper body ranging from arm to trunk function [9]. The purpose of assigning these physical ratings is to restrict which lineups can be played by only allowing the sum of the physical ratings for players on the court for one team to not exceed 8.0 at any given time. This means that lineups such as 3.0-3.0-1.0-1.0 are allowed, but 3.5-3.0-1.0-1.0 are not. Of course, readers may immediately recognize this rule as a knapsack constraint! This knapsack constraint ensures that lineups do not consist of too many athletes with higher mobility, but more importantly, it promotes the participation of all athletes, regardless of their physical ability.
Analytics Modules
In the case, students are provided player and game data and are tasked with generating optimal lineups for the Canadian National WCR team. The game data is arranged into “stints,” which are periods of time without any substitutions or end-of-quarter breaks, meaning the home and away lineups remain constant. For each stint, students have information on which game the stint came from, the home and away teams, stint duration, number of goals scored by each team, and the players on the court.
Through initial exploration of the data in the descriptive analytics module, students are guided to the “plus-minus” metric as a method to value players. Plus-minus is defined as goals scored by their team minus goals allowed by their team when a player is on the court. Students should conclude that this value metric has limitations and does not guarantee an accurate representation of an athlete’s skill, because it doesn’t account for the strengths (or weaknesses) of the other players on the court during a given stint. For example, even if a player is on the court when their team scored many goals, it is difficult to understand the level in which they contributed to these points. This intuition is confirmed when students plot plus-minus values against an athlete’s physical rating, which helps students visualize the significant variation of plus-minus between players within each physical rating group.
Next, in the predictive analytics module, students are presented with a classic “adjusted plus-minus” (APM) model, popularized in basketball analytics, which accounts for the collective strength of the players comprising a given stint via linear regression [10]. In the case of basketball, plus-minus is used as the target variable, and indicator covariates are used to signify which players are on the court for each stint. The coefficients of these player indicators denote the APM values for each athlete (in reference to a set of reference players who are held out of the regression to ensure identifiability). Linear regression models are a good starting point for students because they should be familiar with these models from previous courses and can directly apply them to the WCR data using ordinary least squares. Students may realize that although this is an improvement over the raw plus-minus values, it can be further improved by incorporating more features in the data set, such as considerations for time played and home court advantage effects. When comparing the end result of this section with that of the previous section, students should notice the importance of proper statistical modeling to better capture the value that a player provides to a given lineup.
Finally, in the prescriptive analytics module, students put themselves in the position of the key decision-maker and solve problems from that perspective. To that end, the first question we ask them is: What is the optimal starting lineup in a game? This can be solved via the classic integer knapsack problem, which students should be familiar with at this juncture. However, students should quickly realize that one lineup cannot play the entirety of the game, leading them to consider substitutions. Thus, we move to a more realistic situation in which the head coach has a rough idea of how many total minutes to give each player, and students are asked to create feasible lineups throughout the game to meet these requirements. This problem introduces the concept of dynamically changing lineups and provides a framework for substitutions moving forward. Using these two building blocks, we introduce students to the concept of fatigue, which forces students to think more carefully about substitutions. That is, players on the court will experience diminishing performance as they fatigue. As the problems become more realistic, the models become more complex. From here, curious students may start to interpret the prescriptions and explore different extensions, such as more precise fatigue modeling, interpretations of multiple optimal solutions and modeling trade-offs.
Classroom Experience
This case (or a subset of it) has been delivered on an ongoing basis since the fall 2020 semester. This includes undergraduate analytics, O.R. case-based and business courses throughout the University of Toronto, Concordia University and Ivey Business School at the University of Western Ontario. The case comes with a comprehensive list of 26 questions with solutions, discussion prompts, raw data files and a complete Python notebook with code solutions.
In the analytics course, the case was delivered in a 3-hour lab as an application to topics taught in lecture. Students were given a skeleton of the Python notebook and were guided to fill in the missing code blocks. In the case-based courses, the initial lectures were used to brainstorm solutions as well as introduce more advanced topics. Over the subsequent week or two, students formulated their models, shared their results and discussed improvements, nuances and limitations of the solutions.
Overall, instructors noted that a major strength of this case was the connection between prediction and optimization. There were rich discussions surrounding the realism of the solutions, noting that substitutions potentially every minute of the game would not be realistic, and the presence of multiple optimal solutions and how to handle them. In the analytics course, regression and optimization were more recently taught, which enabled much of the discussion time to focus on more advanced optimization models. In the case-based courses, there were more discussions around interpreting the coefficients from the regression models and questioning the assumptions of the problem, such as plus-minus metrics being averaged over all teams, fatigue curves to better account for rest, more dynamic models to adjust to the game as it progresses, and the sensitivity of the regression outputs that influence the optimization results.
As for student feedback, a post-case survey with 53 student respondents showed:
- 58.5% found it was more interesting than other cases.
- 66.0% found it was more difficult than other cases.
- 81.1% found it helped them identify other applications in which analytics can be applied.
To many students, this case reinforced how the material they learned in class could be applied in the real world in a relatable way, which helped keep their interest when tackling the more complex problems. One student quote captures the sentiment of engagement in the face of difficulty:
“I honestly love analytics and sports, and I loved this case because it helped me explore more about analytics in sports. It was also pretty challenging, which made it very exciting to solve.”
Overall, students expressed how the case would help them with projects in the real world, citing the realistic-sized data set and the culmination of material across courses (statistics, calculus, optimization).
With this case, we hope to create an engaging learning environment that provides students with an opportunity to showcase and explore a variety of analytical techniques. The domain of wheelchair rugby, although new to many, is accessible and compelling, and we hope this case will support the growth of wheelchair rugby and sports analytics applied to Paralympic sports in general.
References & Notes
- E. Bickel, 2004, “Teaching Decision Making with Baseball Examples,” INFORMS Transactions on Education, Vol. 5, No. 1, pp. 2-9, https://pubsonline.informs.org/doi/10.1287/ited.5.1.2.
- Joel S. Sokol, 2004, “An Intuitive Markov Chain Lesson From Baseball,” INFORMS Transactions on Education, Vol. 5, No. 1, pp. 47-55, https://pubsonline.informs.org/doi/10.1287/ited.5.1.47.
- Armann Ingolfsson, 2004, “Simulating NHL Games to Motivate Student Interest in OR/MS,” INFORMS Transactions on Education, Vol. 5, No. 1, pp. 37-46, https://pubsonline.informs.org/doi/10.1287/ited.5.1.37.
- Jeroen Beliën, Dries Goossens, Daam Van Reeth and Liesje De Boeck, 2011, “Using Mixed-Integer Programming to Win a Cycling Game,” INFORMS Transactions on Education, Vol. 11, No. 3, pp. 93-99, https://pubsonline.informs.org/doi/10.1287/ited.1110.0062.
- Robert A. Shumsky, 2009, “Case Article—Introductory Integrative Cases on Airline Revenue Management,” INFORMS Transactions on Education, Vol. 9, No. 3, pp.135-139 https://pubsonline.informs.org/doi/10.1287/ited.1090.0033ca.
- Justin J. Boutilier and Timothy C. Y. Chan, 2021, “Introducing and Integrating Machine Learning in an Operations Research Curriculum: An Application-Driven Course,” INFORMS Transactions on Education, Vol. 23, No. 2, pp. 64-83, https://pubsonline.informs.org/doi/10.1287/ited.2021.0256.
- Timothy C. Y. Chan, Craig Fernandes, Albert Loa and Nathan Sandholtz, 2023, “Case–Moneyball for Murderball: Using Analytics to Construct Lineups in Wheelchair Rugby,” INFORMS Transactions on Education, https://doi.org/10.1287/ited.2023.0282ca.
- World Wheelchair Rugby, “A Guide to Wheelchair Rugby Classification,” https://worldwheelchair.rugby/the-game-classifications/.
- Dan T. Rosenbaum, 2004, “Measuring How NBA Players Help Their Teams Win,” http://www.82games.com/comm30.htm.
Albert Loa is a senior O.R. product developer for the AD OPT team at IBS Software Canada, building products for airline crew planning optimization. In 2022, he completed his Master of Applied Science in operations research at the University of Toronto. Craig Fernandes is a second-year Ph.D. student at the University of Toronto. His research focuses on optimization and machine learning techniques applied primarily to economic and sport decision problems. He recently spent time as a research data scientist at Amazon, focusing on inventory optimization. He is a member of INFORMS. Nathan Sandholtz is an assistant professor in the Department of Statistics at Brigham Young University. His research mostly focuses on inverse optimization, decision analysis and statistics in sports. Previously, he was a postdoctoral fellow at the University of Toronto and a basketball operations analyst with the Sacramento Kings. Timothy C. Y. Chan is the associate vice president and vice provost, strategic initiatives; Canada Research Chair in novel optimization and analytics in health; and professor in the Department of Mechanical & Industrial Engineering at the University of Toronto. His primary research interests are in operations research, optimization and applied machine learning, with applications in healthcare, medicine, sustainability and sports. He is a member of INFORMS.


