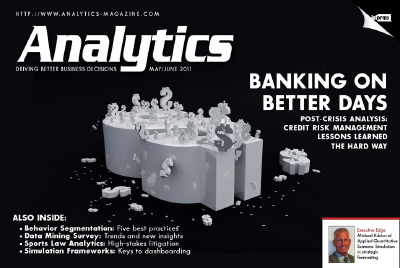
May/June 2011

FEATURED ARTICLES

DIGITAL EDITION

May/June 2011 Analytics

DEPARTMENTS

Inside Story

open book icon
Failure to communicate

When confronted with complex business analytics problems that beg for mathematical modeling, the reactive first response is, “Show me the data.” However, based on one of the recurring themes that came out of the recent INFORMS Conference on Business Analytics & Operations Research held in Chicago, the proper first response is, “Tell me about your business.”

Executive Edge

organization chart icon
Executive briefing on simulation in strategic forecasting

Any strategic forecast is by definition a representation of the future. Understanding that a single estimate of the future is not truly representative, Monte Carlo simulation is a powerful alternative to the “best estimate” forecast. Business leaders are becoming increasingly aware of the deficiencies inherent in traditional forecasting methods. And the past two decades have ushered in an explosion of tools to facilitate novice and expert alike in applying Monte Carlo simulation.

Profit Center

Learning by example

When speaking about analytics, or any other topic for that matter, it’s easy to be drawn into generalities. “Forecasts improve profits.” “Information on past purchases can be used to increase sales.” Generalities are important. They help us navigate environments crowded with details. But details provide important lessons that generalities can’t, helping us learn by example.

Analyze This!

head with ekg line icon
Let’s get this analytics party hopping

In my ongoing quest to figure out what’s going on in the world of analytics, I’ve recently been to the Predictive Analytics World (PAW) conference and the INFORMS Business Analytics and Operations Research conference in Chicago. I have seen dozens of presentations, heard scores of panel discussions and had a million or so conversations. In no particular order, here are some of my impressions.

Newsmakers

newspaper blue
Midwest ISO earns Edelman honors

Moments after Midwest ISO, which manages one of the world’s largest energy markets, won the 2011 Franz Edelman Award for Achievement in Operations Research and the Management Sciences, company CEO and President John Bear was asked how many people comprise his high-end analytics (operations research, i.e. “O.R.”) group.

Corporate Profile

skyscrapers
FedEx presents a “playground” of analytical problems

FedEx falls into the big company category. The recent 2010 FedEx Annual Report shows that the company had $34.7 billion in revenue. More than 280,000 team members provide service to over 220 countries. There are 664 aircraft and more than 80,000 vehicles moving eight million packages a day. All those employees with all those vehicles moving all those packages on a daily basis provide problems that need to be modeled and solved.

Five-Minute Analyst

stopwatch icon
Police vs. smartphone DUI apps

I was struck by something I saw in the news this morning — lawmakers are concerned that so-called “DUI checkpoint apps” for smartphones would help drunk drivers avoid capture and abet them in breaking the law [1]. The story nagged at me all day; it was the sort of issue that I couldn’t let go of. So I decided to ply my trade as an operations researcher and put a nickel’s worth of analysis against the problem [2].

Thinking Analytically

brains and gears
The Traveling Spaceman Problem

When confronted with complex business analytics problems that beg for mathematical modeling, the reactive first response is, “Show me the data.” However, based on one of the recurring themes that came out of the recent INFORMS Conference on Business Analytics & Operations Research held in Chicago, the proper first response is, “Tell me about your business.”

INFORMS site uses cookies to store information on your computer. Some are essential to make our site work; Others help us improve the user experience. By using this site, you consent to the placement of these cookies. Please read our Privacy Statement to learn more.