


Encouraging Eco-driving with Post-trip Visualized Storytelling: An Experiment Combining Eye-Tracking and a Driving Simulator
Abstract
Visualized narratives have been broadly employed to help individuals understand complex environmental issues, increase green awareness, and encourage sustainable behaviors. However, sustainability awareness only sometimes translates to actual green practices. In this study, we develop and test a model that explains how eco-driving behaviors and attitudes toward efficient driving can be promoted with post-trip visualized narratives. Drawing on human-computer interaction research, we integrate the mental construal literature to reveal feasibility and desirability perceptions as underlying mechanisms. We test our hypotheses in two experiments involving eye-tracking and driving simulation. Results show that pairwise animated illustration and prospective narratives elevated eco-driving behaviors and attitudes toward efficient driving. In the meantime, static illustration and retrospective narratives influenced attitudes toward efficient driving. In addition, feasibility and desirability perceptions were significant mediators. Overall, this study contributes to information systems literature, human-computer interaction literature, and the construal level theory by unraveling the effects of post-trip visualized narratives on promoting ecological practices and attitudes.
History: Yulin Fang, Senior Editor; Heshan Sun, Associate Editor.
Funding: This work was supported by the Start-up Grant for New Faculty, City University of Hong Kong [Grant 7200773] and Social Science & Humanities Research (SSHR) 2025 Seed Grant, Nanyang Technological University [Grant 022536-00001].
Supplemental Material: The e-companion is available at https://doi.org/10.1287/isre.2022.0332.
1. Introduction
According to the World Health Organization (WHO) (WHO 2022), air pollution is responsible for millions of deaths each year, and nearly the entire global population is exposed to poor air quality exceeding WHO limits. Air pollution also contributes to global warming and climate change, leading to extreme weather events, increased disease transmission, and rising sea levels (McMichael and Lindgren 2011). Promoting sustainable driving practices has been advocated as a key intervention to reduce air pollution. Whereas traditional sustainability interventions have focused on policy programs and awareness campaigns (e.g., McLaren and Markusson 2020), digital interventions are gaining popularity.
The information systems (IS) literature has primarily examined digital interventions related to personally relevant outcomes (e.g., Li and Choi 2021, Liu et al. 2022, Feng et al. 2023), overlooking their potential for addressing environmental issues. Digital interventions often provide customized visualizations, such as diagnostic charts (e.g., screen time analytics) and personalized recommendations (e.g., number of mutual connections on LinkedIn) (e.g., Son et al. 2020, Li and Choi 2023a, Zhu et al. 2023). Extant studies on the effects of digital interventions have examined situations in which individuals contemplate decisions with apparent associations between their actions and personal consequences (Jiang et al. 2013, Choi and Land 2016, Choi 2020). Similarly, the behavioral economics literature has extensively utilized the nudging perspective to examine the effects of heuristics on individuals’ suboptimal choices (e.g., Thaler and Sunstein 2008, Kahneman 2011). Relatedly, recent digital nudging research has also advanced digital interventions (e.g., activeness reminders) to promote or counter individuals’ intrinsic behavioral tendencies (e.g., Weinmann et al. 2016, Acquisti et al. 2017, Liu et al. 2022).
We contend that extant research examining digital interventions is inadequate to advance the design of visualizations pertinent to environmental issues. Traditionally, digital interventions are situated on the focal individual and focus on providing feedback regarding the individual’s past activities or performance. In this study, we draw upon emerging visualization research to propose a visualized narrative approach incorporating both situated and estimated visualizations to promote environmental practices and attitudes. As discussed below, this approach involves presenting a narrative of visualizations situated on one’s concrete driving experience, which are not common in traditional environmental awareness interventions, and visualizations depicting the future environmental consequences, which are atypical in digital interventions.
Drawing from the visualization literature, this study considers two specific visualization features, that is, association illustration and narrative sequence. Association illustration focuses on the visualization technique through which associations between multiple visualizations can be illustrated. Narrative sequence determines the order through which multiple visualizations can be presented. Association illustration, often through animations, is crucial in capturing attention and facilitating comprehension. In particular, scholars opine that moving or flashing elements induce visual distinctiveness, which is essential for attracting attention to corresponding pairs of visual elements (e.g., Smith and Goodwin 1971). Yet, a stream of evidence suggests that association illustration can disrupt information comprehension (e.g., Hong et al. 2004). Some often-mentioned problems associated with animations include distractions, fatigue, and split attention (e.g., Tan et al. 2015). Apart from association illustration, narrative sequence, such as spatial order (e.g., proximal and distal), granularity (e.g., general to specific and specific to general), and temporal order (e.g., chronological and reverse chronological), has been identified as an essential design feature but lacks a comprehensive understanding of its effects on subsequent behaviors and attitudes (Amini et al. 2015). Furthermore, whereas narrative sequence is typically implemented with other visualization elements, the literature remains muted in providing comprehensive explanations of individuals’ responses when they experience visualized narratives with multiple visual features.
We employ the construal level theory to explain the effects of association illustration and narrative sequence. Broadly speaking, the construal level theory describes the activations of mindsets that guide individuals’ subsequent interpretation of information. It centers on the activations of two types of mindsets: concrete and abstract mindsets. A concrete mindset draws individuals to focus on specific, fine-grained details, whereas an abstract mindset sensitizes individuals toward general, brief overviews. More importantly, the theory posits that concrete mindsets can be activated by proximal cues, which are prompts regarding recent, definitive events. By contrast, abstract mindsets can be activated by distal cues, which indicate distant, probable events. The theory also proposes that congruence between the activated mindset and subsequent information presentation would powerfully sway attitudes and promote behavioral changes. Accordingly, we propose the interaction effects between association illustration and narrative sequence on individuals’ ecological behaviors and attitudes. Additionally, though the mental construal literature has vastly illustrated the importance of congruence and incongruence, it has been observed that congruence may not manifest in the expected behavioral outcomes, that is, individuals with an abstract mindset might not adopt ecological practices, despite comprehending congruent information (Maiella et al. 2020). This inconsistency is often evident in environmental issues in which individuals predominately report favorable attitudes toward ecological practices but demonstrate substantial resistance to enacting those practices. Building on the mental construal literature, we further identify individuals’ feasibility and desirability perceptions as their underlying cognitive processes after viewing the visualized narratives.
We conducted two laboratory experiments using a driving simulator to test our hypotheses and make several contributions. First, we extend data storytelling to illustrate both proximal and distal outcomes in visualized narratives. Second, we refine the understanding of association illustration and narrative sequence in the human-computer interaction (HCI) literature. Third, we advance knowledge of mental construal in visualized narratives and identify the underlying cognitive processes that explain the effects of visualized narratives on eco-driving behaviors and environmental attitudes. Finally, the study enriches the driving behavior literature by demonstrating eco-driving behaviors in multiple manifestations.
The remaining sections of this paper are organized as follows. We first review the related literature and develop our hypotheses. We then describe our research methods to introduce the two experiments and report their results. This paper concludes with result discussions and their implications for research and practice.
2. Related Literature
2.1. Prior Studies on Visualizations
Past HCI studies that have examined visualized narratives serve as the research foundation for this study. Online Appendix A summarizes the key extant studies and how they relate to our research. Our review highlights several shortcomings. First, the benefits of visualizations might not be entirely clear. Although some evidence suggests that visualizations can help maintain individuals’ attention in comprehending information, other findings illustrate some uncertainty. For instance, Kim and Lakshmanan (2021) drew on visual salience research to examine the effects of animated visualizations of time-varying data (e.g., stock prices). They found that visualizations could elevate individuals’ attention to temporal transitions, enhancing their risk sensitivity. Yet, in a study examining information-seeking behaviors, Zhang (2000) found that visualizations might incorporate irrelevant content detrimental to individuals’ information acquisition, hindering their understanding. Our study goes beyond examining individuals’ information comprehension and understanding of visualizations to systematically quantify the behavioral changes induced by visualizations.
Second, past research has examined visualizations for various purposes, such as teaching and learning, risk inference, and group collaborations (e.g., Swaab et al. 2002, De Koning et al. 2011, Kim and Lakshmanan 2021). Generally, these studies suggest that storytelling through visualizations is helpful for individuals to learn about the potential, immediate personal consequences of their decisions. For instance, in the abovementioned study, Kim and Lakshmanan (2021) found that animated line graphs were more effective than static line graphs in facilitating individuals’ risk judgments toward a stock and influencing their investment choices. Although the efficiency of data storytelling in informing individuals about personal and immediate consequences is broadly recognized, some emerging evidence suggests that visualized narratives can be applied beyond individualized and proximal issues. In other words, visualized narratives can potentially explain generalized and distal phenomena. For instance, Jansen et al. (2022) demonstrated the importance of using situated visualizations to educate individuals about the impact of a specific, real-life situation (i.e., a cut tree in the city) on the future environment (i.e., how much carbon dioxide was not captured over a year). Conveying generalized and distal problems is particularly important in promoting environmental conservation. This is because the personal and immediate impact of ecological issues is often negligible, if not immaterial. Consequently, individuals might rationalize future environmental damages as outcomes of collective failures and assume impersonal, indifferent attitudes toward ecological practices. This study employs an experimental procedure that implicitly observes individuals’ actual driving behaviors to construct situated, personalized visualizations as the basis for a visualized narrative conveying the impact of their present driving behaviors on damaging the future, estimated environment.
Lastly, the visualization literature has advanced data presentation for storytelling. Early studies have examined the fundamental elements of visualizations, such as visual complexity, animations, and chart designs (e.g., Hong et al. 2004, Kumar and Benbasat 2004, Nadkarni and Hofmann 2012). Subsequent research has elucidated the outcomes of visualization designs, such as learning and understanding, information acquisition, and recall (e.g., Robertson et al. 2008, Ayres et al. 2009, Lai et al. 2009, De Koning et al. 2011, Cheung et al. 2017). More recent work has focused on understanding advanced visualization techniques, including complex graphing techniques and storytelling (e.g., Boy et al. 2015, Hauff et al. 2016, Metoyer et al. 2018, Walden et al. 2018). More importantly, scholars have begun to synthesize the vast variety of visualization designs to propose design principles for visualized narratives, such as linking elements (i.e., explicit visual relations), transition guidance (i.e., animations), and temporal ordering (i.e., simple chronological and reverse chronological) (e.g., Segel and Heer 2010, Hullman et al. 2013, Ghidini et al. 2017). While emphasizing the prevalence of visualized narratives, past research has rarely examined the effects of storytelling through a collective of visualizations. Furthermore, as illustrated in Online Appendix A, past research examining visualizations has primarily focused on the direct effects of various visualization designs on behaviors. Consequently, our understanding of the joint effects of these features and the underlying mechanisms of visualized narratives on changing behaviors remains largely fragmented. Following the proposed design principles, our study focuses on the independent and joint effects of illustration and narrative features on individuals’ ecological behaviors and attitudes. Our theorization is developed with reference to the construal level theory, which provides conceptual explanations of how visualized narratives prompt individuals to employ various information comprehension techniques. Furthermore, to uncover the underlying mechanisms, we draw on the mental construal literature to focus on individuals’ feasibility and desirability assessment of emission reduction after viewing the visualized narratives.
2.2. Illustration and Narrative Features in Visualizations
Visualizations present data with multiple dimensions using visual elements, such as lines, shapes, and objects, on charts and diagrams (Moere 2008). These visual elements are typically anchored on axes or gridlines to depict value changes relative to scales (Card 1999). To illustrate, line graphs are often utilized to demonstrate how the value of measurement (e.g., accumulated vehicular emission) changes at different points in time. The measured values are plotted along the vertical (i.e., y-axis) and horizontal (i.e., x-axis) dimensions. The y-axis typically shows the measurement value being captured, whereas the x-axis is often used to illustrate chronological information (i.e., time duration). A line connecting those points is drawn to help individuals visualize changes and trends over time.
The visualization literature has broadly demonstrated the effectiveness of multiple visualizations in elucidating complex concepts (i.e., associations between concepts). For instance, Borkin et al. (2013) examined media sites, government reports, and infographics from multiple sources. They found that visualizations facilitated understanding of multiple graphs so that individuals could visually inspect the associations between interconnected concepts. Multiple visualizations have also been utilized to enhance learning in educational settings. For instance, in biology education, Lin and Dwyer (2010) simultaneously employed multiple graphs and charts to elucidate one’s overall well-being, which required a holistic understanding of the dynamic coordination among multiple biological systems.
Contemporary work on visualizations has adopted an exploratory, experience-centric approach to understanding how individuals engage with data on their past behaviors (e.g., Karyda et al. 2020). Recent HCI research has extensively examined post-trip visualizations in understanding driving behaviors. Fairclough and Dobbins (2020), for instance, utilized the heartbeat data of drivers and their driving data to retrospectively construct multiple visualizations that dynamically illustrated the synchronized changes in cardiovascular activities and driving conditions (e.g., elevated frustrations during high-traffic conditions; no frustrations otherwise). Compared with drivers not receiving any post-trip visualizations, drivers receiving visualizations were better able to recall instances of frustration emotions during specific occurrences of traffic jams. More importantly, post-trip visualizations made these drivers aware of the impact of traffic conditions on emotional fluctuations, which helped them understand the causality between traffic conditions and health consequences and adopt anger management strategies.
2.2.1. Association Illustration.
The visualization literature has advanced several techniques on how data can be shown to help viewers understand associations between concepts (e.g., Tory and Moller 2004). One essential technique is to illustrate associations with multiple animated graphs, broadly applied to presenting concurrent changes in various contexts, such as evolving traffic patterns and trending online content. For instance, the renowned Gapminder website utilized a collection of animated line graphs and scatterplots to illustrate the wealth and longevity development associations in various countries from 1800–2018. These animated association illustrations have been widely celebrated for being attractive and easy to understand (Finn 2012). Considering the importance of association illustration, this study considers static illustration and pairwise animated illustration. Static illustration presents associations with stationary visual elements (e.g., a pair of static line graphs depicting two trends of value changes). Static illustration offers a compact and easily discernible representation that facilitates a general understanding of relationships among visualizations (Hutchinson et al. 2010). Indeed, the psychology literature suggests that static forms of visualizations are easy to understand because of our primitive ability in perceptual sense-making, such as association recognition, concurrency mapping, and correlation interpretation (e.g., Carpenter and Shah 1998, Zacks and Tversky 1999). Yet, static illustration is not without shortcomings. A fundamental limitation of static illustration is that associations between visualizations are not dynamically illustrated. Instead, they are depicted using a time-to-space mapping (e.g., the x-axis represents the timeline of changes in a line graph). Although static illustration presents a complete overview of value changes of a single visualization, it is often difficult for individuals to acquire and comprehend detailed information about the associations between visualizations (Vogel et al. 2007).
Pairwise animated illustration utilizes motions to present associations between two visualizations. The objective of pairwise animated illustration is not to depict associations in actual time scale but to enhance individuals’ acquisition and comprehension of associations using synchronized animation steps (Schnotz and Lowe 2008). To illustrate, on a pair of animated line graphs depicting speed changes and carbon emission of a traveling vehicle, the line connecting the first and second data points on the respective visualization (i.e., speed and emission in the first and second minutes) is concurrently presented in the first step. In the second step, the line is extended to connect with the third data point on the respective visualization (i.e., speed and emission in the third minute). The HCI literature has revealed that the way we attend to a digital presentation with motions may differ from how we attend to a static presentation. With static presentations, individuals can vary substantially in attending to the presented visual elements. For instance, in examining line graphs, whereas some individuals might focus on comparing the first and final portions of certain line graphs to understand the differences, others might concentrate on identifying the respective maximum and minimum values. Consequently, with static presentations, individuals largely focus on comprehending correlations between visualizations. Furthermore, past visual attention research explains that endogenous factors, such as contextual knowledge and past viewing experience, can strongly influence how viewers attend to static presentations, and the inherent individual differences result in high variability of attention (e.g., Jiang and Chun 2001). Similarly, with static illustration, endogenous factors dominate attention allocation, and hence viewers may focus on vastly different visual elements.
By contrast, when viewing presentations with motions, viewers’ visual attention often focuses on specific motion visual elements. The elevated emphasis on motioned illustration helps individuals better capture the temporal aspects of visualizations, improving their comprehension of causality. Furthermore, pairwise animated illustration prompts attentional synchrony (Smith and Henderson 2008), that is, less individual variability in attention allocation. In particular, visual elements with motions consistently maintain viewers’ attention and guide their acquisition and comprehension of concurrent changes in visualizations. Kurzhals and Weiskopf (2013), for instance, using an eye-tracking experiment, demonstrated that motions in presentations (e.g., a car moving from one side of the screen to the other) resulted in a high concentration of viewers’ gazes primarily on the car, indicating a strong clustering of visual attention on motion visual elements. Accordingly, with pairwise animated illustration, viewers’ attention is expected to be subliminally regulated by the motions, enhancing their acquisition and comprehension of concurrency in visualizations. Table 1 summarizes the key differences between static illustration and pairwise animated illustration.
|

Table 1. Key Differences Between Static Illustration and Pairwise Animated Illustration
| Corresponding concepts | Concurrency demonstration | Information acquisition techniques | Information comprehension focus |
|---|---|---|---|
| Static illustration | Stationary visual elements, static plots | Relatively heterogeneous, dominated by idiosyncratic factors | Overview of correlations |
| Pairwise animated illustration | Synchronized animation, dynamic plots | Relatively homogeneous, dominated by synchronized motions in visual elements | Temporal details of causalities |
2.2.2. Narrative Sequence.
The visualization literature has begun to explore how data can be told through narrative storytelling, which has also come under the spotlight in recent sustainability research (e.g., Tiefenbeck et al. 2019). Narrative storytelling shows increasing promise for telling data stories on the causes and consequences of environmental issues. Understanding causal relationships regarding sustainability issues often requires detailed comprehension of both the present and future environments, necessitating multiple visualizations. Yet, simultaneous exposure to multiple visualizations might inhibit understanding because individuals can experience split attention, occurring when various visual objects compete for one’s attention (Rosenholtz et al. 2007). As a result, one might not be able to focus on a visual element for complete understanding. Similarly, multiple visualizations are likely to challenge viewers’ visual attention, inhibiting their full grasp of long-term issues. An antidote to split attention is the storytelling technique. Multiple visualizations are not presented simultaneously but conveyed in selected subsets to provide detailed explanations in a predefined and organized narrative (Echeverria et al. 2018). Consequently, visualization designers must carefully consider the relevant visualizations to be presented, and more importantly, decide how to stitch together multiple subsets of visualizations for an understandable visualized narrative.
Although traditional storytelling typically conveys a narrative following its chronological sequence, reverse narrative has also been widely utilized in novels and films (Goh 2008). Considering the importance of storytelling in explaining causality, this study focuses on two sequences of visualization narrative, namely, prospective narrative and retrospective narrative. Prospective narrative tells a data story following its chronological sequence in which events of the narrative are arranged in the natural order of occurrence (i.e., in the order of time). In constructing a prospective narrative, designers often focus on summarizing present situations in initial visualizations, followed by extrapolation of future consequences in subsequent visualizations. By contrast, retrospective narrative, also known as retrograde, tells a data story in reverse chronology (Kim et al. 2017). Viewers are first presented with visualizations depicting future events, followed by a backward narrative to illustrate how future outcomes can be caused by present events. To illustrate, in conducting systematic literature reviews, scholars often construct historiographies to depict the chronological network of citations. Historiography consists of nodes and directional connections. A node represents an article. A directional connection specifies the cited and citing articles in a citation relationship. Collectively, nodes and directional connections facilitate retrospective tracing and prospective tracing of citations (Leydesdorff and Wouters 1999). Whereas retrospective tracing helps understand how a recent article is built upon an earlier article, prospective tracing illustrates how the earlier publication inspires the subsequent work (Lucio-Arias and Leydesdorff 2008). Figure 1 summarizes the key differences between prospective narrative and retrospective narrative.
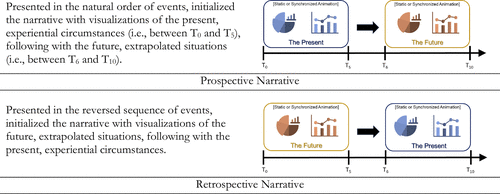
Note. The x axis depicts the two time frames in which each pair of visualizations was concurrently illustrated.
2.3. Construal Level Theory
The construal level theory posits that individuals may form either a concrete or abstract mindset that guides their evaluation of an outcome (Trope and Liberman 2010). According to the theory, individuals’ psychological distance from the event predominately determines the formation of a specific mental construal (Fujita et al. 2006). Early studies examining mental construals have primarily emphasized the importance of temporal distance (i.e., present or distant outcomes) in shaping mental construals (e.g., Schuetz et al. 2020a, Wu et al. 2021). Subsequent research has deliberated the importance of other types of psychological distance, such as physical distance (i.e., local or remote outcomes), social distance (i.e., self-relevant or other-relevant outcomes), and hypothetical distance (i.e., historical or forecasted outcomes) (e.g., Nan 2007, Henderson et al. 2011, Schuetz et al. 2020b). More importantly, the theory postulates that when individuals perceive psychological proximity to an outcome, a concrete mindset is assumed. Resultantly, individuals would be motivated to focus on subordinate and contextualized features that convey the feasibility of the outcome (e.g., the specific ways to complete a task). By contrast, when substantial psychological distance is perceived, individuals’ judgment is likely influenced by abstract mental construals. Individuals would likely be less attentive to comprehending details but focus on superordinate and decontextualized information that conveys the desirability of the outcome (e.g., the general reasons for completing a task). Consistent with construal level theory, with prospective narrative, a data story that commences with a depiction of the present situations is likely to encourage viewers to adopt a concrete mindset and focus on understanding the “how” in the data story. With retrospective narrative, however, viewers are initially presented with illustrations of future consequences, which are likely to stimulate viewers’ abstract mindset and focus on understanding the “why” in the data story.
Furthermore, past research examining mental construal has advanced the importance of congruence (and incongruence) between individuals’ mindsets and information types in changing their opinions and behaviors (e.g., Köhler et al. 2011, Huang et al. 2018). Theorists suggest that activating a mental construal primes individuals’ related concepts in memory, facilitating the processing of relevant information (Dhar and Kim 2007). Accordingly, congruence occurs when individuals are primed with a concrete mindset and subsequently deliberate the procedural details and operational sequences to perform a task. Similarly, congruence can occur when individuals are primed with an abstract mindset and subsequently encounter information about the general rationales for performing the task. More importantly, incongruence occurs when individuals confront information incompatible with an activated mindset. For instance, when individuals assume a distal mindset, they would struggle to comprehend the operational details in performing the task. Likewise, individuals would likely find abstract rationales difficult to grasp when they previously assumed a proximal mindset.
In summary, although narrative storytelling has been broadly applied to illustrate the causes and consequences of environmental issues, there remains a paucity of research on the impact of narrative sequence. Although construal level theory suggests that the initial visualization can likely establish individuals’ corresponding mindsets, how individuals’ mindsets influence their understanding of subsequent information presentation remains largely unknown. Our study thus investigates how different narrative sequences of visualizations can be used with association illustration to promote ecological attitudes and behaviors.
3. Research Model and Hypothesis Development
Following the sustainability literature, to provide comprehensive illustrations of the impact of individuals’ present driving behaviors on the future environment, we constructed three visualizations to illustrate the environmental impact of driving behaviors, namely, the driving route plot, carbon emission chart, and sea-level rise map. The driving route plot (Figure 2(a)) was constructed with a color scheme illustrating individuals’ driving speed changes. The carbon emission chart (Figure 2(b)) presented the estimated amount of carbon emission that individuals had generated based on their driving behavior depicted in the driving route plot. The sea-level rise map (Figure 2(c)) allowed individuals to visualize the association between the future environmental impact (i.e., the amount of land under water) and the amount of carbon emission depicted in the carbon emission chart.
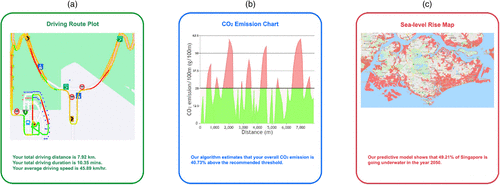
Notes. (a) Driving route plot. (b) Carbon emission chart. (c) Sea-level rise map.
Based on the three visualizations, we investigate the effects of post-trip visualized narratives on promoting eco-driving behaviors. Specifically, we examine two modes of association illustration, that is, static illustration and pairwise animated illustration, to motivate eco-driving behaviors. Additionally, to understand the impact of visualized narrative on eco-driving, this study examines two types of narrative sequences, that is, prospective narrative versus retrospective narrative.
3.1. Eco-driving Behaviors
Eco-driving, also known as green driving and smart driving, is characterized by regulated exhaust gas emissions (Andrieu and Saint Pierre 2012, Li and Choi 2023b). Scholars have predominately considered driving behaviors a major determinant of emissions in vehicular operations. For instance, Bokare and Maurya (2013) analyzed vehicle emissions for passenger cars and found that hard acceleration led to high tailpipe emissions, whereas low emissions were observed with steady speed. Ericsson (2001) utilized onboard sensors to capture vehicle parameters in typical operations and found that higher emissions were associated with higher accelerations and engine revolutions per minute.
As eco-driving practices can be observed through vehicular speed changes, emerging evidence suggests that such a monolithic approach might not be adequate to fully understand driving behaviors. Singh and Kathuria (2021), in particular, proposed that driving behaviors can be examined in categories, such as trip-specific and driver-specific observations. Trip-specific observations, such as speed, distance, and location, are important in evaluating acceleration (e.g., driving smoothness) and deceleration (e.g., braking force) and hence have been commonly utilized to estimate driving behaviors. Driver-specific observations focus on capturing individuals’ attention (e.g., eyes-off-road times and eyes-on-road times) using eye-tracking devices. Accordingly, this study focuses on driving smoothness, braking aggressiveness, and visual attention allocation.
3.1.1. Association Illustration and Eco-driving Behaviors.
We posit that the two modes of association illustration (i.e., static illustration and pairwise animated illustration) would have a differential impact on eco-driving behaviors. Pairwise animated illustration inspires deep understanding and engagement (Taylor 2017). By translating data into motion graphics, pairwise animated illustration amplifies the temporal details of environmental issues, adding weight to the issues and inspiring viewers to take up green practices. Indeed, emerging sustainability research has demonstrated the importance of animated illustration in educating the masses and promoting proenvironmental behaviors (Goodwin et al. 2013). Furthermore, with multiple visualizations, pairwise animated illustration is especially helpful in enhancing viewers’ acquisition and comprehension of associations between fundamental issues. For instance, the Relive app combines jogging or cycling data and digital maps to construct an animation that concurrently illustrates the association between one’s progress in completing an exercise route and the dynamic changes in route elevations (Wheeler 2017). Users often find such paired animations fun, and more importantly, they find it easy to focus on the specific details essential for comprehending the impact of elevations on their exercise performance.
The HCI literature has extensively documented how animated illustration can induce behavioral changes by illustrating causality. The motion visual elements of pairwise animated illustration are visually salient features that can powerfully lead to attentional synchrony, whereby individuals’ attention is subliminally synchronized with the motions (Smith and Henderson 2008). Furthermore, pairwise animated illustration essentially presents a series of scenes that differ from each other temporally. The moment-to-moment unfolding of illustrations draws individuals’ attention in real time, enhancing their comprehension of causality between corresponding data points on a pair of visualizations. It is worth noting that when corresponding portions of two visualizations receive elevated attention, the information in the paired portions can be disproportionately emphasized in subsequent information interpretation (Taylor and Thompson 1982). For example, in interpreting a pair of line graphs, the respective local maxima and minima can become especially salient compared with other nearby data points, increasing individuals’ emphases on fluctuations as diagnostic cues in comprehending visualizations.
Applied to our context, when the environmental impact of individuals’ past driving behaviors is illustrated through pairwise animated illustration, individuals can better focus on the corresponding animated visual elements. A key challenge to simultaneously comprehending a pair of visualizations is cognitive integration, which synthesizes information from the two corresponding sources (Nurgaleeva 2015). The enhanced salience of transitions facilitated through pairwise animated illustration helps individuals establish respective anchors (e.g., synchronized animated visual elements) to acquire and comprehend information from the two visualizations. To illustrate, synchronized plotting of the driving route plot and carbon emission chart helps individuals associate changes in their past driving experience with fluctuations in vehicular emissions. Similarly, synchronized plotting of the carbon emission chart and sea-level rise map exemplifies the associations between varying carbon emissions and aggravating future environmental damages. Consequently, pairwise animated illustration can enhance individuals’ understanding of the causal effects between driving behaviors and environmental impact, leading them to exercise more regulated driving behaviors. Therefore, we propose the following hypothesis:
Compared with static illustration, pairwise animated illustration will promote more eco-driving behaviors.
3.1.2. Interaction Between Association Illustration and Narrative Sequence.
Past mental construal research has utilized the congruence and incongruence notions to elucidate the interplay between individuals’ mental construals and information presentation in influencing their subsequent behaviors. Congruence is the outcome of a match between the presented information and individuals’ mental construals, whereas incongruence occurs when the presented information and activated mindsets are mismatched. Peng et al. (2020) explain that incongruence elevates disfluency in information processing, elicits individuals’ doubts about the information, and is often associated with negative evaluations of the information (Winkielman et al. 2012). By contrast, a congruence between mental construals and information presentations is important to elevating individuals’ confidence about the information and is essential to persuading them to make behavioral changes. Congruence is broadly regarded to enhance processing fluency because individuals’ assumed mindsets activate related concepts in memory, facilitating rapid identification and comprehension of congruent information (Alter and Oppenheimer 2009). In particular, with concrete-specificity congruence, individuals would experience processing fluency as their emphasis on low-level details can be fulfilled by information presentation demonstrating specific details.
In illustrating the environmental impact of individuals’ driving behaviors with multiple visualizations, as mentioned earlier, narrative sequence determines the chronological order in which the data story is presented. In the case of prospective narrative, the data story begins with a visualization depicting individuals’ recent driving behaviors. Therefore, prompted by a proximal driving event, which is easy for individuals to relate to, a concrete mindset would be activated. This concrete mindset will likely elevate individuals’ attention to specific details in understanding the visualized narratives. With pairwise animated illustration, individuals are provided with motion visual anchors (i.e., synchronized animations between two visualizations) to help them understand the specificity of the associations between driving behaviors and environmental damage. More importantly, the elevated visual prominence of specific changes among a pair of visualizations is congruent with individuals’ concrete mindset. The resultant concrete-specificity congruence elevates individuals’ comprehension of the effects of their driving behaviors on future environmental consequences, persuading them to adopt eco-driving to reduce emissions. Static illustration, however, inhibits individuals’ comprehension of changes on multiple visualizations, leading them to focus on the generality in understanding associations. As such, individuals are less likely to experience congruence than incongruence between a concrete mindset activated by prospective narrative and the generality conveyed through static illustration. Moreover, incongruence is likely to make individuals doubtful about the association between their driving behaviors and future environmental consequences, inhibiting them from adopting eco-driving behaviors. In essence, with prospective narrative, pairwise animated illustration constitutes a congruence between concrete mindset and information presentation emphasizing specific details. The concrete-specificity congruence would likely facilitate fluent processing of the complex associations between individuals’ driving behaviors and estimated future environmental impact, enabling them to adopt eco-driving behaviors subsequently.
In the prospective narrative condition, pairwise animated illustration will lead to more eco-driving behaviors than static illustration.
The mental construal literature also demonstrates that with abstract-generality congruence, individuals’ emphasis on high-level understanding can be satisfied by information presentation illustrating broad overviews, hence giving rise to processing fluency. Indeed, past research examining message framing has underscored the importance of fluency involving abstract mindsets and broad information presentation in determining behaviors (e.g., Freling et al. 2014). For instance, White et al. (2011) found that when individuals were primed with a distant-future mindset and presented with high-level messages depicting the desirable benefits of recycling, they would experience elevated fluency in evaluating the messages and become especially willing to use the city recycling program. Similarly, in a study examining sustainability promotions, Ryoo et al. (2017) revealed that presenting generalized messages to consumers with an abstract construal would most effectively promote sustainable mug usage. Overall, the message framing literature demonstrates that abstract-generality congruence is essential for persuasive messages.
Applied to our setting, in the case of retrospective narrative, the data story commences with a depiction of the future environment, likely seen as distal and probabilistic. As a result, individuals would adopt an abstract mindset that prompts them to focus on the general overview of the visualized narratives. Pairwise animated illustration emphasizes the synchronized, detailed changes among multiple visualizations and hence is not likely congruent with individuals’ focus on general understanding. The resultant abstract-specificity incongruence between individuals’ mindset and information presentation would inflate processing disfluency, inhibiting the effects of visualized narratives on promoting subsequent eco-driving behaviors. Furthermore, because retrospective narrative emphasizes reverse chronology and pairwise animated illustration exemplifies cause-and-effect, the visualized narratives could muddle individuals’ comprehension with complex reversed causality. By contrast, static illustration presents narratives without animated visual anchors. Consequently, individuals can better avoid the specific details and focus on acquiring high-level information about the environmental impact of their driving behaviors. The resultant abstract-generality congruence enables individuals to draw on the matching heuristic to rapidly identify with the visualized narrative, increasing processing fluency (Reber et al. 2004). Consequently, individuals are likely to develop a positive evaluation of the visualizations, increasing their likelihood of changing their subsequent driving behaviors to reduce emissions. Thus, we predict the following effect:
In the retrospective narrative condition, pairwise animated illustration will lead to less eco-driving behaviors than static illustration.
4. Experiment 1: Association Illustration and Narrative Sequence
Understanding the environmental consequences of one’s present behaviors can be a formidable task because it often requires one to comprehend a vast amount of information. Thus, using a driving simulator, we focused on how post-trip visualized narratives could encourage subsequent eco-driving practices in experiment 1.
4.1. Experimental Design
A laboratory experiment with a 2 (association illustration, static illustration versus pairwise animated illustration) × 2 (narrative sequence, prospective narrative versus retrospective narrative) between-subjects factorial design was conducted to test Hypotheses 1 and 2. Association illustration in the experiment was manipulated by presenting two pairs of charts (i.e., driving route plot and carbon emission chart, and carbon emission chart and sea-level rise map) with or without synchronized animation. In the static illustration condition, subjects were presented with static, completed charts that depicted the environmental consequences of their simulator driving. In the pairwise animated illustration condition, visualizations with motion visual elements were presented to subjects. The three charts were progressively constructed in pairs (i.e., progressively plotted route, progressively charted emission line, and progressively colored land under water). Narrative sequence was manipulated by varying the presentation sequence of the two pairs of visualizations. Following the general practices in prospective and retrospective narratives, we consider the inherent temporal nature of the two pairs of visualizations (i.e., driving route plot and carbon emission chart, and carbon emission chart and sea-level rise map) in our visualized narratives. Specifically, the combination of the driving route plot and carbon emission chart depicts the effects of subjects’ recent driving behaviors on carbon emission. The combination of the carbon emission chart and sea-level rise map subsumes the estimated impact of emissions on the future environment. Collectively, the two pairs of visualizations illustrate the associations between present and future situations. Accordingly, with prospective narrative, to establish the present cause, subjects were first presented with the driving route plot and carbon emission chart. Subsequently, to illustrate the future consequences, the sea-level rise map was shown with the carbon emission chart collectively. By contrast, retrospective narrative, also known as retrograde, tells a data story in reverse chronology (Kim et al. 2017). With retrospective narrative, to establish the future consequences, subjects were first presented with the sea-level rise map and carbon emission chart. Afterward, to illustrate the present cause, the sea-level rise map was shown with the driving route plot (see Online Appendix B for illustrations of the experimental conditions). Before the main experiment, we conducted three pilot tests to evaluate the experimental procedures and stimulus (see Online Appendix C). Addressing all the issues revealed in the pilot tests, we conducted the main experiment.
Subjects in this experiment were adults with valid driving qualifications and driving experiences. One week before the experiment, they were asked to provide demographic information, driving experience (i.e., license age), and driving frequency and to respond to questions measuring connectedness to nature. Two hundred one subjects, who did not participate in the pilot studies, were recruited from a customer pool of a rental car company.1 The experiment administrator carried out the experiment.2 Subjects were randomly assigned to one of the four experimental conditions (Table 2). They were asked to complete three rounds of driving simulations (i.e., the familiarization drive, the first scenario drive, and the second scenario drive3). The key purpose of the familiarization drive was to get subjects accustomed to the controls (i.e., steering wheel and braking pedal) and stimulation environment.4
|
Table 2. Experimental Conditions
| Subject assignment | Prospective narrative | Retrospective narrative |
|---|---|---|
| Static illustration | 49 | 49 |
| Pairwise animated illustration | 52 | 51 |
Note. Values are numbers of subjects assigned to an experimental condition.
After the familiarization drive, subjects performed the first scenario drive. The key purpose of this drive is to collect data on subjects’ actual driving behaviors to generate visualized narratives specific to their assigned experimental conditions. To help subjects understand the post-trip visualized narratives, before viewing the visualizations, they were provided with detailed descriptions of each visualization, such as how the driving route plot is constructed based on their driving behaviors in the first scenario drive, how the CO2 emission chart is constructed based on the emission rate of a typical vehicle (i.e., a sedan), and how the sea-level rise map is estimated based on a prediction model. Subjects were asked to carefully read the descriptions and take as much time as necessary. They were advised to consult the experiment administrator if they required additional information. Upon completing the descriptions, subjects would initiate the post-trip visualized narratives presented based on their randomly assigned experimental conditions. Afterward, subjects completed the second scenario drive. The purpose of the second scenario drive is to collect data on subjects’ actual driving behaviors after viewing the visualizations. They were then thanked and received their participation compensation (approximately 35 USD (U.S. dollars) car rental credit).
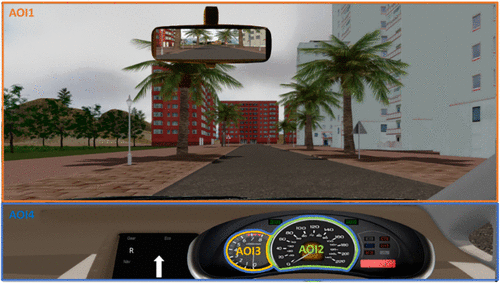
We utilized eye-tracking to facilitate objective measures of subjects’ visual attention during their driving simulation. The literature on driving behaviors has extensively examined drivers’ attentions in two aspects, namely, eyes-on-road and eyes-off-road. Whereas eyes-on-road represents drivers’ attention on the forward road conditions during vehicle operations, eyes-off-road characterizes drivers’ attention diverted away from the road toward the vehicle interior, such as the dashboard, speedometers, and tachometer (e.g., Olsen et al. 2005). More importantly, to systematically quantify the distribution of visual attention, scholars have often defined areas of interest (AOI) to categorize eye fixation and dwell time percentage in specific regions (Blascheck et al. 2017). Accordingly, to capture individuals’ visual attention during the driving simulation, we have created four distinct AOI, namely, the windscreen region (i.e., AOI1), speedometer region (i.e., AOI2), tachometer region (i.e., AOI3), and other regions (i.e., AOI4) (Figure 3).5
4.2. Data Analysis and Results
4.2.1. Subject Demographics.
Among the 201 subjects, 94 were female. The age of the subjects ranged from 25 to 45, with the average driving experience and average driving frequency being 9.01 years of license age and 33.01 times per month, respectively. No significant differences were found among subjects randomly assigned to each of the four experimental conditions concerning age, gender, driving experience, driving frequency, and connectedness to nature,6 indicating that subjects’ demographics were quite homogeneous across different conditions.
4.2.2. Manipulation Check, Measurement, and Construct Validity.
The manipulation check for association illustration was performed by asking subjects four true/false questions on whether the visualization was presented with animation (see Online Appendix D for manipulation check items). All subjects in the static illustration condition answered “false” to the four questions, and all those in the pairwise animated illustration condition answered “true,” suggesting that the manipulation for association illustration was successful. The manipulation check for narrative sequence was conducted by asking subjects four true/false questions on whether the visualization was presented following the order of time or in a reverse chronological order. All subjects answered the questions in accordance with their experimental conditions, leading support to successful manipulation for narrative sequence.
Driving smoothness was computed based on the subjects’ driving patterns in the simulation. Following Chen et al. (2019), we adapted the Symbolic Aggregate Approximation (SAX) method to translate a subject’s simulation driving data (i.e., the recorded speed at every 0.1 seconds) into a single score. A higher score indicates smoother driving behaviors. The details are provided in Online Appendix E. Braking aggressiveness was computed based on subjects’ explicit application of the braking mechanism (i.e., foot pressure on the brake pedal) in the simulation. Deceleration might not require explicit brake application because subjects might employ engine braking. Procedures to compute braking aggressiveness are largely similar to those for computing driving smoothness. A higher score indicates greater braking aggressiveness (see Online Appendix F).
Following the eye-tracking literature (Bera et al. 2019, Ye et al. 2020), to examine visual allocation to various areas of interest, we operationalize visual attention allocation to each AOI regarding fixation count and dwell time percentage. Fixations are the time periods7 during which a subject’s eyes focus on an AOI (Fischer and Ramsperger 1984). Dwell time percentage is the proportion of time a subject fixated on an AOI within a period.
4.2.3. The Effects of Visualized Narratives on Eco-driving Behaviors.
A multivariate analysis of covariance (MANCOVA) was conducted to detect the joint effects of association illustration emphasis and narrative sequence on eco-driving behaviors, with subjects’ driving smoothness in the first scenario drive as the covariate. Because Box’s M test (F = 9.63, p < 0.01) shows that our data do not satisfy the criteria of normality, we focused on Pillai’s Trace in interpreting our MANCOVA results. We observed the significant main effects of association illustration (Pillai’s Trace = 0.25, F = 10.49, p < 0.01) and narrative sequence (Pillai’s Trace = 0.15, F = 5.49, p < 0.01), and the interaction effects between these two variables (Pillai’s Trace = 0.35, F = 16.92, p < 0.01).
Because MANCOVA results revealed an overall significant effect, to test the effects of the independent variables on each outcome (i.e., driving smoothness, braking aggressiveness, fixation count, and dwell time percentage), separate analyses of covariance (ANCOVAs) were conducted. Similar to the normality issue identified above, Shapiro-Wilk tests suggest that the variables used in the analysis significantly depart from normality. Although a lack of normality might not be a major concern for fixed ANCOVA models, substantial skewness in the data requires attention. Our examination of the kurtosis of error distribution revealed that some of our dependent variables (i.e., fixation count and dwell time percentage on AOI2 and AOI3, respectively) suffered from positive skewness. Therefore, we applied the logarithmic transformation on these variables before performing the respective ANCOVAs.
ANCOVA with driving smoothness as the dependent variable reveals the significant effects of association illustration (F(1,196) = 21.84, p < 0.01) and narrative sequence (F(1,196) = 4.48, p < 0.05) (Table 3). Second, results with braking aggressiveness as the dependent variable reveal the significant effects of association illustration (F(1,196) = 5.45, p < 0.05) and narrative sequence (F(1,196) = 5.57, p < 0.05) (Table 4). Furthermore, ANCOVAs on fixation count on AOI2 and AOI3 reveal the significant effects of association illustration (F(1,196) = 25.94, p < 0.01; F(1,196) = 22.60, p < 0.01). The effects of narrative sequence (F(1,196) = 0.93, p = 0.34; F(1,196) = 3.02, p = 0.08) are not significant (Table 5). Lastly, results on dwell time percentage on AOI2 and AOI3 show the significant effects of association illustration (F(1,196) = 25.07, p < 0.01; F(1,196) = 18.65, p < 0.01). The effects of narrative sequence (F(1,196) = 0.11, p = 0.74; F(1,196) = 4.12, p = 0.05) are not significant (Table 6).
|
Table 3. ANCOVA Results on Driving Smoothness
| Source | Type III SS | df | Mean square | F | Sig. |
|---|---|---|---|---|---|
| Intercept | 0.65 | 1 | 0.65 | 62.26 | 0.00 |
| DS1 | 0.06 | 1 | 0.06 | 5.39 | 0.02 |
| AI | 0.23 | 1 | 0.23 | 21.84 | 0.00 |
| NS | 0.05 | 1 | 0.05 | 4.48 | 0.04 |
| AI × NS | 0.41 | 1 | 0.41 | 39.65 | 0.00 |
| Error | 2.03 | 196 | 0.01 | ||
| Total | 90.37 | 201 | |||
| NS = prospective narrative | |||||
| AI | 0.58 | 1 | 0.58 | 43.40 | 0.00 |
| Error | 1.30 | 98 | 0.01 | ||
| Total | 43.91 | 101 | |||
| NS = retrospective narrative | |||||
| AI | 0.02 | 1 | 0.02 | 2.00 | 0.16 |
| Error | 0.73 | 97 | 0.01 | ||
| Total | 46.46 | 100 | |||
Note. Dependent variable, driving smoothness; DS1, driving smoothness in the first scenario drive; AI, association illustration; NS, narrative sequence; SS, sum of squares; Sig, significance.
|
Table 4. ANCOVA Results on Braking Aggressiveness
| Source | Type III SS | df | Mean square | F | Sig. |
|---|---|---|---|---|---|
| Intercept | 0.81 | 1 | 0.81 | 32.77 | 0.00 |
| DS1 | 0.03 | 1 | 0.03 | 1.06 | 0.31 |
| AI | 0.14 | 1 | 0.14 | 5.45 | 0.02 |
| NS | 0.14 | 1 | 0.14 | 5.57 | 0.02 |
| AI × NS | 0.23 | 1 | 0.23 | 9.18 | 0.00 |
| Error | 4.86 | 196 | 0.03 | ||
| Total | 49.62 | 201 | |||
| NS = prospective narrative | |||||
| AI | 0.28 | 1 | 0.28 | 9.71 | 0.00 |
| Error | 2.83 | 98 | 0.03 | ||
| Total | 23.17 | 101 | |||
| NS = retrospective narrative | |||||
| AI | 0.01 | 1 | 0.01 | 0.41 | 0.53 |
| Error | 1.94 | 97 | 0.02 | ||
| Total | 26.46 | 100 | |||
Note. Dependent variable, braking aggressiveness; DS1, driving smoothness in the first scenario drive; AI, association illustration; NS, narrative sequence; SS, sum of squares; Sig, significance.
|
Table 5. ANCOVA Results on Fixation Count
| Source | lg(fixation count on AOI2) | lg(fixation count on AOI3) | ||||||||
|---|---|---|---|---|---|---|---|---|---|---|
| Type III SS | df | Mean square | F | Sig. | Type III SS | df | Mean square | F | Sig. | |
| Intercept | 9.75 | 1 | 9.75 | 71.92 | 0.00 | 6.49 | 1 | 6.49 | 30.36 | 0.00 |
| DS1 | 0.04 | 1 | 0.04 | 0.27 | 0.60 | 0.09 | 1 | 0.09 | 0.41 | 0.52 |
| AI | 3.51 | 1 | 3.51 | 25.94 | 0.00 | 4.84 | 1 | 4.84 | 22.60 | 0.00 |
| NS | 0.13 | 1 | 0.13 | 0.93 | 0.34 | 0.65 | 1 | 0.65 | 3.02 | 0.08 |
| AI × NS | 8.12 | 1 | 8.12 | 59.93 | 0.00 | 18.11 | 1 | 18.11 | 84.69 | 0.00 |
| Error | 26.56 | 196 | 0.14 | 41.92 | 196 | 0.21 | ||||
| Total | 737.47 | 201 | 480.25 | 201 | ||||||
| NS = prospective narrative | ||||||||||
| AI | 10.69 | 1 | 10.69 | 66.72 | 0.00 | 19.72 | 1 | 19.72 | 83.21 | 0.00 |
| Error | 15.71 | 98 | 0.16 | 23.22 | 98 | 0.24 | ||||
| Total | 390.61 | 101 | 272.54 | 101 | ||||||
| NS = retrospective narrative | ||||||||||
| AI | 0.50 | 1 | 0.50 | 4.33 | 0.06 | 1.21 | 1 | 1.21 | 4.45 | 0.05 |
| Error | 10.85 | 97 | 0.11 | 18.70 | 97 | 0.19 | ||||
| Total | 346.85 | 100 | 207.71 | 100 | ||||||
Note. Dependent variables, lg(fixation count on AOI2) and lg(fixation count on AOI3); DS1, driving smoothness in the first scenario drive; AI, association illustration; NS, narrative sequence; SS, sum of squares; Sig, significance.
|
Table 6. ANCOVA Results on Dwell Time Percentage
| Source | lg(dwell time % on AOI2) | lg(dwell time % on AOI3) | ||||||||
|---|---|---|---|---|---|---|---|---|---|---|
| Type III SS | df | Mean square | F | Sig. | Type III SS | df | Mean square | F | Sig. | |
| Intercept | 0.53 | 1 | 0.53 | 3.00 | 0.09 | 0.01 | 1 | 0.01 | 0.04 | 0.84 |
| DS1 | 0.00 | 1 | 0.00 | 0.00 | 0.97 | 0.00 | 1 | 0.00 | 0.00 | 0.95 |
| AI | 4.45 | 1 | 4.45 | 25.07 | 0.00 | 5.33 | 1 | 5.33 | 18.65 | 0.00 |
| NS | 0.02 | 1 | 0.02 | 0.11 | 0.74 | 0.87 | 1 | 0.87 | 4.12 | 0.05 |
| AI × NS | 6.34 | 1 | 6.34 | 35.70 | 0.00 | 23.46 | 1 | 23.46 | 82.06 | 0.00 |
| Error | 34.79 | 196 | 0.18 | 56.04 | 196 | 0.29 | ||||
| Total | 90.00 | 201 | 88.55 | 201 | ||||||
| NS = prospective narrative | ||||||||||
| AI | 9.97 | 1 | 9.97 | 41.97 | 0.00 | 23.93 | 1 | 23.93 | 88.85 | 0.00 |
| Error | 23.28 | 98 | 0.24 | 26.40 | 98 | 0.27 | ||||
| Total | 57.93 | 101 | 55.34 | 101 | ||||||
| NS = retrospective narrative | ||||||||||
| AI | 0.09 | 1 | 0.09 | 0.79 | 0.38 | 1.36 | 1 | 1.36 | 4.83 | 0.05 |
| Error | 11.48 | 97 | 0.12 | 29.59 | 97 | 0.31 | ||||
| Total | 32.07 | 100 | 33.21 | 100 | ||||||
Note. Dependent variables, lg(dwell time percentage on AOI2) and lg(dwell time percentage on AOI3); DS1, driving smoothness in the first scenario drive; AI, association illustration; NS, narrative sequence; SS, sum of squares; Sig, significance.
Collectively, pairwise animated illustration leads to a higher level of driving smoothness and a lower level of braking aggressiveness, as well as a higher fixation count and a higher dwell time percentage on both the speedometer and tachometer than does static illustration. Therefore, Hypothesis 1 is supported.
Because the interaction effects on driving smoothness and braking aggressiveness are significant (F(1,196) = 39.65, p < 0.01; F(1,196) = 9.18, p < 0.01), we further conducted the simple main effect analysis. Results suggest that the effect of association illustration is moderated by narrative sequence. Simple main effect analysis reveals that (1) pairwise animated illustration is associated with significantly higher driving smoothness than static illustration under the prospective narrative condition (F(1,98) = 43.40, p < 0.01) and (2) pairwise animated illustration and static illustration are not different from each other in affecting driving smoothness under the retrospective narrative condition (F(1,97) = 2.00, p = 0.16) (Tables 3 and 7 and Figure 4). Additionally, simple main effect analysis reveals that (1) pairwise animated illustration is associated with significantly lower braking aggressiveness than static illustration under the prospective narrative condition (F(1,98) = 9.71, p < 0.01) and (2) pairwise animated illustration and static illustration are not different from each other in affecting braking aggressiveness under the retrospective narrative condition (F(1,97) = 0.41, p = 0.53) (Tables 4 and 8 and Figure 5).
|
Table 7. Mean Values of Driving Smoothness, Association Illustration × Narrative Sequence (Experiment 1)
| Experimental conditions | PN | RN | Mean |
|---|---|---|---|
| SI | 0.56 | 0.69 | 0.62 |
| PAI | 0.73 | 0.66 | 0.70 |
| Mean | 0.64 | 0.68 |
Note. PN, prospective narrative; RN, retrospective narrative; SI, static illustration; PAI, pairwise animated illustration.

Notes. Covariates appearing in the model are evaluated at the following values: DS1 = 0.61. DS1, driving smoothness in the first scenario drive; NS, narrative sequence; AI, association illustration.
|
Table 8. Mean Values of Braking Aggressiveness, Association Illustration × Narrative Sequence (Experiment 1)
| Experimental conditions | PN | RN | Mean |
|---|---|---|---|
| SI | 0.51 | 0.49 | 0.50 |
| PAI | 0.38 | 0.50 | 0.44 |
| Mean | 0.45 | 0.50 |
Note. PN, prospective narrative; RN, retrospective narrative; SI, static illustration; PAI, pairwise animated illustration.
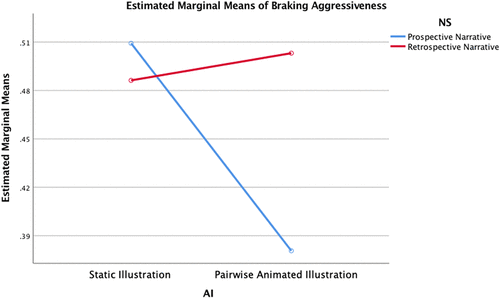
Notes. Covariates appearing in the model are evaluated at the following values: DS1 = 0.61. DS1, driving smoothness in the first scenario drive; NS, narrative sequence; AI, association illustration.
The interaction effects on fixation count on AOI2 and AOI3 (F(1,196) = 59.93, p < 0.01; F(1,196) = 84.69, p < 0.01) are significant, respectively. Results of the simple mean effect analyses suggest that (1) pairwise animated illustration is associated with a significantly higher fixation count on AOI2 and AOI3 (F(1,98) = 66.72, p < 0.01; F(1,98) = 83.21, p < 0.01) than static illustration, respectively, under the prospective narrative condition and (2) pairwise animated illustration and static illustration are not different from each other in affecting fixation count on either AOI2 or AOI3 (F(1,97) = 4.43, p = 0.06; F(1,97) = 4.45, p = 0.05) under the retrospective narrative condition (Tables 5 and 9 and Figure 6).
|
Table 9. Association Illustration × Narrative Sequence
| Experimental conditions | PN | RN | Mean |
|---|---|---|---|
| SI | 59.00 [22.35] | 96.53 [39.53] | 77.77 [30.94] |
| PAI | 192.96 [124.44] | 80.18 [31.04] | 136.57 [77.74] |
| Mean | 125.98 [73.40] | 88.36 [35.29] |
Notes. Mean values of fixation count on AOI3 are reported in square brackets. PN, prospective narrative; RN, retrospective narrative; SI, static illustration; PAI, pairwise animated illustration.
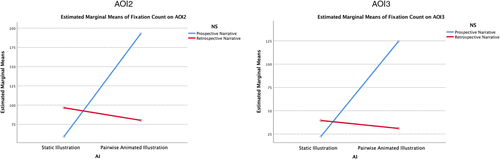
Notes. Covariates appearing in the model are evaluated at the following values: DS1 = 0.61. DS1, driving smoothness in the first scenario drive; NS, narrative sequence; AI, association illustration.
The interaction effects on dwell time percentage on AOI2 and AOI3 are also significant (F(1,196) = 35.70, p < 0.01; F(1,196) = 82.06, p < 0.01). Results of the simple mean effect analyses suggest that (1) pairwise animated illustration is associated with significantly higher dwell time percentage on AOI2 and AOI3 than static illustration under the prospective narrative condition (F(1,98) = 41.97, p < 0.01; F(1,98) = 88.85, p < 0.01) and (2) pairwise animated illustration and static illustration are not different from each other in affecting dwell time percentage on either AOI under the retrospective narrative condition (F(1,97) = 0.79, p = 0.38; F(1,97) = 4.83, p = 0.05) (Tables 6 and 10 and Figure 7).
|
Table 10. Mean Values of Dwell Time Percentage, Association Illustration × Narrative Sequence (Experiment 1)
| Experimental conditions | PN | RN | Mean |
|---|---|---|---|
| SI | 2.45 [0.86] | 3.66 [1.95] | 3.10 [1.41] |
| PAI | 8.13 [6.70] | 3.50 [1.35] | 5.82 [4.03] |
| Mean | 5.29 [3.78] | 3.58 [1.65] |
Note. Mean values of dwell time percentage on AOI3 are reported in square brackets. PN, prospective narrative; RN, retrospective narrative; SI, static illustration; PAI, pairwise animated illustration.
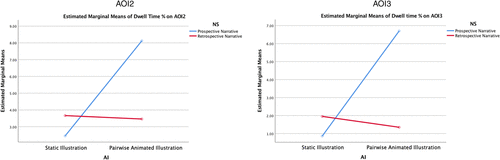
Notes. Covariates appearing in the model are evaluated at the following values: DS1 = 0.61. DS1, driving smoothness in the first scenario drive; NS, narrative sequence; AI, association illustration.
Overall, under the prospective narrative condition, compared with static illustration, pairwise animated illustration leads to a higher level of driving smoothness and a lower level of braking aggressiveness, as well as a higher fixation count and a higher dwell time percentage on the speedometer and tachometer. By contrast, the interaction effects are less pronounced under the retrospective narrative condition. Therefore, Hypothesis 2a is supported, but not Hypothesis 2b.
4.3. Discussion of Experiment 1
Our results mostly supported our hypotheses. First, as we hypothesized earlier, pairwise animated illustration led to more eco-driving behaviors than static illustration. We found that subjects in the pairwise animated illustration condition maintained higher driving smoothness, lower braking aggressiveness, and greater visual attention to the speedometer and tachometer. We also argued that the effects of pairwise animated illustration and prospective narrative would increase eco-driving behaviors. Consistent with our expectation, our results showed that with prospective narrative, pairwise animated illustration indeed increased eco-driving behaviors compared with static illustration. Drawing on abstract-generality congruence, we argue that static illustration and retrospective narrative would increase eco-driving behaviors. Contrary to our expectations, our results showed that with retrospective narrative, there is no significant difference between static and pairwise animated illustration in effect on eco-driving behaviors.
5. Experiment 2: Underlying Mechanisms and Presentation Concurrency
We conducted experiment 2 with several objectives. First, we aim to unravel the underlying mechanisms that explain the effects of visualized narratives on eco-driving behaviors. Recent IS research has increasingly considered feasibility and desirability perceptions to elucidate the impact of mental construals (e.g., Wu et al. 2021, Li and Choi 2023a). In a study examining mobile data service innovation, for instance, Kankanhalli et al. (2015) revealed that concrete and abstract construals were largely assumed by actual and potential user innovators, respectively. More importantly, they found that a concrete construal amplified users’ feasibility emphasis in performing an activity (e.g., the “how” aspect of innovation), whereas an abstract construal elevated their emphasis on desirability (e.g., the “why” aspect of innovation).
Considering the importance of the “how” and “why” in information processing, this study examines individuals’ perceptions of feasibility and desirability after viewing visualized narratives. We define perceived feasibility as the extent to which an individual believes in his or her competence in reducing driving emissions. Individuals’ perception of feasibility is important for determining subsequent behaviors. For instance, in a study examining user evaluation of information systems, Ho et al. (2015) found that users with a concrete construal would predominately rely on their perception of system usage feasibility (i.e., perceived ease of use) in determining their adoption decision. Additionally, we define perceived desirability as the extent to which an individual believes that improving the future environment through reducing driving emissions is attractive to him or her. Individuals assuming an abstract construal would predominately focus on perceptions of desirability in making decisions. Ho et al. (2020), for example, examined the joint evaluation of an e-learning system and found that students would emphasize their desirability perceptions (i.e., perceived usefulness) when they had an abstract construal.
Second, we aim to elucidate the unexpected results that with retrospective narrative, there is no significant difference between static and pairwise animated illustration in effects on eco-driving behaviors. The processing fluency perspective has robustly demonstrated the influence of congruence on individuals’ behaviors. Yet, recent advancement in mental construal suggests that concrete-specificity congruence and abstract-generality congruence might lead individuals to construe an activity differently. On the one hand, concrete-specificity congruence promotes comprehension of low-level details, elevating individuals’ emphasis on their feasibility perception of the activity (e.g., whether emission reduction can be conveniently achieved). On the other hand, in addition to orienting individuals’ focus on high-level details, abstract-generality congruence alerts them to desirability perception (e.g., whether emission reduction is important). More importantly, whereas feasibility and desirability perceptions consistently affect individuals’ attitudes toward an activity, the effects of concrete-specificity congruence and abstract-generality congruence on actual behaviors are less apparent. Some scholars suggest that concrete-specificity congruence can influence actual behaviors but not abstract-generality congruence (e.g., Wiesenfeld et al. 2017). Because concrete-specificity congruence draws individuals’ emphasis on the “how” information, they would become particularly informed on the low-level, operational details essential for enacting new behaviors. By contrast, abstract-generality congruence draws individuals’ attention to the “why” information. Consequently, although individuals would be well versed in the high-level rationales, they might not have adequate “how” information to adopt new behaviors. Therefore, in experiment 2, to provide a holistic understanding of the two types of congruence, in addition to actual eco-driving behaviors, we followed the mental construal literature to consider individuals’ attitudes toward efficient driving, which refer to an individual’s general evaluations regarding efficient driving (Xu and Petty 2022). Specifically, we expected that the joint effects of association illustration and narrative sequence (i.e., concrete-specificity congruence and abstract-generality congruence) on attitudes toward efficient driving were mediated by both perceptions of feasibility (i.e., how) and desirability (i.e., why). Also, we expected that the joint effects on eco-driving behaviors were mediated by perception of feasibility.
Third, to rule out alternative explanations and illustrate further evidence supporting our hypotheses, experiment 2 considered additional control variables and experimental conditions. The sustainability literature suggests that individuals’ ability to comprehend our visualized narratives might be influenced by their existing sustainability knowledge. Experiment 2 formally examined individuals’ ability to understand the connections between driving behaviors, carbon emissions, and future sea-level rise. Furthermore, we incorporated additional procedures to capture individuals’ cognitive burden and causal connection between visualizations, that is, the mapping method. Additionally, because association illustration considered either static illustration or pairwise animated illustration in experiment 1, one might wonder whether the effects of association illustration could be confounded by the specific pairwise sequence. Therefore, in addition to narrative sequence, we independently manipulated the animation and sequence aspects of association illustration: change illustration and presentation concurrency. Change illustration considered whether the visualizations were presented in either the static or animated form, independent from the pairing or simultaneous format. Presentation concurrency considered two conditions, namely, staggered presentation and simultaneous presentation. Whereas the staggered presentation condition (partially examined in experiment 1 as pairwise animated illustration) considers the pairwise presentation of visualizations (e.g., the driving route plot and carbon emission chart are presented together, followed by the carbon emission chart and sea-level rise map), the simultaneous presentation condition considers the concurrent presentation of the driving route plot, carbon emission chart, and sea-level rise map.
Collectively, in experiment 2, we predict that the effects of change illustration and narrative sequence on eco-driving behaviors are mediated by individuals’ feasibility perception. We also posit that feasibility and desirability perceptions simultaneously mediate the effects of change illustration and narrative sequence on individuals’ attitudes toward efficient driving. Furthermore, we expect the respective mediation effects to be stronger with staggered than with simultaneous presentation.
5.1. Experimental Design and Procedure
We conducted a laboratory experiment with a 2 (i.e., change illustration, static illustration versus animated illustration) × 2 (i.e., narrative sequence, prospective sequence versus retrospective sequence) between-subjects factorial design with two presentation concurrency conditions, namely, the staggered presentation and simultaneous presentation conditions. One week before the experiment, subjects completed an online training on the causes and the environmental consequences of air pollution (see Online Appendix G for details).8 After the online training, subjects completed a quiz (i.e., 10 multiple-choice questions) to evaluate their understanding of various causes of carbon pollution (e.g., poor efficiency in fossil-fired power generation, inefficient vehicle operating practices, and poor manure management) and the environmental impacts of carbon pollution (e.g., increase in average annual temperatures; decrease in snow, sea ice, and glacier coverage; rise in sea levels and increase in coastal flooding; and increase in overall precipitation levels) (Online Appendix H). Subjects achieved 9.04 correct answers out of the 10 questions on average, suggesting they have obtained a sound knowledge of the causes and impacts of carbon pollution.
Two hundred eighty-three subjects, who had profiles similar to those in experiment 1, participated in experiment 2. The laboratory procedure of experiment 2 was largely consistent with experiment 1, except for the survey after viewing the visualized narratives and an additional exit task. After viewing the visualized narratives, to measure the mediating variables, subjects were asked to complete a survey measuring perceived feasibility and desirability.9 After completing the second scenario drive, using papers and pens, subjects were asked to create causal maps of the concepts and relations among those concepts they learned from the visualizations. They were also required to provide verbal explanations of their maps. The causal maps and explanations were subsequently provided to two judges who independently categorized each concept into one of the three visualization groups (i.e., driving route related, carbon emission related, and land submersion related) and identified the sequence in which a subject narrated the causal map.10 Differences between the judges were resolved after a follow-up discussion. The judges also rated each subject’s ability to connect the respective concepts.
5.2. Subject Demographics
Among the 283 subjects, 131 were female. The age of the subjects ranged from 31 to 54. No significant differences were found among subjects randomly assigned to each of the four experimental conditions with respect to age, gender, driving experience, driving frequency, connectedness to nature, and general environmental attitudes,11 rendering support to successful randomization.
5.3. Manipulation Check, Measurement, and Construct Validity
In the manipulation checks, subjects provided the answers corresponding to their respective experimental conditions, suggesting that the manipulation for change illustration and narrative sequence was successful. The manipulation check for presentation concurrency was performed by asking subjects three true/false questions on whether the visualization was presented staggered (see Online Appendix D for manipulation check items). All subjects answered the question corresponding to their experiment conditions, hence suggesting that the manipulation for presentation concurrency was successful.
Five items measuring perceived feasibility (Cronbach’s alpha = 0.85) as well as five items measuring perceived desirability (Cronbach’s alpha = 0.82) were adapted from Dabic et al. (2012) and Kiatkawsin and Han (2017), respectively (see Online Appendix D). Five items measuring attitudes toward efficient driving (Cronbach’s alpha = 0.90) were adapted from Bhattacherjee and Premkumar (2004). Exploratory factor analysis shows that, in general, items load well on their intended factors and lightly on the other factor, thus indicating adequate construct validity (Online Appendix I). Driving smoothness, braking aggressiveness, fixations, and dwell time percentage were computed following the approaches discussed in experiment 1. Descriptive statistics and construct correlations are reported in Online Appendix J.12 The mean values for driving smoothness, braking aggressiveness, fixation count, dwell time percentage, and attitudes toward efficient driving are shown in Tables 11, 12, 13, 14, and 15, respectively.
|
Table 11. Mean Values of Driving Smoothness, Change Illustration × Narrative Sequence (Experiment 2)
| Experimental conditions | PN | RN | Mean |
|---|---|---|---|
| SI | 0.51 | 0.57 | 0.54 |
| AI | 0.69 | 0.54 | 0.62 |
| Mean | 0.60 | 0.56 |
Note. PN, prospective narrative; RN, retrospective narrative; SI, static illustration; AI, animated illustration.
|
Table 12. Mean Values of Braking Aggressiveness, Change Illustration × Narrative Sequence (Experiment 2)
| Experimental conditions | PN | RN | Mean |
|---|---|---|---|
| SI | 0.59 | 0.50 | 0.55 |
| AI | 0.37 | 0.55 | 0.46 |
| Mean | 0.48 | 0.53 |
Note. PN, prospective narrative; RN, retrospective narrative; SI, static illustration; AI, animated illustration.
|
Table 13. Mean Values of Fixation Count, Change Illustration × Narrative Sequence (Experiment 2)
| Experimental conditions | PN | RN | Mean |
|---|---|---|---|
| SI | 56.47 [37.49] | 88.83 [68.18] | 72.65 [52.84] |
| AI | 136.90 [108.27] | 71.92 [59.34] | 104.41 [83.81] |
| Mean | 96.69 [72.88] | 80.38 [65.76] |
Notes. Mean values of fixation count on AOI3 are reported in square brackets. PN, prospective narrative; RN, retrospective narrative; SI, static illustration; AI, animated illustration.
|
Table 14. Mean Values of Dwell Time Percentage, Change Illustration × Narrative Sequence (Experiment 2)
| Experimental conditions | PN | RN | Mean |
|---|---|---|---|
| SI | 4.44 [2.17] | 7.02 [4.03] | 5.73 [3.10] |
| AI | 10.39 [7.07] | 5.63 [3.22] | 8.01 [5.15] |
| Mean | 7.42 [4.62] | 6.33 [3.63] |
Notes. Mean values of dwell time percentage on AOI3 are reported in square brackets. PN, prospective narrative; RN, retrospective narrative; SI, static illustration; AI, animated illustration.
|
Table 15. Mean Values of Attitudes Toward Efficient Driving, Change Illustration × Narrative Sequence (Experiment 2)
| Experimental conditions | PN | RN | Mean |
|---|---|---|---|
| SI | 4.60 | 4.91 | 4.76 |
| AI | 5.65 | 4.63 | 5.14 |
| Mean | 5.13 | 4.77 |
Note. PN, prospective narrative; RN, retrospective narrative; SI, static illustration; AI, animated illustration.
5.4. The Effects of Visualized Narratives on Eco-driving Behaviors
A MANCOVA was conducted to detect the joint effects of independent variables on both eco-driving behaviors and attitudes toward efficient driving, with subjects’ driving smoothness in the first scenario drive as the covariate.13 Similar to experiment 1, because Box’s M test (F = 2.14, p < 0.01) shows that our data do not satisfy the normality criteria, we focused on Pillai’s Trace in interpreting our MANCOVA results. We observed the significant main effects of change illustration (Pillai’s Trace = 0.23, F = 11.61, p < 0.01) and narrative sequence (Pillai’s Trace = 0.09, F = 4.01, p < 0.05) and the interaction effects between these two variables (Pillai’s Trace = 0.38, F = 23.32, p < 0.01).
Because MANCOVA results revealed an overall significant effect, to test the effects of the independent variables on each outcome, separate ANCOVAs were conducted (see Online Appendix K). Like experiment 1, to mitigate the normality issue in fixation count and dwell time percentage on AOI2 and AOI3, we applied the logarithmic transformation on these variables before performing the respective ANCOVAs. Our results on the direct effect of visualized narratives on driving smoothness (Figure 8), braking aggressiveness (Figure 9), fixation count (Figure 10), and dwell time percentage (Figure 11) are consistent with those in experiment 1. Additionally, ANCOVA with attitudes toward efficient driving as the dependent variable reveals the significant effects of change illustration (F(1,278) = 21.84, p < 0.01) and narrative sequence (F(1,278) = 18.99, p < 0.01). Simple main effect analysis shows that the effect of change illustration is moderated by narrative sequence. Results suggest that the effect of change illustration on attitudes toward efficient driving is moderated by narrative sequence. Simple main effect analysis reveals that (1) animated illustration is associated with significantly stronger attitudes toward efficient driving than static illustration under the prospective narrative condition (F(1,137) = 9.50, p < 0.01) and (2) static illustration is associated with significantly stronger attitudes toward efficient driving than animated illustration under the retrospective narrative condition (F(1,140) = 5.33, p < 0.05) (Figure 12).
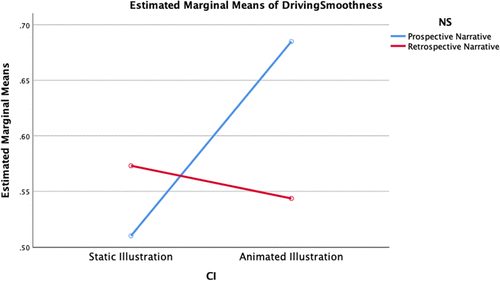
Notes. Covariates appearing in the model are evaluated at the following values: DS1 = 0.53. DS1, driving smoothness in the first scenario drive; NS, narrative sequence; CI, change illustration.
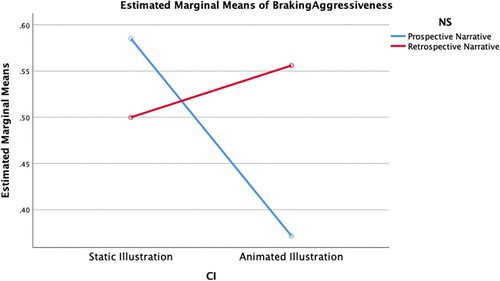
Notes. Covariates appearing in the model are evaluated at the following values: DS1 = 0.53. DS1, driving smoothness in the first scenario drive; NS, narrative sequence; CI, change illustration.
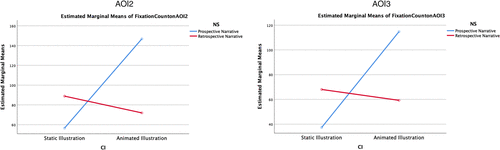
Notes. Covariates appearing in the model are evaluated at the following values: DS1 = 0.53. DS1, driving smoothness in the first scenario drive; NS, narrative sequence; CI, change illustration.
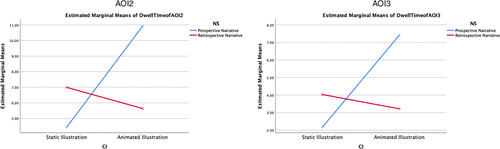
Notes. Covariates appearing in the model are evaluated at the following values: DS1 = 0.53. DS1, driving smoothness in the first scenario drive; NS, narrative sequence; CI, change illustration.
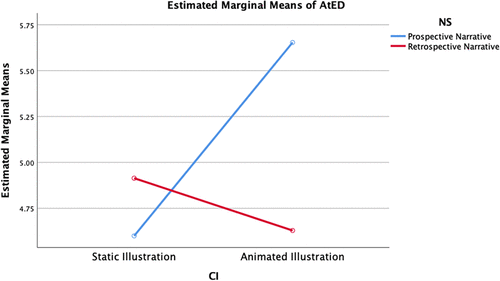
Notes. AtED, attitudes toward efficient driving. Covariates appearing in the model are evaluated at the following values: DS1 = 0.53. DS1, driving smoothness in the first scenario drive; NS, narrative sequence; CI, change illustration.
5.5. The Mediating Effects of Feasibility and Desirability
We argue that the effects of post-trip visualizations on eco-driving behaviors are mediated by perceptions of feasibility and desirability. To test the mediation effects, we utilized the procedure proposed by Preacher and Hayes (2004). Results suggest that the effects of the independent variables on the mediating variables are significant when the change illustration and narrative sequence are congruent (i.e., concrete-specificity congruence and abstract-generality congruence) (see Online Appendix L). Furthermore, whereas perceived feasibility significantly mediates the effects of change illustration and narrative sequence on eco-driving behaviors and attitudes toward efficient driving, perceived desirability only significantly mediates the effects of change illustration and narrative sequence on attitudes toward efficient driving (Online Appendix L).
Additionally, we conducted multigroup mediation tests to investigate the potential effects of presentation concurrency (see Online Appendix M). Results show that compared with staggered presentation, the mediation effects of feasibility on driving smoothness and braking aggressiveness become nonsignificant with simultaneous presentation. Furthermore, the mediation effects of feasibility on fixation count, dwell time percentage, and attitudes toward efficient driving, as well as the mediation effect of desirability on attitudes toward efficient driving, are weaker with simultaneous presentation.
5.6. Additional Analyses
We have performed an array of additional analyses, namely, causal map analysis, intersection-based analyses, and scan-path analyses (see Online Appendices N to R for details). Results of the additional analyses are consistent with our main findings.14
5.7. Discussion of Experiment 2
The results of experiment 2 provide evidence for feasibility and desirability perceptions being the underlying cognitive processes that mediate the effects of visualized narratives on eco-driving behaviors and attitudes toward efficient driving. We also replicate experiment 1 in illustrating how change illustration and narrative sequence lead to concrete-specificity congruence and abstract-generality congruence, which determine individuals’ behaviors and attitudes. Furthermore, experiment 2 demonstrates the importance of staggered presentation in visualized narratives. Compared with concurrent presentation, change illustration and narrative sequence with staggered presentation can better facilitate individuals’ information comprehension, encouraging ecological behaviors and attitudes.
6. Limitations and Future Directions
We admit that this study has some limitations. First, this study examines individuals’ eco-driving practices after viewing visualized narratives on the environmental impact of their prior driving behaviors. Our results might not be generalized to other proenvironmental behaviors. For example, some green purchases (e.g., choosing an alternative power provider) might only require individuals to make one-off transactional decisions instead of being confronted with repeated choices (e.g., maintaining eco-driving behaviors over multiple intersections). In such scenarios, with limited decisions made in past consumption, the effects of post-trip visualized narratives might manifest differently.
Second, our contributions may also be limited by using a driving simulation environment. This study utilized a simulation environment broadly employed in prior driving behavior research. Although extensive customizations have been performed to ensure natural driving behaviors, the simulation environment may not completely resemble the bodily experience in actual driving (e.g., physical vibrations and motions). Indeed, Denjean et al. (2012) noted that acoustic feedback (i.e., noises from the engine, wind, and tire-road interaction) was an essential source of information for drivers. Similarly, in practicing eco-driving, drivers may rely on subtle changes in engine noise to understand the engine performance while maintaining visual attention on the road.
This study focuses on understanding the driving behaviors of typical drivers. Professional drivers may have vastly different driving experiences and possess additional skills in operating vehicles and responding to impromptu traffic conditions. Relatedly, past research examining feedback designs has extensively demonstrated the importance of visually apparent feedback (e.g., red color to indicate danger) and timely feedback (e.g., in-cab speed warning). We recommend that future studies consider other visual design principles and conduct field experiments with transport companies where visualizations of drivers’ carbon footprint and associated environmental damages can be provided at various time intervals.
It is also worth noting that our findings are obtained in the laboratory. Similar to previous laboratory studies (e.g., Choi et al. 2015, 2018), although our experimental procedures and empirical strategies would have reduced the impact of individual factors (i.e., driving habit, environmental awareness), readers should be aware that human irrationality can remain in play. Also, to ensure subjects’ meaningful comprehension of our visualized narratives, our experiments employed a short online training and an online quiz to establish and access subjects’ environmental knowledge. Despite our extensive safeguards (i.e., ensuring anonymity and privacy, minimizing interactions with subjects, and statistically controlling for social desirability), subjects might still be influenced by some biases (e.g., acquiescence and hypothesis guessing). Therefore, researchers should be careful when our findings are interpreted with different procedures.
7. Implications for Research
This paper makes several important contributions to the literature. First, we contribute to the IS literature by extending the scope of data storytelling to an emerging domain in which storytelling conveys both proximal outcomes and distal consequences in visualized narratives. Following early studies on visual illustrations and narrative sequences, visualization researchers have begun recommending various design principles to advance data storytelling techniques. Drawing from this body of knowledge, some behavioral intervention studies have examined the persuasiveness of visualization design principles (e.g., Shneiderman et al. 2013, Ko and Chang 2017) to modify individuals’ existing behaviors. However, these studies focus on immediate and personal consequences of behavioral changes. In environmental issues, the instrumentality of individuals’ behavioral changes to future environmental conditions can be somewhat inapparent. Consequently, extant understanding of storytelling techniques may not be entirely applicable to designing compelling visualized narratives to promote ecological awareness and practices. We are among the first, to the best of our knowledge, to extend the visualization literature to sustainability contexts by elucidating the effects of situated, personalized data storytelling on individuals’ ecological attitudes and behaviors.
Second, we enrich the HCI literature for visualized narratives by examining two specific features of data storytelling: association illustration and narrative sequence. Extant HCI work has broadly examined the designs of elementary graphical representations, charting techniques, animations, and dashboard constructions (e.g., Li and Choi 2021, 2023b; Zhu et al. 2023). Although the literature has substantially advanced visualization techniques, extant works have rarely provided an account of how specific visualization features can facilitate information acquisition and comprehension. To this end, our study systematically investigates the effects of association illustration and narrative sequence on driving behaviors. More importantly, our findings on the effects of association illustration more clearly demonstrate how pairwise animated illustration affects individuals’ understanding of data storytelling involving multiple visualizations. We find that pairwise animated illustration is particularly useful in augmenting individuals’ inference of associations among multiple pairs of simultaneous visualizations. Our findings can serve as a basis for future studies in complex visualized narratives, especially when multiple visualizations are presented pairwise.
The other visualization feature that we have examined is narrative sequence. Storytelling proponents have increasingly advocated the importance of narrative structures in constructing compelling visualizations. Despite the robust recognition, there is a paucity of theory-driven research examining the differential effects of various narrative structures on individuals’ understanding. Our theorization of narrative sequence offers conceptual explanations for the fundamentally different information comprehension strategies that can be invoked by prospective narrative and retrospective narrative, respectively. Our experiments consistently show that prospective narrative encourages individuals to assume a concrete mindset and focus on deliberating actionable information, whereas retrospective narrative promotes individuals to assume an abstract mindset and emphasize developing a general understanding. Such findings contribute to the HCI literature by demonstrating how narrative sequence can help activate a specific mindset, and to the construal level theory by showing how a particular visualization feature can influence mental construal psychology.
Third, we advance the understanding of mental construal in visualized narratives. The extant visualization studies often focus on the main effects of either association illustration or narrative sequence. However, with data storytelling (i.e., visualized narratives), these visualization features are increasingly employed in unison. Drawing on the construal level theory, we offer that prospective narrative would drive individuals to assume a concrete mindset, whereas retrospective narrative would prompt individuals to adopt an abstract mindset. In the former, individuals would become especially sensitized to specific details in information acquisition and comprehension. Consequently, when the visualized narrative is illustrated with animations, individuals would experience concrete-specificity congruence, affecting their attitudes toward eco-friendly practices. In the latter, individuals would be sensitized toward general overviews in information acquisition and comprehension. As a result, when the visualized narrative is presented with static illustration, individuals would undergo abstract-generality congruence, which in turn affects their attitudes toward ecological behaviors. To our knowledge, we are among the first to formally employ the mental construal perspective to theorize the joint effects of association illustration and narrative sequence on individuals’ environmental attitudes.
Fourth, we identify the mediating mechanisms that formally illustrate individuals’ psychological responses to visualized narratives. Drawing on the mental construal literature, we argue that individuals would simultaneously evaluate the feasibility and desirability of adopting eco-driving practices after viewing visualized narratives. More importantly, this study illustrates the differential effects of feasibility and desirability perceptions on individuals’ attitudes and behaviors. We establish that although both perceptions are important determinants of attitudes, only feasibility can determine actual behaviors. Adding to our findings on feasibility and desirability, we also present new insights into the respective impact of concrete-specificity congruence and abstract-generality congruence on feasibility and desirability evaluations. We show that concrete-specificity congruence promotes individuals’ acquisition of the “how” information, but abstract-generality congruence draws individuals’ attention to acquiring the “why” information. By applying the theoretical perspectives of concrete-specificity and abstract-generality congruence, we discover the differential effects of feasibility and desirability perceptions on environmental attitudes and eco-driving behaviors and inform the mental construal literature by highlighting that individuals’ perceptions of feasibility and desirability should be considered when designing visualized narratives.
Finally, this study enriches the driving behavior literature by identifying and demonstrating eco-driving behaviors in multiple manifestations. It is noteworthy that past research has mainly focused on driving smoothness, or other quantifications of vehicular speed increase, as the only operationalization of eco-driving behaviors. To this end, we provide fresh insights by demonstrating three attributes of driving behaviors, namely, driving smoothness, braking aggressiveness, and attention allocation. As illustrated in the results, visualizations effectively improve driving smoothness, alleviate braking aggressiveness, and optimize drivers’ attention to speed monitoring. Our findings complement past sustainability research examining proenvironmental practices through eco-driving behaviors and, more importantly, contribute to the driving behavior literature by showing that eco-driving behaviors should not be treated as a monolithic concept.
8. Implications for Practice
This work makes important contributions to practice. Our study reveals a powerful way to promote eco-driving behaviors through visualized narratives illustrating individuals’ present behaviors in relation to future environmental consequences. Specifically, we found that animated illustration helped individuals focus on the motion visual elements and enhance their associations between driving behaviors and changes in the future environment. Hence, we recommend that intervention specialists consider incorporating multiple visualizations in designing digital behavior change programs with animated visual elements to enhance individuals’ comprehension of future consequences of their present behaviors. The effect of pairwise animated illustration on behavior can likely be extended beyond the sustainability contexts, into settings with negligible future personal implications, such as charitable behaviors and voluntarism.
We also reveal the interaction effects between association illustration and narrative sequence on eco-driving behaviors. Prospective narrative amplifies the impact of pairwise animated illustration, whereas the difference between animated and static illustrations is less pronounced with retrospective narrative. Our finding underlines the importance of establishing a personal, relatable context in animated narratives. A common misconception is that pairwise animated illustration will always improve understanding. To this end, we suggest that designers optimize their visualized narratives by considering the temporal nature of the visualized outcomes. In illustrating future consequences, animations should only be considered with prospective narratives. However, in cases of exhibiting past events, designers can focus on sharpening static narrative in either prospective or retrospective sequences.
9. Conclusion
Using a driving-simulator experiment, this study examines the effects of post-trip visualized narratives on promoting ecological behaviors and attitudes. Our results show that animated illustration increases eco-driving behaviors and improves attitudes toward efficient driving compared with static illustration. We also show the impact of the interactions between association illustration and narrative sequence on eco-driving behaviors and attitudes toward efficient driving. Furthermore, we reveal that the effects of post-trip visualized narratives on eco-driving behaviors are mediated by feasibility perception whereas the effects of visualized narratives on attitudes toward efficient driving are mediated by feasibility and desirability perceptions. This study provides theoretical explanations for the underlying mechanics of behavioral changes through visualizations and proposes actionable recommendations for practice.
The authors thank the senior editor, associate editor, and anonymous reviewers for their valuable comments and suggestions.
1 The company is a major local car rental operator. Recruitment was facilitated by broadcasting a message to its members that contained a study registration link.
2 Following the established practices in past IS studies, we employed multiple measures to minimize social desirability: (1) subjects were assured of autonomy, privacy, and confidentiality throughout the experiment, and (2) the experiment was conducted by a research assistant who was not aware of the research questions and hypotheses. The research assistant was trained to interact with subjects only when necessary, and (3) the experiment was conducted in a controlled environment in which subjects remained alone in the driving-simulator room while the research assistant managed the experiment by monitoring subjects behind a one-way mirror. Communications between subjects and the research assistant were facilitated through intercom devices.
3 Eye-tracking calibration was performed with the standard nine-point fixation test before each driving simulation. Each of the two scenario drives commenced with a similar narrative that asked subjects to imagine a daily commute scenario to two different destinations (i.e., workplace and a popular downtown location); each drive was performed on a designated route in which the traffic condition was controlled.
4 The entire driving simulation environment was customized to reflect local traffic conditions (i.e., car license plates, signboards, and traffic rules).
5 Eco-driving demands explicit efforts in maintaining stable speed and performing gradual accelerations and decelerations. Because the speedometer provided feedback about the vehicle traveling speed, we expected subjects to pay visual attention to the speedometer for speed regulations. The tachometer presented feedback about the engine’s workload, which was essential for executing gradual accelerations and decelerations (e.g., engine braking). Therefore, we expected subjects to pay visual attention to the tachometer for gradual accelerations and decelerations.
6 To measure connectedness to nature, we employed the measurement items from Mayer and Frantz (2004).
7 Following Wedel and Pieters (2008), we identified instances of fixations where subjects’ eyes remained relatively still for 200 to 500 milliseconds.
8 Subjects were asked to provide demographic information, driving experience (i.e., license age), and driving frequency, and to respond to questions measuring connectedness to nature, social desirability bias, and general environmental attitudes.
9 In the survey, to measure social desirability bias, we included the measurement items from the Marlowe-Crowne scale (Reynolds 1982).
10 The categorization exercise was performed following the general card-sorting procedures. Specifically, the judges were provided with four groups, that is, driving route related, carbon emission related, land submersion related, and others, and asked to classify elements of the causal maps (e.g., subjects’ drawings) and segments (e.g., sentences) of the transcribed verbal explanations accordingly. Accordingly, the number of drawing elements/explanation segments classified under a group was an indication of the subject’s understanding of the corresponding concept.
11 To measure general environmental attitudes, we employed the measurement items from Milfont and Duckitt (2010).
12 Construct corrections suggest that social desirability correlated weakly with perceived feasibility, perceived desirability, eco-driving behaviors, and attitudes toward efficient driving, suggesting desirability bias is not likely a concern.
13 Additional analyses with viewing duration, replay counts (with animated illustration only), and general environmental attitudes as additional covariates revealed consistent results in both MANCOVA and ANCOVAs.
14 To explore whether certain visualizations are essential to promoting eco-driving behaviors and attitudes, in a supplementary study, we conducted a 2 (i.e., 2 modes of change illustration) × 2 (i.e., 2 types of narrative sequences) × 3 (i.e., paired visualizations, driving route plot and carbon emission chart versus carbon emission chart and sea-level rise map versus driving route plot and sea-level rise map) between-subjects experiment. Results of the supplementary study show that staggered presentation of the three visualizations with animated illustration in the prospective narrative sequence promotes the strongest eco-driving behaviors. Furthermore, drawing on the results of the supplementary study, we demonstrated the importance of the driving route plot, in combination with either the carbon emission chart or the sea-level rise map, in promoting eco-driving behaviors.
References
- (2017) Nudges for privacy and security: Understanding and assisting users’ choices online. ACM Comput. Surv. 50(3):1–41.Crossref, Google Scholar
- (2009) Uniting the tribes of fluency to form a metacognitive nation. Personality Soc. Psych. Rev. 13(3):219–235.Crossref, Google Scholar
- (2015) Understanding data videos: Looking at narrative visualization through the cinematography lens. Proc. 33rd Annual ACM Conf. Human Factors Comput. Systems (Association for Computing Machinery, New York), 1459–1468.Google Scholar
- (2012) Comparing effects of eco-driving training and simple advices on driving behavior. Procedia Soc. Behav. Sci. 54:211–220.Crossref, Google Scholar
- (2009) Learning hand manipulative tasks: When instructional animations are superior to equivalent static representations. Comput. Human Behav. 25(2):348–353.Crossref, Google Scholar
- (2019) Using eye tracking to expose cognitive processes in understanding conceptual models. MIS Quart. 43(4):1105–1126.Crossref, Google Scholar
- (2004) Understanding changes in belief and attitude toward information technology usage: A theoretical model and longitudinal test. MIS Quart. 28(2):229–254.Crossref, Google Scholar
- (2017) Visual comparison of eye movement patterns. Comput. Graph. Forum 36(3):87–97.Crossref, Google Scholar
- (2013) Study of effect of speed, acceleration and deceleration of small petrol car on its tail pipe emission. Internat. J. Traffic Transport Engrg. 3(4):465–478.Crossref, Google Scholar
- (2013) What makes a visualization memorable? IEEE Trans. Vis. Comput. Graph. 19(12):2306–2315.Crossref, Google Scholar
- (2015) Storytelling in information visualizations: Does it engage users to explore data? Proc. 33rd Annual ACM Conf. Human Factors Comput. Systems (Association for Computing Machinery, New York), 1449–1458.Google Scholar
- (1999) Readings in Information Visualization: Using Vision to Think (Morgan Kaufmann, Burlington, MA).Google Scholar
- (1998) A model of the perceptual and conceptual processes in graph comprehension. J. Experiment. Psych. Appl. 4(2):75–100.Crossref, Google Scholar
- (2019) A graphical modeling method for individual driving behavior and its application in driving safety analysis using GPS data. Transportation Res. F Traffic Psych. Behav. 63:118–134.Crossref, Google Scholar
- (2017) Effects of animation on attentional resources of online consumers. J. Assoc. Inform. Systems 18(8):605–632.Google Scholar
- (2020) Social comparisons in sustaining exercise intensity. 24th Pacific Asia Conf. Inform. Systems (Association for Information Systems, Atlanta).Google Scholar
- (2016) The effects of general privacy concerns and transactional privacy concerns on Facebook apps usage. Inform. Management 53(7):868–877.Crossref, Google Scholar
- (2015) Embarrassing exposures in online social networks: An integrated perspective of privacy invasion and relationship bonding. Inform. Systems Res. 26(4):675–694.Link, Google Scholar
- (2018) Love at first sight: The interplay between privacy dispositions and privacy tradeoff in online social connectivity management. J. Assoc. Inform. Systems 19(3):124–151.Google Scholar
- (2012) Exploring gender differences in attitudes of university students toward entrepreneurship: An international survey. Internat. J. Gend. Entrep. 4(3):316–336.Crossref, Google Scholar
- (2011) Attention cueing in an instructional animation: The role of presentation speed. Comput. Human Behav. 27(1):41–45.Crossref, Google Scholar
- (2012) How does interior car noise alter driver’s perception of motion? Multisensory integration in speed perception. Proc. Acoustics 2012 Nantes Conf., 1063–1068.Google Scholar
- (2007) Seeing the forest or the trees: Implications of construal level theory for consumer choice. J. Consumer Psych. 17(2):96–100.Crossref, Google Scholar
- (2018) Driving data storytelling from learning design. Proc. 8th Internat. Conf. Learn. Anal. Knowledge (ACM, New York), 131–140.Google Scholar
- (2001) Independent driving pattern factors and their influence on fuel-use and exhaust emission factors. Transportation Res. D Transportation Environ. 6(5):325–345.Crossref, Google Scholar
- (2020) Personal informatics and negative emotions during commuter driving: Effects of data visualization on cardiovascular reactivity & mood. Internat. J. Human Comput. Stud. 144:1–13.Crossref, Google Scholar
- (2023) Avoiding the diffusion of responsibility in social networking groups: A field experiment on responses to online help-request referrals. J. Assoc. Inform. Systems 24(2):430–451.Google Scholar
- (2012) Making data beautiful: The most inspiring new art is visualized information. Wall Street Journal (April 6), https://www.wsj.com/articles/SB10001424052702303299604577323743008395060.Google Scholar
- (1984) Human express saccades: Extremely short reaction times of goal directed eye movements. Experiment. Brain Res. 57(1):191–195.Crossref, Google Scholar
- (2014) When not to accentuate the positive: Re-examining valence effects in attribute framing. Organ. Behav. Human Decision Processes 124(2):95–109.Crossref, Google Scholar
- (2006) Construal levels and self-control. J. Personality Soc. Psych. 90(3):351–367.Crossref, Google Scholar
- (2017) Analyzing design strategies for narrative visualization. Proc. XVI Brazilian Sympos. Human Factors Comput. Systems (ACM, New York), 1–10.Google Scholar
- (2008) Myths of reversal: Backward narratives, normative schizophrenia and the culture of causal agnosticism. Soc. Semiotics 18(1):61–77.Crossref, Google Scholar
- (2013) Creative user-centered visualization design for energy analysts and modelers. IEEE Trans. Vis. Comput. Graph. 19(12):2516–2525.Crossref, Google Scholar
- (2016) Breaking the ice of low financial involvement: Does narrative information format from a trusted sender increase savings in mutual funds? Internat. J. Bank Marketing 34(2):151–170.Crossref, Google Scholar
- (2011) Construal level theory and spatial distance. Soc. Psych. 42(3):165–173.Crossref, Google Scholar
- (2015) Choice decision of e-learning system: Implications from construal level theory. Inform. Management 52(2):160–169.Crossref, Google Scholar
- (2020) Separate vs. joint evaluation: The roles of evaluation mode and construal level in technology adoption. MIS Quart. 44(2):725–746.Crossref, Google Scholar
- (2004) Does animation attract online users’ attention? The effects of flash on information search performance and perceptions. Inform. Systems Res. 15(1):60–86.Link, Google Scholar
- (2018) Helpfulness of online review content: The moderating effects of temporal and social cues. J. Assoc. Inform. Systems 19(6):503–522.Google Scholar
- (2013) A deeper understanding of sequence in narrative visualization. IEEE Trans. Vis. Comput. Graph. 19(12):2406–2415.Crossref, Google Scholar
- (2010) Heuristics and biases in data-based decision making: Effects of experience, training, and graphical data displays. J. Marketing Res. 47(4):627–642.Crossref, Google Scholar
- (2022) Envisioning situated visualizations of environmental footprints in an urban environment. VIS4Good – Visualization Soc. Good Workshop, 1–5.Google Scholar
- (2001) Selective attention modulates implicit learning. Quart. J. Experiment. Psych. Sect. A 54(4):1105–1124.Crossref, Google Scholar
- (2013) Privacy concerns and privacy-protective behavior in synchronous online social interactions. Inform. Systems Res. 24(3):579–595.Link, Google Scholar
- (2011) Thinking, Fast and Slow (Farrar, Straus and Giroux, New York).Google Scholar
- (2015) Comparing potential and actual innovators. MIS Quart. 39(3):667–682.Crossref, Google Scholar
- (2020) Imagining data-objects for reflective self-tracking. Proc. 2020 CHI Conf. Human Factors Comput. Systems (ACM, NewYork), 1–12.Google Scholar
- (2017) Young travelers’ intention to behave pro-environmentally: Merging the value-belief-norm theory and the expectancy theory. Tour. Management 59:76–88.Crossref, Google Scholar
- (2021) Do animated line graphs increase risk inferences? J. Marketing Res. 58(3):595–613.Crossref, Google Scholar
- (2017) Visualizing nonlinear narratives with story curves. IEEE Trans. Vis. Comput. Graph. 24(1):595–604.Crossref, Google Scholar
- (2017) Interactive visualization of healthcare data using tableau. Healthc. Inform. Res. 23(4):349–354.Crossref, Google Scholar
- (2011) Consumer acceptance of recommendations by interactive decision aids: The joint role of temporal distance and concrete vs. abstract communications. J. Management Inform. Systems 27(4):231–260.Crossref, Google Scholar
- (2004) The effect of relationship encoding, task type, and complexity on information representation: An empirical evaluation of 2D and 3D line graphs. MIS Quart. 28(2):255–281.Crossref, Google Scholar
- (2013) Space-time visual analytics of eye-tracking data for dynamic stimuli. IEEE Trans. Vis. Comput. Graph. 19(12):2129–2138.Crossref, Google Scholar
- (2009) The effects of moving animation on recall, hedonic and utilitarian perceptions, and attitude. IEEE Trans. Engrg. Management 56(3):468–477.Crossref, Google Scholar
- (1999) Between texts and contexts: Advances in theories of citation? (A rejoinder). Scientometrics 44(2):169–182.Crossref, Google Scholar
- (2021) Demystifying relative evaluation in social fitness apps. 42nd Internat. Conf. Inform. Systems (Association for Information Systems, Atlanta).Google Scholar
- (2023a) Debunking sustainability excuses with instrumentality and expectancy visualizations: A physiological perspective. Proc. 44th Internat. Conf. Inform. Systems (Association for Information Systems, Atlanta).Google Scholar
- (2023b) Unlocking sustainability with visualizations: Driving the driven through the whys and hows. 44th Internat. Conf. Inform. Systems (Association for Information Systems, Atlanta).Google Scholar
- (2010) The effect of static and animated visualization: A perspective of instructional effectiveness and efficiency. Ed. Tech. Res. Developmental Psych. 58(2):155–174.Crossref, Google Scholar
- (2022) Pushing yourself harder: The effects of touch modes on users’ self-regulation. Inform. Systems Res. 34(3):996–1016.Link, Google Scholar
- (2008) Main-path analysis and path-dependent transitions in HistCite™-based historiograms. J. Amer. Soc. Inform. Sci. Tech. 59(12):1948–1962.Crossref, Google Scholar
- (2020) The psychological distance and climate change: A systematic review on the mitigation and adaptation behaviors. Front. Psych. 11:1–14.Google Scholar
- (2004) The connectedness to nature scale: A measure of individuals’ feeling in community with nature. J. Environ. Psych. 24(4):503–515.Crossref, Google Scholar
- (2020) The co-evolution of technological promises, modelling, policies and climate change targets. Nat. Clim. Chang. 10(5):392–397.Crossref, Google Scholar
- (2011) Climate change: Present and future risks to health, and necessary responses. J. Intern. Med. 270(5):401–413.Crossref, Google Scholar
- (2018) Coupling story to visualization: Using textual analysis as a bridge between data and interpretation. 23rd Internat. Conf. Intelligent User Interfaces (ACM, New York), 503–507.Google Scholar
- (2010) The environmental attitudes inventory: A valid and reliable measure to assess the structure of environmental attitudes. J. Environ. Psych. 30(1):80–94.Crossref, Google Scholar
- (2008) Beyond the tyranny of the pixel: Exploring the physicality of information visualization. 2008 12th Internat. Conf. Inform. Visualization (IEEE, Piscataway, NJ), 469–474.Google Scholar
- (2012) Why do people use Facebook? Personality Individual Differences 252(3):243–249.Crossref, Google Scholar
- (2007) Social distance, framing, and judgment: A construal level perspective. Human Comm. Res. 33(4):489–514.Crossref, Google Scholar
- (2015) Cognitive integration as the dynamic aspect of modern educational practices. Procedia Soc. Behav. Sci. 166:446–450.Crossref, Google Scholar
- (2005) Eye glance behavior during lane changes and straight-ahead driving. Transportation Res. Record 1937(1):44–50.Crossref, Google Scholar
- (2020) More than words in medical question-and-answer sites: A content-context congruence perspective. Inform. Systems Res. 31(3):913–928.Link, Google Scholar
- (2004) SPSS and SAS procedures for estimating indirect effects in simple mediation models. Behav. Res. Methods Instrum. Comput. 36(4):717–731.Crossref, Google Scholar
- (2004) Processing fluency and aesthetic pleasure: Is beauty in the perceiver’s processing experience? Personality Soc. Psych. Rev. 8(4):364–382.Crossref, Google Scholar
- (1982) Development of reliable and valid short forms of the Marlowe‐Crowne Social Desirability Scale. J. Clin. Psych. 38(1):119–125.Crossref, Google Scholar
- (2008) Effectiveness of animation in trend visualization. IEEE Trans. Vis. Comput. Graph. 14(6):1325–1332.Crossref, Google Scholar
- (2007) Measuring visual clutter. J. Vis. 7(2):1–17.Crossref, Google Scholar
- (2017) The effect of descriptive norms and construal level on consumers’ sustainable behaviors. J. Advert. 46(4):536–549.Crossref, Google Scholar
- (2008)
A unified view of learning from animated and static graphics . Lowe R, Schnotz W, eds. Learning with Animation: Research Implications for Design (Cambridge University Press, Cambridge, UK), 304–356.Google Scholar - (2020a) Improving the design of information security messages by leveraging the effects of temporal distance and argument nature. J. Assoc. Inform. Systems 22(5):1376–1428.Google Scholar
- (2020b) The effectiveness of abstract vs. concrete fear appeals in information security. J. Management Inform. Systems 37(3):723–757.Crossref, Google Scholar
- (2010) Narrative visualization: Telling stories with data. IEEE Trans. Vis. Comput. Graph. 16(6):1139–1148.Crossref, Google Scholar
- (2013) Improving healthcare with interactive visualization. Computer 46(5):58–66.Crossref, Google Scholar
- (2021) Analyzing driver behavior under naturalistic driving conditions: A review. Accid. Anal. Prev. 150:11–17.Crossref, Google Scholar
- (1971) Blink coding for information display. Human Factors 13(3):283–290.Crossref, Google Scholar
- (2008) Attentional synchrony in static and dynamic scenes. J. Vis. 8(6):773.Crossref, Google Scholar
- (2020) A data analytics framework for smart asthma management based on remote health information systems with Bluetooth-enabled personal inhalers. MIS Quart. 44(1):285–303.Crossref, Google Scholar
- (2002) Multiparty negotiation support: The role of visualization’s influence on the development of shared mental models. J. Management Inform. Systems 19(1):129–150.Crossref, Google Scholar
- (2015) Research note—Deliberation without attention: The latent benefits of distracting website features for online purchase decisions. Inform. Systems Res. 26(2):437–455.Link, Google Scholar
- (2017) Artistic data visualization and assessment in art education. Vis. Arts Res. 43(1):59–75.Crossref, Google Scholar
- (1982) Stalking the elusive “vividness” effect. Psych. Rev. 89(2):155–181.Crossref, Google Scholar
- (2008) Nudge: Improving Decisions about Health, Wealth, and Happiness (Yale University Press, New Haven, CT).Google Scholar
- (2019) Real-time feedback promotes energy conservation in the absence of volunteer selection bias and monetary incentives. Nat. Energy 4(1):35–41.Crossref, Google Scholar
- (2004) Rethinking visualization: A high-level taxonomy. IEEE Sympos. Inform. Visualization (IEEE, Piscataway, NJ), 151–158.Google Scholar
- (2010) Construal-level theory of psychological distance. Psych. Rev. 117(2):440–463.Crossref, Google Scholar
- (2007) Supplantation of mental operations on graphs. Comput. Ed. 49(4):1287–1298.Crossref, Google Scholar
- (2018) Neural correlates of multidimensional visualizations: An fMRI comparison of bubble and three-dimensional surface graphs using evolutionary theory. MIS Quart. 42(4):1097–1116.Crossref, Google Scholar
- (2008)
A review of eye-tracking research in marketing . Malhotra NK, ed. Review of Marketing Research, vol. 4 (Emerald Group Publishing Limited, Leeds, UK), 123–147.Crossref, Google Scholar - (2016) Digital nudging. Bus. Inform. Systems Engrg. 58(6):433–436.Crossref, Google Scholar
- (2017) Relive outdoor adventures with a new app and Esri maps. https://www.esri.com/about/newsroom/arcwatch/relive-outdoor-adventures-with-a-new-app-and-esri-maps/.Google Scholar
- (2011) It’s the mind-set that matters: The role of construal level and message framing in influencing consumer efficacy and conservation behaviors. J. Marketing Res. 48(3):472–485.Crossref, Google Scholar
WHO (2022) Billions of people still breathe unhealthy air: New WHO data. WHO, Geneva. https://www.who.int/news/item/04-04-2022-billions-of-people-still-breathe-unhealthy-air-new-who-data.Google Scholar- (2017) Construal level theory in organizational research. Annu. Rev. Organ. Psych. Organ. Behav. 4:367–400.Crossref, Google Scholar
- (2012)
Fluency of consistency: When thoughts fit nicely and flow smoothly . Gawronski B, Strack F, eds. Cognitive Consistency: A Fundamental Principle in Social Cognition (The Guilford Press, New York), 89–111.Google Scholar - (2021) Coupons or free shipping? Effects of price promotion strategies on online review ratings. Inform. Systems Res. 32(2):633–652.Link, Google Scholar
- (2022) Two-sided messages promote openness for a variety of deeply entrenched attitudes. Pers. Soc. Psych. Bull., published ahead of print October 10, 10.1177/01461672221128113.Crossref, Google Scholar
- (2020) Developing and testing a theoretical path model of web page impression formation and its consequence. Inform. Systems Res. 31(3):929–949.Link, Google Scholar
- (1999) Bars and lines: A study of graphic communication. Mem. Cognit. 27(6):1073–1079.Crossref, Google Scholar
- (2000) The effects of animation on information seeking performance on the World Wide Web: Securing attention or interfering with primary tasks. J. Assoc. Inform. Systems 1(1):1–28.Google Scholar
- (2023) Outwitting Shakespeare: Unpacking the mechanics of immersive storytelling with physiological measurements. Proc. 44th Internat. Conf. Inform. Systems (Association for Information Systems, Atlanta).Google Scholar

