


Management Practices and Resilience to Shocks: Evidence from COVID-19
Abstract
We use the spread of COVID-19 in Italy, the first Western country hit by the pandemic, to investigate the role of structured management practices in responding to a large shock. We exploit a survey eliciting expected sales growth for 2020 to set up a difference-in-difference analysis with repeated cross sections, leveraging the fact that the data collection began prior to the pandemic and continued throughout its spread. We find a sizable effect of such practices on firm performance: a one-standard-deviation increase in the management score increases expected sales growth by 2.3%, against an average drop of 8.3%. Results are confirmed with actual sales growth. Firms with more structured practices were more likely to implement a comprehensive set of changes, including a more intense use of remote work.
This paper was accepted by Alfonso Gambardella, business strategy.
Funding: This project has received funding from the European Research Council (ERC) under the European Union’s Horizon 2020 research and innovation programme [Grant agreement 835201].
Supplemental Material: The online appendix and data files are available at https://doi.org/10.1287/mnsc.2021.01341.
1. Introduction
A large body of evidence indicates that structured management practices (SMPs), broadly defined as a set of management practices based on formalized procedures to set targets, monitor outcomes, and incentivize employees, are an important determinant of firm performance. Cross-country studies such as Bloom and Van Reenen (2007) suggest that SMPs explain up to a third of the cross-country differences in firm productivity. Within-country studies based on randomized control trials show that SMPs have a causal effect on performance (Bloom et al. 2013, Bruhn et al. 2018). Based on this evidence, the emergent consensus is that building up SMPs can boost firm performance (Bloom et al. 2016, Giorcelli 2019, Schivardi and Schmitz 2020).
Whereas the relationship between SMPs and performance is well established for “business as usual,” little is known about whether such practices can also be useful for adapting to a rapidly changing environment. SMPs are primary “operational capabilities” designed to govern the firm’s day-to-day operations (Helfat and Martin 2015). As such, they are not primarily designed to sense opportunities and threats, and to successfully address them (Teece 2007). At the same time, organizational practices centered around monitoring, targets, and incentives might provide firms with timely tools and information useful to do so. Surprisingly, the effects of SMPs on firms’ adaptive capacity are still poorly understood, arguably because of the empirical challenges involved in addressing this question.
We exploit an ideal setting to study the effects of SMPs in the face of a large shock: the spread of the COVID-19 pandemic in Italy. Italy was the first Western country to be affected by the pandemic, whose effects on the economic environment could neither be known nor be anticipated by Italian firms. This was in contrast to the subsequent spread of the pandemic in other industrialized countries, where the Italian experience served as a precedent.1 The virus spread from the end of February 2020 with a speed and virulence that were completely unexpected. The Italian government responded via a bundle of measures that included widespread social distancing and school closures from March 8, and a country-wide lockdown from March 22 to the beginning of May, consisting of the shutting down of plants producing any goods or services except the ones on the list of essential activities.2 Firms in Italy thus had to adapt to a completely new and dramatically different environment within a very short period of time.
We study the role of management practices in the response of Italian firms to the COVID-19 shock using extremely rich information from surveys conducted by the Bank of Italy through the evolution of the pandemic. Our primary data source is the 2020 INVIND survey, conducted annually since 1984 and representative of firms with at least 20 employees. The 2020 vintage of the INVIND survey includes a module on SMPs based on the Management and Organizational Practice Survey (MOPS) used by Bloom et al. (2019). The INVIND MOPS module explicitly refers to practices in place in 2019, that is, before the spread of the pandemic, and we use this to construct a standardized management score. Our key outcome of interest is the firm’s expected sales growth: expectations have the advantage of being highly reactive to changes in the economic environment. The survey was conducted between February and May of 2020, which allows us to track how expectations change week by week across the evolution of the pandemic. We leverage this feature to construct our identification strategy.
Figure 1 illustrates our key result. We plot the evolution of the average expected sales growth in 2020 by the week of response separately for firms with management scores above and below the mean. Before the announcement of the lockdown, which can be seen as the “normal” period, there is no visible difference in expected sales growth between the two groups.3 As the pandemic spread, firms’ expectations about sales growth quickly deteriorated. However, this decline was not uniform: rather, firms with high SMPs reported substantially lower declines in expected sales.
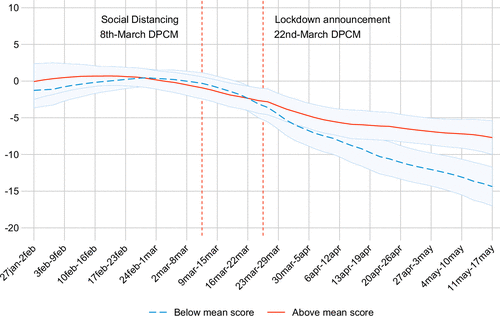
Notes. The y-axis of the graph shows smoothed values of mean YoY expected sales growth for 2020 from the INVIND survey across weeks reported on the x-axis for firms in two groups: those with a management score above the mean, and those with one below. The outcome variable is calculated through kernel-weighted local polynomial regressions of YoY expected sales growth on the week of response for firms. The bands shown are 95% confidence intervals, and the vertical lines correspond to the announcement dates of widespread social-distancing restrictions in Italy (March 8th) and country-wide lockdown (March 22nd). A detailed description of the management score is in the text and Online Appendix B.
This graphical evidence is fully confirmed in a regression setting, where we estimate the relationship between expected sales growth and the management score separately for firms that answered the survey before the lockdown announcement (for brevity, “pre-lockdown”), and after it (“post-lockdown”). Post-lockdown, SMPs are associated with lower expected sales drops: in our preferred specification, one standard deviation increase in the management score increases expected sales growth by 2.3%, more than one quarter the average drop (8.3%). The effect is twice as large as the one estimated for the pre–lockdown period and the coefficients are statistically different from each other. This indicates that SMPs turned out to be a particularly useful asset in tackling a large shock. We use the richness of our data to corroborate this result by addressing various empirical concerns, such as by using realized sales growth from the 2021 vintage of the INVIND survey, and flexibly controlling for firm characteristics to take into account potential correlated effects.
During the lockdowns, firms resorted to remote work to different degrees. We posit that remote work may be easier to implement for firms with SMPs: when managers cannot track the input of workers through direct monitoring, output-based incentives may work better. This is easier when the firm has in place practices to set goals, measure outcomes, and reward employees accordingly. Our analysis confirms this: the management score is positively and significantly associated with increases in the share of employees engaged in remote work in 2020, controlling for the corresponding share in 2019.
Our results on the effects of SMPs during the COVID-19 crisis contribute to different strands of literature. We show that SMPs helped firms to adapt to a large, unforeseen shock, suggesting that they can also contribute to a firm’s dynamic capabilities, contrary to the prevailing view in the literature (Teece 2007). Our findings also complement the burgeoning literature on SMEs performance and dynamic capabilities during the COVID-19 pandemic (Clampit et al. 2022, Dyduch et al. 2021, Rashid and Ratten 2021).
Our paper also contributes to the literature on management and firm performance (Bloom and Van Reenen 2007b; Bloom et al. 2012, 2013; Bruhn et al. 2018; Bender et al. 2018; Schivardi and Schmitz 2020). We focus on the role of SMPs in responding to large shocks. The body of recent work on the role of firm organization in responding to large shocks demonstrates that we cannot naively extrapolate our knowledge of normal times.4 The scant evidence on the role of management practices in responding to large shocks, based on the Great Recession, is inconclusive. Cette et al. (2020) find results that are in line with ours, with cross-country evidence that SMPs were associated with firm resilience and lower declines in productivity in the period following the Global Financial Crisis. Englmaier et al. (2020) find that flexible management styles dominated structured management for firm performance during 2007–2009 in Spain. Direct comparisons are limited by differences in the nature of the shock: while the Great Recession was essentially demand-driven, and might have entailed limited scope for reorganization to tackle it, the COVID-19 crisis started out as supply-driven, as firms were facing strong restrictions on the way they could operate, as well as disruptions in the supply chain. SMPs might have proven particularly useful to address the need for reorganization that emerged during the pandemic.5
We also contribute to the literature on personnel economics, which has shown that structured human resource practices positively affect firm productivity (Ichniowski et al. 1997, Lazear and Oyer 2012). The abrupt, large-scale shift to remote work that many companies undertook during the pandemic presented new challenges for the organization of work. The few studies available, typically based on detailed data from one organization, find contrasting effects on productivity, possibly depending on the need for coordination and communication of the specific firm activity (Emanuel and Harrington 2023, Gibbs et al. 2021). Using survey data from employees of a large international corporation, Flassak et al. (2023) show that remote work involves increased standardization of procedures and greater autonomy to compensate for the reduced possibility of direct supervision. Consistent with these results, we provide evidence from a representative sample of firms that monitoring and incentives practices were particularly useful in shifting to remote work.
The rest of the paper is organized as follows. Section 2 describes the data sources and presents summary statistics of the variables used in our analysis. In Section 3, we describe our empirical strategy and discuss identification challenges. Section 4 documents our results on the role of SMPs for firm performance pre- and post-lockdown, along with robustness results. In Section 5, we examine the higher take-up of remote work following the lockdown by firms with higher SMPs. In Section 6, we conclude.
2. Data
The Bank of Italy administered three firm surveys during 2020 that we use to analyze the response of firms to COVID-19: the INVIND survey, with expectations about sales growth and a management practices module; the ISECO survey, to measure the impact of COVID-19 restrictions on firms; and the SONDTEL survey, on remote work. In addition, we use the INVIND 2021 survey, from which we construct realized sales growth in 2020 over 2019. This section describes each of our data sources, the construction of our key variables, and the summary statistics of the baseline sample.
2.1. The INVIND Survey
The INVIND survey is the annual business survey conducted by the Bank of Italy since the early 1980s.6 It collects high-quality data on firms and is regularly used in research (see, among others, Guiso and Parigi 1999, Pozzi and Schivardi 2016, Rodano et al. 2016). The survey is administered to approximately 5,000 firms and is a representative sample of manufacturing and services firms with at least 20 employees.7 It is conducted directly by the regional branches of the Bank of Italy, and the data collected are used for the official statistics and the econometric models of the Bank of Italy, ensuring high quality of the responses.
Among other things, the INVIND survey collects firm expectations about various outcomes, such as sales, investment, and employment. The survey has been collecting expectations since the early 1990s, and such questions have been extensively used in previous research, which finds that they track actual performance well.8 We use expectations of sales growth in 2020 as our preferred performance measure because—as we argue more rigorously when discussing our empirical strategy in Section 3—expectations are very reactive to changes in the economic environment, a feature crucial to our identification strategy. We also expand our set of results using realized sales from the INVIND 2021 survey. We focus on sales because they depend on the extent to which the firm was subject to the exogenous COVID-19 shock and on the firm’s capacity to contain its effects, whereas other variables, such as employment or investment, are more directly under the control of the firm, and therefore can be viewed as more a measure of the firm’s decisions rather than of its performance.9
The second key ingredient of our analysis is the degree of adoption of SMPs by firms. We obtain this from a module of eight questions included in the INVIND survey of 2020. The design of the module is based on the specialized survey instrument used in Bloom et al. (2019), developed and administered by the U.S. Census Bureau.10 Crucially for us, the questions explicitly refer to the practices that already existed in the organization in 2019, that is, strictly before the pandemic. They, therefore, represent the stock of practices the firm was already endowed with when it was hit by the pandemic.11 Finding an effect of practices would indicate that it is extant monitoring and incentive practices that matter to tackle the pandemic shock, rather than changes thereof. This would then imply that operational capabilities are beneficial not only in “business as usual” conditions but also, and perhaps particularly, when adapting to an abrupt shift in environmental circumstances (Helfat and Martin 2015).
The survey investigates the use of SMPs along three dimensions: monitoring, targets, and incentives. The monitoring questions ask firms about the collection and use of information, such as key performance indicators (KPI henceforth), to monitor and improve the production process. The targets questions ask about the design and dissemination of production targets, and the incentives questions ask about bonuses, promotions, and reassignment and dismissal practices, and how closely these are linked to employee and team performance.
To retain comparability with previous work, we closely follow Bloom et al. (2019) in the construction of a management score from the survey responses. We restrict our sample to firms with complete responses to the management module, which we define as answering at least five of the eight questions. We construct an aggregate management score for a firm as follows. Each question is first scored on a 0–1 scale (low scores indicating lower use of SMPs). The scores for individual questions are then aggregated by taking the average of the question-wise scores. Next, we standardize this aggregate measure across firms, which transforms the measure to have mean zero and unit standard deviation. This is the score we will use in our analysis. Similarly, we create standardized subscores on monitoring, targets, and incentives for each respondent using specific questions in the MOPS module. Online Appendix B reproduces the original module included in the INVIND 2020 survey, along with the question-wise scoring scheme. The MOPS survey instrument has been used to assess the use of SMPs in diverse settings and can be considered fairly standardized.12
Panel A of Table 1 reports summary statistics for the 1,808 firms in the baseline sample used in our analysis, which is defined as all firms responding to INVIND 2020 with complete responses to the management module. Firms are larger than the average Italian firm (in 2019, the INVIND mean number of employees is 483 against 4 for the overall firm population, and average sales are 164 million Euros), because INVIND does not survey firms with fewer than 20 employees. Three-quarters of the firms reported positive profits in 2019, about two-thirds of the firms are exporters, and about two-thirds are in manufacturing.
|

Table 1. Summary Statistics: INVIND and SONDTEL Surveys
| Mean | Std. deviation | 5th percentile | Median | 95th percentile | |
|---|---|---|---|---|---|
| Panel A. INVIND | |||||
| Management score (2019) | 0.00 | 1.00 | −1.93 | 0.09 | 1.49 |
| Employees (2019) | 483.43 | 3,566.25 | 22.00 | 79.00 | 1,186.00 |
| 0.66 | 0.47 | 0.00 | 1.00 | 1.00 | |
| 0.74 | 0.44 | 0.00 | 1.00 | 1.00 | |
| Sales (2019, million EUR) | 163.99 | 1,191.38 | 2.20 | 20.21 | 448.65 |
| YoY sales growth (2018–2019) | 2.50 | 18.36 | −21.14 | 1.23 | 28.03 |
| Expected YoY sales growth, 2020 | −4.48 | 17.04 | −38.43 | 0.00 | 16.20 |
| Sales (2020, million EUR) | 146.52 | 919.10 | 1.80 | 18.23 | 399.46 |
| YoY sales growth (2019–2020) | −8.59 | 20.65 | −43.47 | −6.64 | 19.30 |
| Panel B. SONDTEL | |||||
| % Remote work (2019) | 1.85 | 6.40 | 0.00 | 0.00 | 7.50 |
| % Remote work (2020) | 11.71 | 15.61 | 0.00 | 2.50 | 50.00 |
Notes. Panel A describes summary statistics for variables used in the analysis computed over the baseline sample of firms who responded to the INVIND survey with complete responses to the MOPS module. Sales are measured in millions of EUR in 2019. Expected sales growth is trimmed within five standard deviations. A detailed description of the management score is in the text and Online Appendix B. Employment is measured by headcount. The variable is equal to one for firms reporting positive export sales in 2019, and is equal to one for firms that reported having strong or modest profits in 2019. Panel B reports the summary statistics for variables used in the analysis from the SONDTEL survey. % Remote work in 2019 and in 2020 refers to the number of employees working from home as a share of the firm’s average workforce in each of the years.
To complement our measures of expected performance from the INVIND survey, we use data from the INVIND 2021 survey on realized performance for our baseline sample of firms. This gives us 1,598 firms who were part of the baseline INVIND sample in 2020 and also responded to INVIND 2021. The overall expected year-over-year (YoY) sales growth in 2020 for the INVIND sample is −4.5%. However, this varies over the course of the spread of the pandemic: the average expected sales growth for firms answering post-lockdown is −8.3%.13 This value is very close to the realized YoY sales growth in 2020, which averaged −8.6% (see Panel A of Table 1), and closely follows the aggregate gross domestic product (GDP) decline in 2020 (−8.9%).
2.2. The SONDTEL Survey
The SONDTEL survey is conducted once a year in September on the same firms that comprise the INVIND sample.14 The survey measures short-term dynamics of the Italian economy, and in 2020, the SONDTEL survey included a question on remote work in 2019 as well as in 2020.
Panel B of Table 1 shows the incidence of remote work from the SONDTEL sample. Firms were asked to choose among the following intervals on the incidence of remote work: (a) none (0); (b) modest (0%–5%); (c) a little relevant (5%–10%); (d) fairly relevant (10%–20%); (e) relevant (20%–35%); (f) very relevant (35%–50%); (g) extremely relevant (>50%). To obtain a quantitative measure, we used the midpoint for the interior intervals and the lower limit (50%) for the highest category. The share of remote work increased almost 10-fold from 2019 to 2020. On the extensive margin, in 2019, only 19% of firms in our sample used remote work; in 2020 this increased to 70%. On the intensive margin, the share of remote work went from 1.8% to 11.7%. These figures are in line with official employment statistics: according to the Italian Labor Force Survey, the share of private sector workers engaged in remote work increased from 1.4% in the second quarter of 2019% to 14.4% in the same quarter of 2020.
2.3. The ISECO Survey
To provide a timely qualitative assessment of the effects of the pandemic on Italian firms, the Bank of Italy decided to conduct an additional survey, the ISECO survey (Indagine Straordinaria sugli Effetti del Coronavirus, or the Extraordinary Survey on the Effects of the Coronavirus). This was administered between March 16th and May 14th, 2020, starting from when there were already initial restrictions and continuing into the period of total lockdown. The ISECO survey directly elicits the channels of impact of COVID-19 on Italian firms as well as the strategies adopted by firms to tackle the impact of the pandemic.15
We exploit two unique pieces of information. The first is from the question asking “In relation to the diffusion of COVID-19, what factors are negatively affecting your operations in Italy?” with the following seven options: (1) drop in domestic demand, (2) drop in foreign demand, (3) problems with logistics and infrastructure, (4) lack of labor force, (5) slowdown in the supply of intermediate goods, (6) problems of liquidity and/or in the financial structure, and finally, (7) none of the above. This question can be interpreted as investigating the channels through which the pandemic affects firm operations. Firms were required to list at most three factors, ranking them in descending order of importance. We group together answers pointing to drop in either domestic or foreign demand as “demand” and answers pointing to “problems with logistics and infrastructure” and “slowdown in the supply of intermediate goods” as “supply,” so that we end up with five possible responses.16 Next, we assign to each possible response the maximum rank obtained by each option.
Panel A of Table 2 tabulates responses of the 1,587 firms in our baseline sample that answered the above question, with the responses listed by order of importance across the sample. Among these, 1,062 firms indicated three factors, 303 firms indicated only two, and 222 just one. As clear from Table 2, demand was the most important driver affecting firms in Italy during this period, with about 63% of firms ranking the factor highest. Following demand, firms indicated supply as the second most important factor, with 35% assigning it the second rank. The last column shows the share of firms never mentioning the particular strategy in any of their responses. For example, labor as a driver is very rarely listed, with about 80% of the firms never mentioning it as a factor.
|
Table 2. ISECO Survey: Drivers and Strategies During COVID-19
| 1st rank | 2nd rank | 3rd rank | Never chosen | |
|---|---|---|---|---|
| Panel A. Drivers | ||||
| Demand | 62.9 | 10.7 | 2.0 | 24.4 |
| Supply | 19.0 | 35.2 | 6.1 | 39.7 |
| Labor | 6.0 | 9.9 | 4.4 | 79.6 |
| Finance | 5.2 | 15.4 | 6.6 | 72.8 |
| None | 6.8 | 9.8 | 4.9 | 78.4 |
| Panel B. Strategies | ||||
| Demand | 6.9 | 3.9 | 3.1 | 86.1 |
| Supply | 13.2 | 21.4 | 7.3 | 58.1 |
| Labor | 54.1 | 16.7 | 3.7 | 25.5 |
| Investment | 4.2 | 13.6 | 9.7 | 72.5 |
| Finance | 14.1 | 21.0 | 16.0 | 48.9 |
| None | 7.5 | 4.6 | 7.3 | 80.5 |
Notes. Panel A tabulates responses of the 1,582 firms in our baseline sample that responded to the question “In relation to the diffusion of COVID-19, what factors are negatively affecting your operations in Italy?” Panel B shows responses of 1,579 firms to the question “What strategies have you adopted or are thinking of adopting to counter the negative effect of the spread of the Coronavirus in Italy on the activities of your firm?” Each value is the share of firms in the ISECO sample with the response shown in the row for the order of importance for the given column.
The second key piece of information captured in the ISECO survey is from the question “What strategies have you adopted or are thinking of adopting to counter the negative effect of the spread of the Coronavirus in Italy on the activities of your firm?” Firms were given a series of 10 alternative answers. Following the same procedure as before, we group these into five categories: demand policies, production policies, labor policies, investment plan policies, and finance. We report the details of the aggregation procedure in Online Appendix C. In particular, labor policies refer to changes both in the labor input (number of workers/hours/furloughing) and in the use of remote work. Note that firing was forbidden in Italy for all of 2020, meaning that permanent downsizing of the labor force was not an option for firms.
Overall, 1,583 firms answered the strategy question described here. Among these, 1,026 firms listed three strategies, 280 firms listed two strategies, and 277 listed only one strategy. Panel B of Table 2 shows the share of firms indicating each response by importance. Note that labor-related strategies are the most chosen option: only 26% of firms did not mention labor in one of their possible strategies.17
3. Empirical Strategy and Identification
Our goal is to determine if SMPs constitute an asset or a liability when facing a large unexpected shock that requires immediate and radical changes in the functioning of the firm. Ex ante, the effect of management practices could go either way. On one hand, the practice of constantly setting and reviewing goals and monitoring progress toward achieving them could be useful to redirect firm operations when facing the shock. On the other hand, following these practices requires such targets to be set, shared, and monitored in a structured way. This might be difficult to change abruptly, decreasing the firm’s capacity to promptly respond to the shock, whereas a less formalized management style might possibly allow for a faster response in a situation of crisis (Teece 2007, Augier and Teece 2009).
3.1. Empirical Strategy
The road to our goal is fraught with empirical challenges. First, one needs a large and unexpected shock that materializes quickly and requires immediate action from firms. Second, it is by now well established that the quality of management practices strongly correlates with firm performance in general (Bloom and Van Reenen 2010, Syverson 2011). A better response by high-SMP firms might simply be a reflection of a general superior performance of such firms, rather than something specific to their different reaction to the shock. Third, one also needs to control for correlated effects, such as that firms with higher management scores are also on average larger, more productive, more export oriented, etc., and these characteristics might contribute to the determination of the response to the shock.
We argue that the outbreak of the COVID-19 pandemic in Italy, and the detailed information on firms’ response to it which we have access to, offers an ideal setting to address these challenges. In addition to the strength and the speed with which the pandemic hit Italian firms, two features of the INVIND survey are at the core of our identification strategy. First, the survey is collected every year between the beginning of January and the beginning of May. The left panel of Figure 2 plots the cumulative density function of responses to the 2020 INVIND survey by the week of response, along with two key dates: the announcement of widespread social distancing in Italy on March 8th, and the nationwide lockdown announcement on March 22th. A little less than half of the firms answered the survey before the announcement of the lockdown. Second, the survey collects information on sales growth expectations for the current year (in our case, 2020). Expectations incorporate all information available to the firm at the time of the response. They can therefore capture sharp changes in expected performance as the business environment evolves. This provides a unique opportunity to observe how the evolution of the pandemic drove the expectations of sales growth week by week from the end of January to the beginning of May. The right panel of Figure 2 shows realized sales growth in 2019 (line) and expected sales growth in 2020 (bars) by the week when the INVIND survey was returned by the firm to the Bank of Italy. Before the lockdown, expected sales growth showed no trend. After the lockdown announcement, it quickly deteriorated: although expected sales growth was still close to zero for firms answering up to March 15th, it progressively plummeted during the next three weeks.
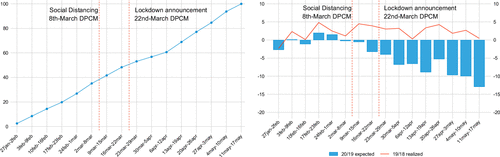
Notes. The line in the left panel represents the cumulative density function of responses to the INVIND 2020 survey by the week of response shown on the x-axis. The sample consists of 1,808 firms that responded to the survey. In the right panel, the y-axis represents the average YoY sales growth from INVIND of the firms that responded during the week reported on the x-axis. The bars are the average 2020 YoY expected sales growth, whereas the line is the average 2019 YoY realized sales growth. The vertical lines in both panels correspond to the announcement dates of widespread social-distancing restrictions in Italy (March 8th) and country-wide lockdown (March 22nd) according to the Decree of the President of the Council of Members (DPCM).
We exploit these two features to set up a difference-in-difference (diff-in-diff) analysis with repeated cross sections, in which the preperiod is before the lockdown and the postperiod is after it.18 In this setting, the treatment is the level of SMPs and our goal is to assess if there are differences in its impact on performance between before (the “normal” period) and after (the “shock” period) the lockdown. In a standard diff-in-diff setting with longitudinal data, we would use sales growth expectations measured for the same firm in both the pre- and the postperiod. Missing this, we estimate the relationship between expected sales growth and management score separately for firms that answered the survey before and after the lockdown. Our analysis, therefore, rests on the assumption that firms that replied to the survey before the COVID-19 shock can be used to build a counterfactual scenario for those that replied after the shock. We discuss this assumption in detail in the next subsection.
Formally, we run the following regression:
3.2. Identification Concerns
For the firms that answered in the preperiod to provide a valid counterfactual for those that answered in the postperiod, firms in the two periods must share the same observable characteristics. This is the typical common support assumption of the difference-in-differences literature (see, for example, Roth et al. 2023). Intuitively, if all high-SMP (or large, or highly profitable) firms answered the survey in the preperiod, we would be comparing very different firms. In Online Appendix Figures D1 and D2, we plot the distribution and the mean of the average management score, firm size, and productivity by week of response. We find that not only the range of variation but also the mean is very similar across weeks of response. To further corroborate this point, we construct an indicator variable equal to one for firms that submitted the survey in a given week and zero otherwise. We then run 16 regressions of each of these “week dummies” on the firm characteristics that we included in our baseline regression: management score, firm size, an indicator that equals one for exporters, firm productivity measured as the log of revenue per worker, and an indicator that takes the value of one for firms with positive profits, where we take 2019 values of each variable. The results from this exercise are shown in Online Appendix Table D1. Out of the 80 coefficients (5 for each regression), only 9 are significant at 10%.19 We conclude that firm characteristics cannot predict the week of response to the survey, indicating that selection in the week of response in terms of observable characteristics is effectively as good as random.20
Another concern is that expectations might systematically differ according to the presence of SMPs, and that this difference might change during the pandemic. Consider, for example, a situation in which, compared with firms with low SMPs, firms with high SMPs become relatively more optimistic in the pandemic period and tend to overpredict their sales in 2020. In this case, a positive correlation between expected sales and the management score in the postperiod might capture this expectation bias rather than true differences in performance. Our data allow us to directly address this concern. First, we will show that our results with expectations are confirmed with realized sales.21 Second, we will compute the expectation error, that is, the difference between expected and realized sales growth, and show that there is no correlation with the management score both pre- and post-lockdown.22
Despite being an aggregate shock, the COVID-19 pandemic hit different firms with different intensities, most notably in terms of belonging to an essential sector, but also along other dimensions. The key assumption for the consistency of our estimates is that these differential effects are not systematically related to SMPs. Ex ante, there is no obvious reason why this correlation could arise. The effects were clearly heterogeneous at the sectoral level, and in our regressions we will always control for sectoral differences through fixed effects. Still, theoretically there might be within-sector effects that are not captured by our controls. We use a unique piece of information contained in the ISECO survey to test this assumption directly: the ISECO asks firms about the factors related to COVID-19 that negatively affected the firm’s operations in Italy, which we grouped into factors in terms of demand (domestic and foreign), supply (logistics, supply chain), labor, finance, and none (as described in Section 2). Firms were asked to choose up to three factors, ranking them according to their relevance. The setting of the question is suitable to be analyzed with the conditional logit model of McFadden (1974), where each factor corresponds to a choice and “none” represents the outside option; there are no characteristics specific to the factors, whereas we do observe firm characteristics. In Online Appendix C we report the details of how we construct the model and how we adapt it to the fact that, compared with the standard model, firms could choose up to three options. We also discuss the conditions under which the model produces consistent estimates, arguing they are likely to be met in our setting. Table 3 reports the odds ratios from the estimation, where a coefficient larger than one indicates that the corresponding variable is positively correlated with the probability of choosing that alternative. No correlation between the management score and the likelihood of indicating any particular factor emerges. This is consistent with the assumption that the shock was exogenous with respect to SMPs in place in a firm.
|
Table 3. Drivers of Negative Effect of COVID-19
| Demand | Supply | Labor | Finance | |
|---|---|---|---|---|
| Management | 1.053 | 1.069 | 1.110 | 0.955 |
| (0.082) | (0.073) | (0.096) | (0.075) | |
| Log(employment) | 0.893* | 0.967 | 1.089 | 0.818*** |
| (0.052) | (0.051) | (0.063) | (0.050) | |
| Log(revenue/employment) | 0.754*** | 0.856** | 0.733*** | 0.656*** |
| (0.056) | (0.053) | (0.059) | (0.049) | |
| 2.822*** | 1.904*** | 2.190*** | 1.770*** | |
| (0.443) | (0.263) | (0.367) | (0.277) | |
| 0.866 | 0.867 | 0.751 | 0.541*** | |
| (0.153) | (0.135) | (0.137) | (0.091) |
Notes. The table shows the results of the conditional logit regression. Drivers are displayed at the top of each column. The coefficients shown are odds ratios, where the omitted category is “None of the above drivers.” A detailed description of the management score is in the text and Online Appendix B. Employment is based on headcount; revenues refer to total sales; for both we take the 2019 value. The variable is equal to one for firms reporting positive export sales in 2019, and is equal to one for firms that reported having strong or modest profits in 2019. Standard errors are shown in parentheses and clustered at the three-digit sector level.
*p < 0.10; **p < 0.05; ***p < 0.01.
4. Results
Figure 1 showed evidence on the relationship between performance and the management score during the pandemic. The trends of expected sales growth by week of response for firms above and below the mean value of the management score did not differ before the lockdown, but diverged as the shock spread and restrictions were introduced, becoming statistically different by mid-April. However, this evidence is just suggestive, because SMPs can be correlated with other determinants of performance. We employ the richness of our data and examine this further by estimating Equation (1).
4.1. Baseline Specification
We start with a parsimonious specification in which we only include the full set of fixed effects: sector and province dummies and their interaction with the postlockdown dummy, week of response dummies, and interview type dummies. The results are reported in column 1 of Table 4. The coefficient of the management score is positive and equals 0.77 in the prelockdown period, but is statistically insignificant. Its value increases to 2.3 (0.77 + 1.58) in the post-lockdown, with the difference between the two estimates statistically significant at the 5% level. As the average decline in expected sales growth in the post-lockdown period is −8.3%, the effect of a one-standard-deviation increase in the management score is more than a 25% reduction in the expected sales drop in the post-lockdown period.
|
Table 4. Management and Sales Growth
| Dependent variable | Expected sales growth | Realized sales growth | |||||
|---|---|---|---|---|---|---|---|
| Sample split | |||||||
| Before | After | ||||||
| (1) | (2) | (3) | (4) | (5) | (6) | (7) | |
| Management | 0.768 | 0.882 | 1.005 | 2.333*** | 1.066 | 1.675*** | 2.074*** |
| (0.650) | (0.656) | (0.660) | (0.646) | (0.666) | (0.536) | (0.575) | |
| Management × | 1.581** | 1.631** | 2.114** | ||||
| (0.756) | (0.774) | (0.816) | |||||
| Log(employment) | −0.198 | −0.723 | 0.300 | −0.615 | −0.157 | −0.135 | |
| (0.402) | (0.561) | (0.521) | (0.441) | (0.512) | (0.540) | ||
| Log(revenue/employment) | 0.695 | −0.796 | 2.282** | −0.264 | 1.216 | 1.835* | |
| (0.587) | (0.885) | (0.891) | (0.711) | (0.975) | (1.066) | ||
| −1.563 | −1.778 | −1.648 | −1.713 | −1.393 | −0.815 | ||
| (1.381) | (1.653) | (1.689) | (1.432) | (1.577) | (1.623) | ||
| −2.059** | −0.435 | −4.133** | −1.297 | 2.677* | 2.471 | ||
| (1.028) | (1.122) | (1.704) | (1.149) | (1.527) | (1.585) | ||
| Closed sector | −1.391 | −8.695*** | |||||
| (2.335) | (2.931) | ||||||
| Closed sector × | −9.597** | ||||||
| (3.942) | |||||||
| Log(average wage) | 2.467 | −0.686 | |||||
| (1.722) | (2.471) | ||||||
| Skill (% white-collar) | 0.031 | −0.041 | |||||
| (0.030) | (0.038) | ||||||
| Average human capital | −6.258 | −14.121* | |||||
| (6.771) | (8.280) | ||||||
| Manager human capital | 3.679 | 5.340 | |||||
| (5.434) | (6.634) | ||||||
| Advanced technologies | 1.041 | −0.448 | |||||
| (1.215) | (1.159) | ||||||
| Fixed effects | |||||||
| Sector | Y | Y | Y | Y | Y | Y | Y |
| Province | Y | Y | Y | Y | Y | Y | Y |
| Week of response | Y | Y | Y | Y | Y | Y | Y |
| Interview type | Y | Y | Y | Y | Y | Y | Y |
| Sector × | Y | Y | Y | ||||
| Province × | Y | Y | Y | ||||
| Observations | 1,535 | 1,535 | 719 | 816 | 1,287 | 1,385 | 1,172 |
Notes. The dependent variable in columns 1–5 is the expected YoY sales growth in 2020 sourced from INVIND. The dependent variable in columns 6–7 is realized YoY sales growth in 2020 from INVIND. A detailed description of the management score is in the text and Online Appendix B. The variable is an indicator variable that takes the value one if the firm answers the 2020 INVIND survey after March 22nd. Employment is based on headcount; revenues refer to total sales; for both we take the 2019 value. The variable is equal to one for firms reporting positive export sales in 2019, and is equal to one for firms that reported having strong or modest profits in 2019. Closed sector is a dummy for five-digit sectors whose activities were not permitted during the lockdown. Average wage is measured in 2019. The share of white-collar workers, average human capital, and manager human capital are sourced from social security data and measured in 2018 (the most recent available year). Average human capital and manager human capital are obtained from individual workers’ fixed effects estimated over the period 2005–2018. Average human capital is the mean of these fixed effects in the within-firm distribution, and manager human capital is the mean in the top quartile of the within-firm distribution (see Bender et al. 2018 for further details). Advanced technologies is an indicator variable that takes the value one if the firm uses at least one of the following: cloud computing, big data, or artificial intelligence. Sectors are defined according to the three-digit industry classification. Interview type is a dummy for interviews conducted over the phone (as opposed to email). Standard errors are clustered at the three-digit industry level.
*p < 0.10; **p < 0.05; ***p < 0.01.
In column 2 of Table 4, we add a set of firm controls that may be correlated with both the management score and expected performance, all measured in 2019. We include size (log of the number of employees) and labor productivity (log of revenue per employee), as larger and more productive firms may be better equipped to face the pandemic relative to smaller and less productive ones.23 We also include indicator variables that capture if the firm has positive exports and if it recorded positive profits. These variables are readily available in INVIND, allowing us to maximize the size of our baseline sample (below we add additional controls from other data sources, in which case we lose some observations). The results are virtually the same as in column 1, indicating that SMPs are not proxying for these firm characteristics.24
In the specification of column 2, we impose a unique coefficient in the two periods for firm characteristics. One possible concern is that the effect of these characteristics on performance changed, too, during the pandemic with respect to normal times. To level the playing field, in columns 3 and 4 we report the results of two regressions in which we separately estimate the model for the pre-lockdown and the post-lockdown period, therefore allowing all the coefficients to vary between the two periods. The results are fully in line with those of column 2: the coefficient of the management score is positive but not significant in the prelockdown period, and more than twice as large and significant at the 1% level post-lockdown. Moreover, we reject the hypothesis that the two coefficients are statistically equal (p = 0.023). Post-lockdown, the coefficient of productivity becomes positive and significant, indicating that more productive firms were able to limit the effects of the shock. However, accounting for this does not decrease the coefficient of the management score.
4.2. Additional Controls
Although we include the controls readily available in INVIND, we cannot exclude that there are other characteristics correlated with both performance and SMPs. We see two main sources of correlated effects. The first is human capital. Using matched employer-employee data for Germany, Bender et al. (2018) show that SMPs and human capital are positively associated, and that the association between SMPs and productivity decreases by 30%–50% when including measures of human capital. Cornwell et al. (2021) find similar results for Brazil. Human capital might also be a factor in the response to the COVID-19 shock, for example because more educated workers can work remotely more efficiently. INVIND has no direct measure of the workers’ human capital. We first use as a proxy the average wage of the employees, based on the assumption that—conditional on controls—firms that pay higher wages also employ more skilled workers. However, the average wage is an imperfect measure of human capital.25 To obtain alternate measures, we use the matched employer-employee version of INVIND based on administrative social security data, for which we have information on workers for the years 2005–2018.
The administrative data do not report the education but only the occupational status. We compute the share of white-collar workers. Accounting for occupational status is important, both because typically white-collar workers have higher human capital and because they are more likely to be able to work remotely, an important factor during the lockdown. We also estimate worker fixed effects from a standard two-way fixed effects regression following Bender et al. (2018). The worker fixed effect captures the average worker’s wages over her career, and therefore is a summary measure of ability, under the (reasonable) assumption that workers with higher skills earn on average higher wages (Card et al. 2013). Following Bender et al. (2018), we construct two measures: the average worker effects and the average effects of the top 25% of the skill distribution. In fact, Bender et al. (2018) show that the latter is more strongly correlated with the quality of SMPs.
The second potential source of correlated effects is technology. It is well known that structured management is complementary to information technology (IT) (Bloom et al. 2012, Schivardi and Schmitz 2020). It might then be that the firms with higher management scores also have invested more in IT, and the level of IT in a firm was a factor in determining the firm’s response to the shock, confounding the role of SMPs. The 2020 INVIND survey elicited the use of advanced technologies, asking if firms were using cloud computing, big data, or artificial intelligence. We construct a dummy which is equal to one if the firm uses at least one of these technologies.26
Another issue is that performance could vary systematically for firms operating in essential sectors relative to others, as these sectors were allowed to operate even during the lockdown. To control for this, we construct a dummy for “closed” sectors (Ci) defined at five-digit industry level. This is the same detail of classification that was used to define essential goods and services.27 Given that this dummy should matter only in the lockdown period, we also interact it with the post-lockdown dummy.
Table 4, column 5, shows the results when including these additional controls. If anything, the effect of SMPs in the post-lockdown period increases. Of the additional controls, only the interaction for the closed sectors dummy and the post-lockdown dummy is significant.28 Results are extremely similar also when we allow the coefficient of all variables to differ between pre- and post-lockdown periods by estimating the model separately for the two subperiods (tabulations unreported for brevity): in this case, in the preperiod the coefficient on management score is equal to 1.18 (p = 0.074) and it increases to 2.82 (p = 0.002) in the post-lockdown period. The difference between the two (1.64) is statistically significant (p = 0.084). Overall, we conclude that the correlation between expected sales growth and the management score during the lockdown is extremely robust and survives the (flexible) inclusion of the most likely confounding effects.29
4.3. Using Realized Sales
One potential concern discussed above is that expectations might be an incorrect measure of performance if the expectation error is systematically related to SMPs. The INVIND 2021 survey reports data on realized sales in 2020, which allows us to do two things to address it. First, we use realized sales as the dependent variable. Note that in this case, we cannot perform any prepost analysis, so we simply regress realized sales on the management score. Column 6 of Table 4 reports the results using the specification of column 2, that is, with the basic firm controls. Firms with higher management scores show considerably larger sales growth in realization as well, in line with the results based on expected sales. The magnitude is similar to that of column 4 for the post sample, despite being slightly lower (1.7 versus 2.3).30 In column 7 we repeat the estimation including all the controls for human capital and technology, obtaining similar results.31
In addition to directly using realized sales, we can also check if expectation errors systematically correlate with SMPs. To check for this possibility, we run the same regressions as in our baseline result (Table 4) but using the expectation error for 2020, defined as expected sales growth minus realized sales growth, as the dependent variable. The results, reported in Online Appendix Table D6, show that both the coefficient of the management score and that of its interaction with the post dummy are never significantly different from zero. This confirms that our results are not driven by systematic differences in expectation errors according to the management score, neither in the pre- nor in the postperiod.
5. Why Did Firms with SMPs Perform Better?
During the most acute phase of the pandemic, as well as after it, many companies moved extensively to remote work (Barrero et al. 2021). SMPs might be a fundamental asset to successfully move a substantial amount of workers to remote work very quickly, and with no possibility to plan the move in advance. In fact, one of the fundamentals of SMPs is to assign workers clearly defined responsibilities, systematically keeping track of outcomes and taking decisions based on the information collected. This “organization philosophy” enables delegation and worker autonomy ex ante and assessment of outcomes ex post.32 This approach to human resource management reduces the need to monitor progress and effort by direct interaction and allows for a more productive use of remote work. Our hypothesis is therefore that better-managed firms were more ready to shift abruptly and substantially to remote work.
We test this hypothesis in Table 5 using the information on remote work from the SONDTEL survey, which reports the percentage of employees working remotely in 2020. In column 1 we find that the management score does correlate with remote work usage: we estimate a coefficient of 1.5, significant at the 5% level. Given that the average remote work in 2020 is 11.7%, a one-standard-deviation increase in the management score implies an increase in the share of remote work of 13 percentage points with respect to the mean. Next, we also control for the use of remote work in 2019. It might be that firms using remote work already in 2019 were more prepared to increase its utilization in 2020. In column 2 we add remote work in 2019 to the regression and find that the coefficient of the management score decreases only marginally (from 1.5 to 1.4) and remains significant at the 5% level.
|
Table 5. Remote Work and Management in 2020
| Overall | Monitoring | Targets | Incentives | ||
|---|---|---|---|---|---|
| (1) | (2) | (3) | (4) | (5) | |
| Management | 1.485*** | 1.375*** | 1.209*** | 0.596 | 0.869** |
| (0.432) | (0.414) | (0.340) | (0.389) | (0.366) | |
| Log(employment) | 2.919*** | 2.622*** | 2.691*** | 2.853*** | 2.754*** |
| (0.394) | (0.370) | (0.373) | (0.360) | (0.376) | |
| Log(revenue/employment) | 2.809*** | 2.533*** | 2.563*** | 2.598*** | 2.521*** |
| (0.568) | (0.523) | (0.524) | (0.537) | (0.523) | |
| 0.147 | 0.329 | 0.236 | 0.421 | 0.522 | |
| (0.739) | (0.722) | (0.730) | (0.742) | (0.743) | |
| −0.472 | −0.257 | −0.134 | −0.0145 | −0.261 | |
| (0.701) | (0.675) | (0.683) | (0.679) | (0.685) | |
| Advanced technologies | 1.842** | 1.714** | 1.925*** | 2.080*** | 1.949** |
| (0.740) | (0.741) | (0.725) | (0.730) | (0.770) | |
| Skill (% white-collar) | 0.163*** | 0.152*** | 0.153*** | 0.153*** | 0.152*** |
| (0.024) | (0.023) | (0.023) | (0.023) | (0.023) | |
| % Remote work (2019) | 0.395*** | 0.391*** | 0.396*** | 0.401*** | |
| (0.056) | (0.056) | (0.055) | (0.057) | ||
| Observations | 1,500 | 1,495 | 1,493 | 1,491 | 1,491 |
Notes. The dependent variable is the percentage of employees at the firm working remotely in 2020. A detailed description of the management score is in the text and Online Appendix B. Employment is based on headcount; revenues refer to total sales; for both we take the 2019 value. The variable is equal to one for firms reporting positive export sales in 2019, and is equal to one for firms that reported having strong or modest profits in 2019. Advanced technologies is an indicator variable which takes the value one if the firm uses at least one of the following technologies: cloud computing, big data, or artificial intelligence. The share of white-collar workers is measured in 2018 from social security data (last year available). % Remote work (2019) refers to the number of employees working from home as a share of the firm’s average workforce in 2019. Regressions include three-digit sector and province fixed effects. Standard errors are shown in parentheses and are clustered at the three-digit sector level.
*p < 0.10; **p < 0.05; ***p < 0.01.
To delve deeper into this, we examine if the effect is related to any specific component of SMPs. To do this, we keep the same specification as in column 2 and now use the management subscores on monitoring, targets, and incentives as regressors. We report the results in columns 3, 4, and 5 of Table 5. We find that the overall result is driven by the monitoring and incentives components of the management scores. This is expected: the monitoring section captures how many KPI the firm tracks, including worker absenteeism. Monitoring performance through measurable outcomes may help substitute for direct monitoring of workers at the workplace. The same holds for incentives: using structured incentives-based schemes requires some measurable notion of output, and this can be used to assess worker performance when working remotely. In contrast, targets are not significant, arguably because this component captures setting medium- to longer-term targets, which may not be particularly relevant in the acute phase of the pandemic and lockdown.
The overall score bears a larger coefficient than any of the components, suggesting that the different dimensions of SMPs are complementary in allowing a more efficient organization of remote work. This is in line with the experimental results of Bruhn et al. (2018) on Mexican SMEs, which show that there is no silver bullet, that is, no single managerial practice that in itself improves firm performance. Our results are consistent with the framework of Brynjolfsson and Milgrom (2013), who emphasize the role of complementarities in practices within organizations, that is, the added value of clusters of practices working in concordance relative to their independent effects.
One may argue that structured management mattered mostly because it was instrumental in switching activity to remote work in the context of the pandemic, limiting the generality of our findings. We leverage the ISECO survey to investigate more in general the strategies the firms adopted or considered adopting to counter the negative effects of the pandemic. We estimate the same conditional logit model introduced in Section 3 and report the results in Online Appendix Table D7. We find that firms with higher management scores were more active in addressing the shock along all the queried dimensions (demand, supply, investment plans) except finance. This indicates that SMPs were instrumental to reorganizing the “real” part of the firm activity along a broad set of dimensions, suggesting that our results are likely to generalize beyond the specific context of the COVID-19 pandemic.
6. Discussion and Conclusions
We study the role of modern SMPs in responding to a large, unanticipated shock, the COVID-19 pandemic in Italy. We find that firms with better SMPs were more likely to take action to address the challenges posed by the pandemic and were able to limit its negative effects. One special feature of our empirical setting is that we can compare the relationship between SMPs and expected sales growth in a narrow window around the outbreak of the pandemic. Therefore, we can conclude that SMPs were particularly useful to tackle a large, totally unanticipated shock, above and beyond their contribution to firm management in “normal times.”
One important question is external validity, because of the specificity of the COVID-19 shock. The pandemic induced a large, unexpected, and extremely rapid disruption in firm operations. As such, our results are likely to extend to other unexpected events that severely constrain firm operations, such as natural disasters, wars, disruptions in the supply chain, etc. They apply to a lesser extent to demand-driven recessions, where firms are not constrained in their operations but by the lack of demand. This can explain the contrasting results found by the (small) literature focused on the Great Recession (Cette et al. 2020, Englmaier et al. 2020).
The features of our exercise have important implications about what we can (and cannot) learn about SMPs. Our empirical design measures changes in the relationship between SMPs and performance occurring over a very short period of time, so we capture the ability to cope with the immediate effects of the pandemic. Our analysis indicates that, to tackle the immediate effects of an unexpected shock, it is extant monitoring and incentive practices that mattered, rather than changes thereof, as it is unlikely that firms radically changed SMPs in the short time frame we consider around the outbreak of the pandemic. We therefore conclude that, despite being primarily designed for operations management, SMPs are also a good “fit” for adaptation, and that there is no trade-off between the two dimensions. In contrast, our results cannot be extrapolated to firms repositioning to long-term changes induced by the pandemic (the so-called “new normal”). This is indeed an important and exciting area of future research for strategic management and organization design (Englmaier et al. 2019). Finally, because of the sample size, we could not investigate the heterogeneity of firm responses. Along with going deeper into the mechanisms, this is another important topic for future research.
The authors are grateful to the editor, three anonymous referees, Nick Bloom, Matteo Bugamelli, Luca Citino, Leonardo Iacovone, Alessandro Iaria, Marco Pagano, Lorenzo Pandolfi, Mariana Pereira-López, Raffaella Sadun, Chad Syverson, Alessandro Zattoni, and seminar participants at EIEF, LUISS University, Bank of Italy, IIM Bangalore, CSEF, the Empirical Management Conference (2020), NBER Summer Institute Macroeconomics and Productivity (2021), CAED (2021), ACEGD (2021), and the Bank of Italy-CEPR-EIEF “Firms in a period of turmoil” conference for comments and suggestions. The views expressed herein are those of the authors and are not necessarily those of the Bank of Italy.
1 For example, German firms updated business expectations twice: first, when there were increased restrictions in Northern Italy, and second, following the announcement of the German national lockdown (Buchheim et al. 2022).
2 In Online Appendix A we give a detailed account of the spread of the pandemic in Italy and the measures adopted by the Italian government to counter its effects.
3 This is not at odds with the literature cited above that shows that firms with higher SMPs perform better. That evidence, in fact, shows that such firms are more productive, larger, more profitable, etc., in levels. This does not imply that they also constantly grow more, a much stronger requirement in terms of performance.
4 For example, Aghion et al. (2021) find that, during the Great Recession, decentralization of decision making became particularly useful to tackle the increased turbulence firms faced. Using stock market data for Italy, Amore et al. (2022) show that firms owned and managed by a family, usually associated with poorer performance, had higher abnormal returns during the pandemic period. For the U.S. stock market, Alfaro et al. (2020) find that, contrary to normal times, investors valued firms with high labor intensity, which could more easily cut costs by shedding labor.
5 In addition to using a different shock, our work differs along other dimensions that limit the comparability with these two papers. Cette et al. (2020) use sectoral measures of performance and a country-level measure of management practices, whereas we use firm-level data for both. Englmaier et al. (2020) use productivity as their preferred measure of performance, whereas we use expected sales. In our setting, expectations are instrumental to detecting the rapid change in performance that occurred with the spread of the pandemic and to setting up a test of differential effects of SMPs in crises with respect to “normal” times.
6 Details about the INVIND survey can be found at https://www.bancaditalia.it/pubblicazioni/indagine-imprese/2019-indagine-imprese/index.html?com.dotmarketing.htmlpage.language=1.
7 The sample of interviewed firms is quite stable: the same firms are interviewed every year, adjusting only for attrition and to balance the sector coverage and size profile against that of the population.
8 See Guiso and Parigi (1999) for early work, and Ma et al. (2020) and Coibion et al. (2020) for more recent work.
9 In addition, the evolution of employment was heavily influenced by government policies introduced during the pandemic that forbade layoffs and offered an encompassing employment protection scheme.
10 Details about the Management and Organizational Practices Survey (MOPS) administered by the U.S. Census Bureau can be found at https://www.census.gov/programs-surveys/mops.html.
11 One potential concern is that firms can also implement changes in SMPs during the pandemic. We believe that this is not a concern for our identification strategy. First, as explained above, firms were explicitly asked to refer to practices in place in 2019, strictly before the pandemic outbreak. Second, even in the presence of reporting bias reflecting changes implemented in 2020, it is unlikely that firms were able to substantially change their practices in the short time span of 16 weeks that we use in our main empirical analysis.
12 See, for example, Bloom et al. (2022), Kambayashi et al. (2021), and Choudhary et al. (2018). Prior to using the measure for analysis, we nevertheless validate it for our context. First, we confirm that the relative distribution of management scores in Italy versus the United States follows the cross-country findings in the World Management Survey, with a heavier left tail in Italy relative to the United States in the management score distribution. Second, we confirm that the management score is correlated with various measures of firm performance, consistent with Bloom et al. (2019). Details on the validation procedure are in Online Appendix B.
13 Throughout the analysis, we trim the expected sales growth variable within five standard deviations.
14 Details on the SONDTEL survey can be found at https://www.bancaditalia.it/pubblicazioni/sondaggio-imprese/2020-sondaggio-imprese/index.html?com.dotmarketing.htmlpage.language=1.
15 The methodology for the ISECO survey can be found at https://www.bancaditalia.it/pubblicazioni/indagine-imprese/2019-indagine-imprese/metodologia_iseco_2020.pdf, and the questionnaire can be accessed at https://www.bancaditalia.it/pubblicazioni/indagine-imprese/2019-indagine-imprese/questionnaire_iseco_eng.pdf?language_id=1.
16 Our final drivers are demand, supply, labor, finance, and none. See Online Appendix Table C1 for further details.
17 Crispino (2021) applies to the same data a Bayesian Mallow model, a statistical model to analyze ranking data (including those in the form of top-k rankings like ours), and concludes that labor policies were the most adopted corporate strategy to tackle the effects of the pandemic.
18 As shown in the right panel of Figure 2, the two weeks around the beginning of the lockdown recorded sales growth that is halfway between the prelockdown and the lockdown period. In the week of March 16th–22nd, when the situation was rapidly deteriorating, firms started to revise expectations in the light of the escalating restrictions, for example by incorporating the possible introduction of a nationwide lockdown. Moreover, firms that returned the questionnaire the following week (March 23rd–29th) might have filled it in before the announcement of the lockdown and filed it afterward, and therefore with a different outlook on the future sales dynamics than once the lockdown was already in place. Data for these two weeks are not clearly classifiable as referring to before or after the moment in which the severity of the shock was fully understood, and might attenuate the results. We therefore exclude firms that answered in those weeks (207 out of 1,808 firms). All our results hold and are slightly weaker when we include all firms and we define the postperiod starting from the lockdown announcement (see Online Appendix Table D3).
19 Note that, with 80 coefficients, the expected number of significant estimated coefficients at 10% significance level when the true coefficients are actually equal to zero is eight, in line with the nine we find.
20 Following D’Haultfœuille et al. (2023), we also check a more stringent condition: that the similarity in characteristics also holds conditional on the management score. We do this by running our prepost specification, where we use an observable firm characteristic as an outcome (employment, productivity, etc.), and we include in our regression both the management score level and its interaction with the post-lockdown dummy. Online Appendix Table D2 shows the results. We find that the interactions between the management score and the post-lockdown dummy are always close to zero and statistically insignificant, which indicates that in our sample, firms with similar management scores also have similar characteristics in the two periods. This further ensures the comparability of the two samples.
21 We use realized sales as a robustness check rather than our preferred performance measure because we cannot implement our diff-in-diff identification strategy, as realized sales are independent from the week in which the firm filed the survey, and therefore the estimates cannot be interpreted in terms of the difference between the crisis period and the normal period.
22 Note that systematic biases (such as the tendency to under- or overpredict sales) correlated with SMPs would invalidate expectations as a measure of performance. Differences in accuracy would instead translate into heteroskedasticity of the error term, which does not lead to biased estimates. Consequently, we use the difference between expected and realized sales growth, rather than its absolute value or its square, which is the typical measure of accuracy used in the literature (see, for example, Altig et al. 2020). Our measure and our findings using expectation error align with Bloom et al. (2020).
23 In the context of the United States, Bartik et al. (2020) show that small firms experienced a significantly negative impact of COVID-19.
24 To address potential collinearity concerns, in columns 1–4 of Table D4 of Online Appendix D we show the results when controls are added sequentially one by one, finding that they remain very stable.
25 For example, a large employer-employee literature shows that there is a wage component at the firm level that is not explained by workers’ skills (Abowd et al. 1999). Moreover, labor market regulation on wage determination can weaken the link between human capital and wages.
26 Of course, advanced technologies only measure one aspect of IT, and others might have mattered during the pandemic. Unfortunately, this is the only measure of IT available in the survey. Despite not fully capturing the degree of digitization of the firm, we show below that it is positively correlated with the extent to which firms adopted remote work, suggesting that it is a useful variable to include in the regression to control for the possibility that firms with more SMPs might also adopt better IT.
27 Our three-digit sector dummies account for most of the essential sector status. However, within 17 out of the 159 three-digit sectors covered by our firms, some subsectors are classified as essential and others are not. A list of essentials sectors as defined by the Italian government can be found in annex 1 of the DPCM of March 22nd, available at https://www.gazzettaufficiale.it/eli/gu/2020/03/22/76/sg/pdf.
28 One might be surprised by the fact that none of the human capital and technology controls are significant. As explained above, however, it is important to distinguish between the effects of these variables on sales level and on growth rates. In unreported regressions, we have used the logarithm of sales level in 2019 as the dependent variable, finding that most of the controls are significant and with the expected sign, whereas the management score loses significance. This lends further support to the hypothesis that, compared with other firm characteristics, SMPs are particularly important to counter a large shock. Moreover, to investigate the possibility that the lack of significance is due to multicollinearity, in columns 5–10 of Online Appendix Table D4 we repeat the estimation including one variable at a time, finding that the estimates are very stable.
29 We have performed additional robustness checks. First, we have computed the expected growth rate of sales in 2020 with respect to average 2017–2019 sales, to make sure that the results are not driven by some specificity of 2019. Second, we have shown above that for three weeks SMPs could weakly predict the week of response (February 10–16, April 20–26, and May 4–10; see Online Appendix Table D1). To check that selection is not driving our results, we have repeated the estimation excluding these weeks from our sample. In both cases, we find that results become stronger (available upon request).
30 Part of the difference is because some firms that answered the INVIND survey in 2020 did not in 2021. It turns out that these are firms with low MOPS scores and low expected sales, which possibly exited the market. If we run the regression of column 4 excluding these firms, the coefficient drops to 2.0, reducing the gap. Moreover, we have chosen a very conservative treatment of outliers, excluding firms with expected sales growth above or below the mean plus or minus five times the standard deviation (see Section 2.1 for more details). If we trim at the first and last percentiles, another common strategy used to deal with outliers, we get exactly the same estimates using expected and actual sales.
31 In Online Appendix Table D5 we repeat the regressions with realized sales including the controls sequentially and show that the point estimates are highly stable.
32 In fact, early studies on changes in firm organization related to the diffusion of IT stressed the importance of the decentralization of authority, the “delayering” of managerial functions, and team-based work organization (Caroli and Van Reenen 2001, Bresnahan et al. 2002).
References
- (1999) High wage workers and high wage firms. Econometrica 67(2):251–333.Crossref, Google Scholar
- (2021) Turbulence, firm decentralization, and growth in bad times. Amer. Econom. J. Appl. Econom. 13(1):133–169.Crossref, Google Scholar
- (2020) Aggregate and firm-level stock returns during pandemics, in real time. NBER Working Paper No. w26950, National Bureau of Economic Research, Cambridge, MA.Google Scholar
- (2020) Surveying business uncertainty. J. Econometrics 231(1):282–303.Crossref, Google Scholar
- (2022) Family ownership during the Covid-19 pandemic. J. Banking Finance 135:106385.Crossref, Google Scholar
- (2009) Dynamic capabilities and the role of managers in business strategy and economic performance. Organ. Sci. 20(2):410–421.Link, Google Scholar
- (2021) Why working from home will stick. NBER Working Paper No. 28731, National Bureau of Economic Research, Cambridge, MA.Google Scholar
- (2020) The impact of COVID-19 on small business outcomes and expectations. Proc. Natl. Acad. Sci. USA 117(30):17656–17666.Crossref, Google Scholar
- (2018) Management practices, workforce selection, and productivity. J. Labor Econom. 36(S1):S371–S409.Crossref, Google Scholar
- (2007) Measuring and explaining management practices across firms and countries. Quart. J. Econom. 122(4):1351–1408.Crossref, Google Scholar
- (2010) Why do management practices differ across firms and countries? J. Econom. Perspect. 24(1):203–224.Crossref, Google Scholar
- (2012) Americans do IT better: US multinationals and the productivity miracle. Amer. Econom. Rev. 102(1):167–201.Crossref, Google Scholar
- (2016) Management as a technology? NBER Working Paper No. 22327, National Bureau of Economic Research, Cambridge, MA.Google Scholar
- (2022) Management and misallocation in Mexico. NBER Working Paper No. 29717, National Bureau of Economic Research, Cambridge, MA.Google Scholar
- (2013) Does management matter? Evidence from India. Quart. J. Econom. 128(1):1–51.Crossref, Google Scholar
- (2020) Business-level expectations and uncertainty. Working Paper No. 28259, National Bureau of Economic Research, Cambridge, MA.Google Scholar
- (2019) What drives differences in management practices? Amer. Econom. Rev. 109(5):1648–1683.Crossref, Google Scholar
- (2002) Information technology, workplace organization, and the demand for skilled labor: Firm-level evidence. Quart. J. Econom. 117(1):339–376.Crossref, Google Scholar
- (2018) The impact of consulting services on small and medium enterprises: Evidence from a randomized trial in Mexico. J. Political Econom. 126(2):635–687.Crossref, Google Scholar
- . (2013)
Complementarity in organizations . Gibbons R, Roberts J, eds. The Handbook of Organizational Economics (Princeton University Press, Princeton, NJ), 11–55.Crossref, Google Scholar - (2022) Sudden stop: When did firms anticipate the potential consequences of COVID-19? German Econom. Rev. 23(1):79–119.Crossref, Google Scholar
- (2013) Workplace heterogeneity and the rise of West German wage inequality. Quart. J. Econom. 128(3):967–1015.Crossref, Google Scholar
- (2001) Skill-biased organizational change? Evidence from a panel of British and French establishments. Quart. J. Econom. 116(4):1449–1492.Crossref, Google Scholar
- (2020) Economic adjustment during the great recession: The role of managerial quality. NBER Working Paper No. 27954, National Bureau of Economic Research, Cambridge, MA.Google Scholar
- (2018) Management in Pakistan: Performance and conflict. International Growth Centre Working Paper, International Growth Centre, London.Google Scholar
- (2022) Performance stability among small and medium-sized enterprises during COVID-19: A test of the efficacy of dynamic capabilities. Internat. Small Bus. J. 40(3):403–419.Crossref, Google Scholar
- (2020) Inflation expectations and firm decisions: New causal evidence. Quart. J. Econom. 135(1):165–219.Crossref, Google Scholar
- (2021) Building a productive workforce: The role of structured management practices. Management Sci. 67(12):7308–7321.Link, Google Scholar
- (2021) Statistical learning from ranking data: Italian firms’ strategies and preferences during COVID-19 crisis. Mimeo (Bank of Italy, Rome).Google Scholar
- (2023) Nonparametric difference-in-differences in repeated cross-sections with continuous treatments. J. Econometrics 234(2):664–690.Crossref, Google Scholar
- (2021) Dynamic capabilities, value creation and value capture: Evidence from SMEs under COVID-19 lockdown in Poland. PLoS One 16(6):e0252423.Crossref, Google Scholar
- (2023) Working remotely? Selection, treatment, and the market for remote work. Staff report no. 1061, Federal Reserve Bank of New York, New York.Crossref, Google Scholar
- (2019)
Organization design and firm heterogeneity: Toward an integrated research agenda for strategy . Joseph J, Baumann O, Burton R, Srikanth K, eds. Organization Design. Advances in Strategic Management, vol. 40 (Emerald Publishing Limited, Bingley, UK), 229–254.Google Scholar - (2020) Management practices and firm performance during the Great Recession. Evidence from Spanish survey data, https://events.bse.eu/live/files/2818-ricardgil66450pdf.Google Scholar
- (2023) Working from home and management controls. J. Bus. Econom. 93:193–228.Crossref, Google Scholar
- (2021) Work from home & productivity: Evidence from personnel & analytics data on IT professionals. Becker Friedman Institute for Economics Working Paper, University of Chicago, Chicago.Google Scholar
- (2019) The long-term effects of management and technology transfers. Amer. Econom. Rev. 109(1):121–152.Crossref, Google Scholar
- (1999) Investment and demand uncertainty. Quart. J. Econom. 114(1):185–227.Crossref, Google Scholar
- (2015)
Dynamic managerial capabilities: A perspective on the relationship between managers, creativity, and innovation . Shalley CE, Hitt MA, Zhou J, eds. The Oxford Handbook of Creativity, Innovation, and Entrepreneurship (Oxford University Press, New York), 421–430.Google Scholar - (1997) The effects of human resource management practices on productivity: A study of steel finishing lines. Amer. Econom. Rev. 87(3):291–313.Google Scholar
- (2021) Management practices and productivity in Japan: Evidence from six industries in JP MOPS. J. Jpn. Internat. Econom. 61:101152.Crossref, Google Scholar
- (2012)
Personnel economics . Gibbons RS, Roberts J, eds. The Handbook of Organizational Economics (Princeton University Press, Princeton, NJ), 469–519.Google Scholar - (2020) A quantitative analysis of distortions in managerial forecasts. NBER Working Paper No. 26830, National Bureau of Economic Research, Cambridge, MA.Google Scholar
- (1974)
Conditional logit analysis of qualitative choice behavior . Zarembaka P, ed. Frontiers in Econometrics (Academic Press, New York), 105–142.Google Scholar - (2016) Demand or productivity: What determines firm growth? RAND J. Econom. 47(3):608–630.Crossref, Google Scholar
- (2021) Entrepreneurial ecosystems during COVID-19: The survival of small businesses using dynamic capabilities. World J. Entrepreneurship Management Sustainable Development 17(3):457–476.Google Scholar
- (2016) Bankruptcy law and bank financing. J. Financial Econom. 120(2):363–382.Crossref, Google Scholar
- (2023) What’s trending in difference-in-differences? A synthesis of the recent econometrics literature. J. Econometrics 235(2):2218–2244.Crossref, Google Scholar
- (2020) The IT revolution and southern Europe’s two lost decades. J. Eur. Econom. Assoc. 18(5):2441–2486.Crossref, Google Scholar
- (2011) What determines productivity? J. Econom. Lit. 49(2):326–365.Crossref, Google Scholar
- (2007) Explicating dynamic capabilities: The nature and microfoundations of (sustainable) enterprise performance. Strategic Management J. 28(13):1319–1350.Crossref, Google Scholar

