


Lost Marie Curies: Parental Impact on the Probability of Becoming an Inventor
Abstract
This research investigates the role of parents in explaining the surprisingly low presence of women among inventors despite their increase among graduates from science, technology, engineering and mathematics (STEM) subjects. With Danish registry data on the population born between 1966 and 1985 and an experimental setting crafted on siblings’ gender composition, we find that the transmission of inventorship from parents to children disfavors daughters if they have a (second-born) brother. We complement this analysis with evidence about the role of parental factors at different stages of children’s education. Overall, our results confirm that parental role models matter for children’s education, especially at early stages and, through this, increase the probability of a child’s becoming an inventor. However, the direct transmission of inventorship that favors boys much more than girls seems to be affected by gendered expectations developed by parents about daughters’ and sons’ returns from inventorship. Our study contributes to explaining who becomes an inventor and why by adding an important boundary condition to the literature: Parents are intermediaries who, based on their own interpretation of external information about inventive jobs, contribute to create or limit opportunities for their children.
This paper was accepted by Olav Sorenson, organizations.
Funding: The authors got financial funding from the Novo Nordisk Foundation in the course of the project “Investments, incentives, and the impact of Danish research (Triple-I-Research)” [Grant NNF16OC0021444].
Supplemental Material: Data files and the online appendix are available at https://doi.org/10.1287/mnsc.2022.4432.
1. Introduction
In recent decades, the gender gap in STEM bachelors’ degrees has steadily narrowed. Worldwide statistics show 34% female graduates in STEM fields in 2013; 48% if we include health degrees (Schmuck 2017). Despite these trends, patented inventions still come mainly from men. Female inventors compose just 7%–18% of the overall inventor population in most developed countries, depending on cohorts and technological fields (Hunt et al. 2013, Jensen et al. 2018). In engineering, less than 5% of inventions are by women (Hoisl and Mariani 2017).
Hence, the gap between the share of women who would have the competencies to make inventions and the actual share of female inventors is surprisingly large. Combined with the fact that talent and creativity are equally distributed across genders, this implies that there is an unexploited inventive potential, the “lost Einsteins” (Bell et al. 2019), or, better, the “lost Marie Skłodowska Curies.” This observation prompted us to study why women and men differ in terms of their probabilities of becoming inventors, above and beyond differences in their educational choices.
Early literature on the gender gap in innovation has indeed focused on women’s selection into higher-education STEM fields as a prerequisite for their transition into inventorship (Wetzels and Zorlu 2003, Leszczensky et al. 2013, Toivanen and Väänänen 2016). More recent literature has shown that additional influences, such as those from the environment children live in, including their families, matter in nurturing the next generation of inventors (Aghion et al. 2018, Kahn and Ginther 2018, Bell et al. 2019). This environment has mostly been considered as providing objective background characteristics and resources that influence children’s opportunities. Less attention has been paid to the active role of the agents in this environment, who act as intermediaries in the acquisition and interpretation of external information, norms, and values, which concur to form priors that are transmitted to children.
We study parents as a specific type of intermediary and investigate their role in the probability of children to become inventors. Bau and Fernández (2021) show that the family is the most important intergenerational transmitter of social beliefs and values. Parents are part of society and are exposed to external information, which they interpret according to their beliefs. Based on these interpretations, they develop expectations about children’s opportunities and returns to their choices. These expectations, however, can be gendered in many ways. Women, for instance, are rare among inventors, and literature has shown that female inventors are disadvantaged relative to male inventors in terms of the returns to invention (Hunt et al. 2013, Toivanen and Väänänen 2016, Hoisl and Mariani 2017, Jensen et al. 2018). Parents’ own beliefs and interpretations of such information can shape decisions and behaviors about their children’s entry into inventorship, resulting in gender-dependent unequal attitudes toward children.
We inform our analysis of the influence of parents as intermediaries in the intergenerational transmission of inventorship by building on recent literature on the determinants of becoming inventors (Aghion et al. 2018, Bell et al. 2019), combined with contributions aimed at identifying the extent to which the intergenerational transmission of occupational interests depends on the gender of the children (Oguzoglu and Ozbeklik 2016, Mishkin 2021, Brenøe 2021).
For our empirical analysis, we use detailed registry data for the population of individuals born between 1966 and 1985 and residing in Denmark when they turned 19, the typical age of graduating from high school. We have complete information for 1.2 million individuals on their own educational trajectories and parental educational background, as well as family living situation in childhood and adolescence, including place of residence and family income. This population contains approximately 4,600 inventors, that is, Danish residents listed on at least one European (EP) patent application. Only 15% of these inventors are women.
We first examine whether parental inventorship (i.e., one or both parents are inventors) is associated with the probability of children becoming inventors and whether the intergenerational transmission of inventorship is gender neutral. To this end, we use an experiment that makes salient the existence of gendered parental influence, if any. We consider first-born girls who have at least one younger sibling. For these, we test whether the influence of parental background on a first-born daughter’s likelihood of becoming an inventor differs depending on the gender of her next-born sibling and compare these results with those for first-born sons (Mishkin 2021, Brenøe 2021). The advantage of this approach is that the random occurrence of the gender of the second-born sibling allows us to exclude as a likely source of difference possible systematic cross-family variation in parental resources (e.g., time or money) and other environmental factors or systematic differences in innate abilities, skills, or preferences of the first-born child.
Second, we trace children’s educational trajectories to explore the mechanisms that likely explain the results from the siblings’ analysis. We examine the role of parental factors at points when important decisions are made that affect the likelihood that children will enter inventorship. In this way, we seek to understand which choices are influenced by forces, such as general spillovers or role modeling, and which choices are likely related to parents’ decisions and behaviors that are informed by their interpretations of external information. Because the latter is difficult to measure directly, we combine different pieces of empirical evidence that, together, bring us closer to the mechanisms in play.
We find that parental inventorship increases the probability of daughters becoming inventors only if they do not have a second-born brother. When the second sibling is a boy, the positive effect disappears, so that daughters do not benefit from parental inventorship. For first-born sons, instead, the effect of parental inventorship on the probability of becoming an inventor does not change with the gender of the second-born sibling. The exploration of children’s educational trajectories reveals that STEM parental education predicts both daughters’ and sons’ educational choices and that role models likely explain this relationship. Hence, role models seem to contribute to developing children’s necessary skills to become inventors. However, parental education does not directly correlate with children’s transition from STEM education into inventorship. Parental inventorship, instead, does.
We interpret these results to mean that parental inventorship is transmitted to children, over and above their educational choices. However, this intergenerational transmission of inventorship benefits daughters only when parental interpretations of external information are not gendered. A second-born brother of a first-born daughter seems to unlock these gendered interpretations of information that comes from a job in which women are at a disadvantage. Parents who are themselves inventors are well aware of this disadvantage.
Our results contribute to explaining who becomes an inventor and why by adding an important boundary condition to the literature (Aghion et al. 2018, Bell et al. 2019). Moreover, our results contribute to answering the question of how parental decisions and behaviors may (or may not) effectively reduce gender gaps in innovation.
2. Parents’ Influence on Children’s Education, Career, and Likelihood to Invent
Parents exert an influence on children’s motivation and desire to pursue careers in STEM fields. It is not a coincidence that Irène Joliot-Curie, the daughter of Marie and Pierre Curie, followed in her parents’ footsteps and, like her parents, studied chemistry and physics and continued research on radioactivity. Just like her parents in 1903, she and her husband received the Nobel Prize for Chemistry in 1935 for their discovery of artificial radioactivity (Irène Joliot-Curie Facts 2021). However, how do parents influence their children’s preferences and choices leading to a career in STEM? Does their role differ depending on their children’s gender?
Dossi et al. (2021) document that parental preferences are transmitted to children and that they explain a sizeable part of the gender gap in mathematics. Chise et al. (2021) find evidence of an intergenerational transmission of STEM education, with fathers’ influence on children’s university completion being stronger than mothers’ for sons more than for daughters. Whereas fathers’ influence strengthens as children proceed up the education ladder and get closer to entering the labor market, mothers’ influence diminishes over time. Chopra et al. (2018) find that personal influences, family encouragement, and role models are more important for women to study engineering than for men. This result is consistent with prior studies, such as Farmer (1987), showing that women’s career motivations are more affected than men’s by parental and teacher support.
The literature has also investigated whether parental influence on children’s interest in STEM fields is causal and, if so, whether nurturing (because of some investment of time and resources that parents dedicate to their children) contributes to developing these interests in addition to nature (i.e., inherited aptitude). By exploiting variations in the amount of time children spend with their parents because of the death of one parent, based on Israeli registry data, Gould et al. (2020) conclude that nurturing is important, as time spent with children impacts the amount and type of human capital they develop. Kalil et al. (2016) find similar results based on administrative data from Norway. They further show that variation in the exposure to fathers after the death of mothers has stronger effects on sons than on daughters.
Parents help shape their children’s educational and job-related paths toward STEM fields through several mechanisms. Some of these mechanisms are activated by factors in the children’s environment, such as whether they grow up in a family or an environment that fosters specific interests. Recent literature reveals that children’s exposure to a particular (family) environment affects job-related choices. Carr and Sequeira (2007) show that exposure to a family business during childhood is significantly and positively related to one’s own entrepreneurial intentions. For becoming an inventor, exposure to a scientific culture—and, more specifically, to inventing or creative problem-solving as an attitude, profession, and passion—affects children’s decisions to become inventors themselves. Bell et al. (2019) show that childhood exposure to inventions or inventors is a strong predictor of the probability of becoming an inventor for both girls and boys. The key function of a supportive parental environment also results from the work of Aghion et al. (2018), who find that a lack of parental resources disproportionately harms highly talented (male1) individuals, pointing to a social inefficiency because of a misallocation of resources.
Similarly, parental role models influence children’s choices. Because women typically underestimate their likelihood of succeeding in STEM fields (Meece et al. 1982, Correll 2001, Ehrlinger and Dunning 2003), exposing them to individuals with a record of success in STEM (Marx et al. 2005) is an effective means to change this prior. The literature establishes that role models are gendered and specialized, such that female role models are more effective at convincing women to join STEM fields (Del Caprio and Guadalupe 2021, McGinn et al. 2019). Cheng et al. (2017) find that having a parent who works in a STEM occupation increases the probability that a child will pursue STEM studies and work in a STEM field as well, with the effect being larger for mothers and daughters than for fathers and daughters (Chise et al. 2021). The authors attribute this finding to maternal role models. In the case of inventorship, Bell et al. (2019) find that proximity to female-inventor role models contributes to the probability of girls becoming inventors. Carrell et al. (2010) show that gender gaps in STEM fields are likely to close if (high-performing) female students are assigned to female professors in math and science courses. The effects are stronger for female students with female professors than for male students with male professors.
Another mechanism resides in the family and particularly in the role of parents as intermediaries. Based on their own beliefs, parents develop interpretations about information that they take from the environment (Bau and Fernández 2021). These interpretations lead to expectations about the returns to their children’s activities, which can be gendered and, in turn, inform their decisions and behaviors. Consequently, although parents may encourage their children to choose a particular field of study or profession, they may also (actively) discourage them from doing so. This is particularly important for the choice of STEM fields of study and professions where women are at a disadvantage in terms of entry and (career) opportunities and where stereotypes prevail. Bian et al. (2017), for example, argue that beliefs such as “males are characterized by a higher intellectual ability” or “women are bad at math” discourage women from pursuing prestigious careers in fields such as physics, where brilliance and math skills seem to be particularly valued. If young girls are instilled with the idea that they may be less (science-math) smart than boys, they may shy away from activities that are presumably intended for (science-math) smarter children. Lavy and Sand (2018) demonstrate that even teachers’ biased behaviors in early school years have long-term implications for enrollment in advanced-level math courses in high school and thus for college and occupational choices.
Parents who are themselves inventors can be particularly influential for their children’s choice of STEM fields and careers. Laband and Lentz (1983) explain that parents discuss career plans with their children and even recommend that they pursue particular job opportunities. When these recommendations concern their own occupations, they are accompanied by a transmission of general and specific knowledge about the job, which in turn increases the probability that their children will choose and succeed in those occupations (Laband and Lentz 1992). In the context of innovation, parents can give advice about becoming or being an inventor, transmit knowledge about it, facilitate networking with people in such jobs, or pass on their enthusiasm for creative and innovation tasks (Adamic and Filiz 2016, de Vaan and Stuart 2019). This transmission, however, can be affected by the gender of the child. As mentioned, because of the interpretation that parents make of external information, such as field- or job-related gender unbalances and stereotypes, they associate children’s gender with different investment returns from different professions (Becker 1991). Parents’ expectations about these returns from investment in their children influence their behaviors. Parents might, for instance, attribute higher returns to sons compared with daughters from more male-oriented or male-dominated occupations or from occupations in which they themselves have seen more men than women succeed. Most inventors are male, and women appear to be disadvantaged in terms of the probability of obtaining a patent for their inventions (Jensen et al. 2018) and are rewarded and paid less for work of quality comparable to that of men (Toivanen and Väänänen 2016, Hoisl and Mariani 2017). As a consequence, parents might invest differently in boys and girls based on their expectations. This has, for instance, been shown to be the case in entrepreneurship (Mishkin 2021).
In summary, the decision of young adults to pursue a specific field of study, professional activity (in our case inventorship), or career path is the outcome of a series of choices made since childhood. Parents play a special role in this process, as they provide nurturing factors that naturally spill over to their offspring, for example, by providing a conducive family environment or acting as role models. In addition, they can influence children’s choices through their decisions and behaviors that implicitly mirror their beliefs and subjective interpretation of external information. In the case of inventorship, the influence of parents as intermediaries of external information can be considered particularly salient if one or both parents are inventors themselves and are therefore aware of the characteristics of the inventive context.
3. Context, Data Sources, and Variables
3.1. Context of Denmark
We use data on the population of Denmark, a modern, open, and small economy (although the 36th largest national economy in the world in terms of gross domestic product in 2019) with a comfortable living standard, an above-average nominal gross national income per capita, and free education at all levels, implying that family budgets as such do not limit educational opportunities. Gender equality is regarded as high in Denmark. Earning 77.4/100 points in the Gender Equality Index 2020 (Gender Equality Index 2021), Denmark ranks second in Europe (after Sweden) for gender equality. In Denmark, women can potentially balance family and career given that nurseries and kindergartens are state subsidized. In other words, mothers do not have to be homebound. These characteristics should be taken into account when transferring our findings to other contexts. However, the results that we will describe in the following are likely a lower bound; that is, gender differences, if any, are likely to be higher in other countries that are characterized by lower gender equality than Denmark.
3.2. Data Source and Sample
Our study leverages information from Statistics Denmark and PATSTAT, a database of the European Patent Office (EPO) that contains bibliographical and legal event data from more than 40 patent authorities worldwide. We combine Statistics Denmark registry data for the resident population of Denmark, including detailed educational and family-related information, with EP patent applications data. To identify the population of Danish inventors, we select patent applications with at least one Danish resident inventor. We then disambiguate name and private address information of the inventors listed on the patents and search for this information in the registry data. Because of anonymity concerns, the actual match is performed by Statistics Denmark. If no match is found, they search for individuals by name among the employees of (one of) the Danish patent assignee(s). Of all inventors with a Danish address in the patent document, 87% can be matched with the registry data.2 This is in line with the 88% match rate obtained by Bell et al. (2019) when linking U.S. Patent Office (USPTO) inventors to their tax records.
The gross population considered in our study consists of all individuals in Denmark, born between 1966 and 1985 and listed as residents in the government registry at age 19 (1,351,394 individuals), the relevant age for graduating from secondary education (high school level). Individuals are classified as female or male based on registry information provided by Statistics Denmark. By beginning the analysis with the 1966 birth cohort, we obtain near-complete registry information on parental educational background and family composition, such as whether individuals spent their childhood with one or both parents. We consider the year in which a person turned 15 as the age when decisions about high school attendance and high school track are likely to be made. We extract other family-related information for this particular year, such as income and municipality of residence. We end the construction of the database with the 1985 cohort because we need a sufficiently long ex post time window to observe a focal individual’s completed education and (early) professional life to determine whether s/he becomes an inventor. Individuals in the 1985 cohort reached the age of 30 in 2015, the year in which our sampling of patents ends.3
In the end, we have complete information on the variables described in Table 1 (Panel A) for 1,191,849 individuals (88% of the gross population of 1,351,394 individuals). We refer to these individuals as the full population. The overall sample is fairly balanced in terms of gender composition: 49% of the individuals are female; 51% are male. Table 1 reports additional descriptive statistics for three subpopulations selected on relevant educational stages toward inventorship: high school completers (Table 1), graduates from tertiary education (Table 1), and graduates from STEM tertiary education (Table 1). The tertiary level of education in the Danish education system relates to education completed at the level of a university bachelor’s degree or higher (MS or PhD level) or a professional bachelor’s degree (including, e.g., engineering and nursing colleges).
|

Table 1. Descriptive Statistics: Full Population and Subsamples of Individuals by Level of Education
| Meanall | Meanwomen | Meanmen | Difference | t value | |||
|---|---|---|---|---|---|---|---|
| Panel A: Full population (Nall = 1,191,849; Nwomen = 579,676; Nmen= 612,173) | |||||||
| Inventorship | 0.0039 | 0.0012 | 0.0064 | 0.0052*** | 45.84 | ||
| Lived with parents at age 15 | |||||||
| Lived with both parents or one parent and a step-parent | 0.8413 | 0.8387 | 0.8438 | 0.0052*** | 7.71 | ||
| Lived with single mother | 0.1314 | 0.1378 | 0.1253 | 0.0125*** | 20.20 | ||
| Lived with single father | 0.0273 | 0.0236 | 0.0309 | 0.0073*** | 24.59 | ||
| Real disposable income (logs) | 12.4087 | 12.4035 | 12.4137 | 0.0102*** | 12.78 | ||
| Mother BSc | 0.2108 | 0.2096 | 0.2119 | 0.0023*** | 3.11 | ||
| Mother STEM | 0.0277 | 0.0279 | 0.0275 | 0.0004 | 1.32 | ||
| Father BSc | 0.1900 | 0.1893 | 0.1907 | 0.0013* | 1.87 | ||
| Father STEM | 0.1392 | 0.1386 | 0.1397 | 0.0012* | 1.85 | ||
| Mother inventor | 0.0003 | 0.0003 | 0.0003 | 0.0000 | 0.72 | ||
| Father inventor | 0.0050 | 0.0051 | 0.0049 | 0.0002* | 1.76 | ||
| Panel B: High school completers (Nall = 586,620; Nwomen = 337,781; Nmen= 248,839) | |||||||
| Inventorship | 0.0067 | 0.0020 | 0.0131 | 0.0111*** | 51.82 | ||
| GPA | 8.2169 | 8.1984 | 8.2443 | 0.0459*** | 15.66 | ||
| High-school track | |||||||
| Math | 0.3107 | 0.2501 | 0.3931 | 0.1430*** | 118.31 | ||
| Language | 0.1859 | 0.2547 | 0.0926 | 0.1620*** | 161.10 | ||
| Technical | 0.0503 | 0.0135 | 0.1002 | 0.0867*** | 153.13 | ||
| Other | 0.4531 | 0.4817 | 0.4141 | 0.0676*** | 51.52 | ||
| Panel C: Tertiary education completers (Nall = 354,963; Nwomen = 210,277; Nmen= 144,686) | |||||||
| Inventorship | 0.0104 | 0.0030 | 0.0211 | 0.0182*** | 52.78 | ||
| GPA | 8.4503 | 8.3996 | 8.5315 | 0.1319*** | 38.09 | ||
| High school track | |||||||
| Math | 0.3991 | 0.3271 | 0.5037 | 0.1766*** | 107.27 | ||
| Language | 0.2248 | 0.3073 | 0.1050 | 0.2023*** | 146.05 | ||
| Technical | 0.0489 | 0.0136 | 0.1001 | 0.0865*** | 119.81 | ||
| Other | 0.3273 | 0.3521 | 0.2913 | 0.0608*** | 38.02 | ||
| Field of tertiary education | |||||||
| Science | 0.0581 | 0.0384 | 0.0866 | 0.0483*** | 60.75 | ||
| Engineer | 0.1219 | 0.0510 | 0.2250 | 0.1740*** | 161.27 | ||
| Food/agriculture | 0.0219 | 0.0270 | 0.0144 | 0.0127*** | 25.36 | ||
| Health | 0.1638 | 0.2338 | 0.0621 | 0.1717*** | 139.47 | ||
| Other | 0.6344 | 0.6498 | 0.6119 | 0.0379*** | 23.07 | ||
| Level of tertiary education | |||||||
| BSc | 0.5760 | 0.6404 | 0.4824 | 0.1580*** | 94.78 | ||
| MSc | 0.3970 | 0.3416 | 0.4774 | 0.1358*** | 82.03 | ||
| PhD/Dr | 0.0270 | 0.0179 | 0.0401 | 0.0222*** | 40.22 | ||
| Panel D: STEM tertiary education completers (Nall = 71,640; Nwomen = 27,474; Nmen= 47,166) | |||||||
| Inventorship | 0.0440 | 0.0181 | 0.0575 | 0.0393*** | 24.44 | ||
| GPA | 8.6331 | 8.7094 | 8.5874 | 0.1220*** | 16.40 | ||
| High school track | |||||||
| Math | 0.6445 | 0.6506 | 0.6414 | 0.0092** | 2.44 | ||
| Language | 0.0619 | 0.1343 | 0.0243 | 0.1101*** | 59.40 | ||
| Technical | 0.1731 | 0.0571 | 0.2333 | 0.1762*** | 60.62 | ||
| Other | 0.1205 | 0.1580 | 0.1011 | 0.0569*** | 22.28 | ||
| Field of tertiary education | |||||||
| Science | 0.2876 | 0.3297 | 0.2658 | 0.0639*** | 17.96 | ||
| Engineer | 0.6041 | 0.4383 | 0.6902 | 0.2519*** | 67.42 | ||
| Food/agriculture | 0.1083 | 0.2320 | 0.0440 | 0.1880*** | 80.18 | ||
| Level of tertiary education | |||||||
| BSc | 0.4080 | 0.3582 | 0.4339 | 0.0756*** | 19.59 | ||
| MSc | 0.5224 | 0.5775 | 0.4938 | 0.0837*** | 21.33 | ||
| PhD/Dr | 0.0696 | 0.0643 | 0.0723 | 0.0080*** | 4.00 | ||
Notes. Summary statistics are reported for the full population, the subsample of high school completers, the subsample of tertiary education (BSc+) completers, and the subsample of STEM tertiary education (BSc+ STEM) completers. The number of available observations varies across variables. We report mean values for the full population, women, and men separately, differences in means between women and men, and t-tests for the comparison of means between women and men. Full summary statistics for all subsamples are in Online Appendix A1.
*p < 0.1; **p < 0.05; ***p < 0.01.
3.3. Description of the Variables
3.3.1. Dependent Variables.
Our main outcome variable is inventorship, which, following existing literature (Toivanen and Väänänen 2016, Aghion et al. 2018, Bell et al. 2019), equals one if an individual is listed as an inventor with a DK country code on at least one EP application in the period 1978 (the founding year of the EPO) to 2015 and zero otherwise.4 Following Bell et al. (2019), we base the definition of inventors on the full set of patent applications filed as an indicator of inventive activity. The total number of inventors identified in the full population is 4,626, which corresponds to an incidence rate of about four inventors per thousand.5
To investigate the mechanisms underlying the role of parents for the probability of children of becoming inventors, we use dependent variables that track the educational trajectories of children. In the Danish education system, high school education is secondary education that begins around age 15 and potentially qualifies students to enter university or, more generally, tertiary education (such as engineering college). This group excludes vocational training and apprenticeships. For the cohorts considered in this study, high school completers can be divided into four tracks: math (math-track high school), language (language-track high school), tech (technical-track high school), and other (business track, a so-called higher preparatory track, or an international baccalaureate track). We code the variable Math-tech high-school track as one if an individual completed high school in a math or tech track and zero otherwise. Although not all types of tertiary education would be accessible to graduates from a particular high school track, most students would be able to formally qualify for access through supplementary courses in addition to their high school diploma. In recent years, access to some tertiary education programs has been increasingly restricted in terms of grade point average (GPA) requirements.6
Finally, the variable STEM BSc+ equals one if the individual completed tertiary education in a STEM field (i.e., science, engineering, and food and agricultural sciences) and zero otherwise.
Figure 1(a) compares the inventor propensities of men and women for the full population and for the three subpopulations of high school completers, graduates from tertiary education in any field, and graduates from STEM tertiary education. The inventor gender gap is about five inventors per thousand in the full population. In relative terms, men in the full population are five times as likely as women to become inventors as shown by the odds ratio (the leftmost bar in Figure 1(b)). For individuals with a completed tertiary degree in a STEM field, the odds ratio diminishes, although men remain three times as likely as women to become inventors.
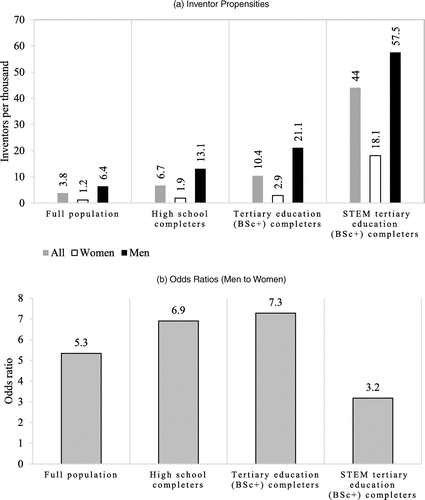
Notes. (a) Number of inventors per thousand in the full population and in the three subpopulations of individuals who completed high school, completed a BSc+ degree, or completed a BSc+ degree in a STEM field, for all individuals and separately for women and men. (b) Corresponding odds ratios (the ratio of the inventor propensities of men and women) for the same (sub)populations.
3.3.2. Covariates.
Our core explanatory variable is Parental inventor status, which takes the value of one if either of the legal parents is an inventor or both legal parents are inventors and zero otherwise. In the analysis of the mechanisms, we use Mother (Father) inventor separately, which takes the value of one if the legal mother (father) of the individual is an inventor and zero otherwise. The gender composition of inventors in the parent generation is strongly skewed toward fathers (the incidence is less than 0.1% for mothers and 0.5% for fathers; Table 1, Panel A).
The level and field of parental education is measured using the following indicators, which we build separately for mothers and fathers. Mother (Father) BSc+ takes the value of one if the legal mother (father) of the individual has a degree at the bachelor’s level or above and zero otherwise; Mother (Father) STEM takes the value of one if the legal mother (father) of the individual has a degree in a STEM field and zero otherwise. Twenty-one percent of mothers and 19% of fathers have a bachelor’s level of education or higher; less than 3% of the mothers have a STEM degree, whereas 14% of fathers do (Table 1, Panel A). We add these variables to the regressions to control for the role of parental education on the educational trajectories of children (level and field of study) and, ultimately, on the probability of becoming an inventor. Between-gender differences for parental background variables are minor and mostly not significant at the 5% significance level (Table 1, Panel A).
We include control variables at the individual level for the following factors. Family-related controls are constructed with respect to each individual in the 1966–1985 cohorts as follows: Lived with parents at age 15 takes three values: (1) Lived with both parents, or one parent and a step-parent (reference category) if individuals lived with both their legal parents, with their father and a stepmother, or with their mother and a stepfather; (2) Lived with single mother, if they lived with a single mother; and (3) Lived with single father, if they lived with a single father.7 About 84% lived with two parents at the age of 15, whereas 13% (3%) of the individuals lived with a single mother (father) (Table 1, Panel A). We add dummies for each category except for the reference group to control for the type of parental attention and inputs (Bertrand and Pan 2013). We control for real disposable income, that is, family disposable income measured in real 2000 Danish Kroner (DKK) terms (and logged), a proxy for the financial resources a family had at its disposal. We control for a family’s resources because, for example, wealthier families can provide a better education or complementary sources of learning to their children than poorer families, or they can afford to keep children in school longer. Average household disposable income differs marginally between the families of daughters and sons. The differences are statistically significant at the 1% level in the full population, although they are small, with the disposable income of families with sons exceeding that of families with daughters by 1%.
In selected regressions that consider the sample of individuals who graduated from educations above high school level, we control for GPA, calculated by adding all grades received and dividing by the number of classes taken in high school. For the cohorts considered in this study, it is measured on a scale from 0 to 13, with 6 being the passing grade. We find slightly higher GPAs for men than for women among high school completers (Table 1, Panel B); the relationship reverses for individuals with a STEM tertiary education (Table 1, Panel D). For the subsample of inventors, women have on average slightly higher GPAs than men (9.09 versus 8.89, as shown in the online appendix, Table A1; the difference is significant at the 5% significance level).8
We also control for the type of education individuals received, as the variable high school track is included in regression models for the sample of individuals with a degree above the high school level. It controls for the high school track chosen, that is, math, language, technical, and other, with math being the reference case.
The field of tertiary education is controlled for in the sample of individuals with a degree at the tertiary educational level. The variable takes five different values: science (natural sciences), engineer (engineering), food/agriculture (food and agricultural sciences), health (health sciences), and other (other fields). For the sample of individuals who completed a STEM degree at the BSc+ level, we include the categories science, engineer, and food/agriculture, with engineer as the reference category. We add dummies for each category except for the reference group, since a degree in a STEM field increases the probability of becoming an inventor (i.e., of producing a technical invention).
The variable level of tertiary education is included in regression models that use the sample of individuals with a degree at or above the tertiary educational level, and it controls for the level of education completed. The variable takes three different values: BSc (university bachelor’s or professional bachelor’s degree, reference category), MSc (master’s degree), and PhD/Dr (PhD degree or doctoral degree). Education provides a key asset for becoming an inventor. According to Hoisl and Mariani (2017), 61% of European inventors in the InnoS&T survey have a BSc or an MSc degree, and 29% hold a PhD. The corresponding number for the DK inventors in our full population are very similar, with 57% having a BSc or MSc degree and 27% having a PhD (online appendix, Table A1).
All regressions control for the municipality of residence at age 15 with municipality dummies (reference: Copenhagen). Municipality dummies are added to the regression to control for the outside-family environment or the neighborhood the individuals live in (Bell et al. 2019), as different neighborhoods vary in school quality, or in the general spillovers that individuals can absorb from external sources. Finally, we include dummies for the birth year of the focal individual (reference year is 1976) to control for possible cohort effects for the probability of boys and girls entering an inventive job.9
4. Empirical Strategy: Parental Transmission of Inventorship
The main challenge in estimating the impact of parental inventorship on sons’ and daughters’ probability of becoming inventors based on cross-sectional analysis is that the effect may be confounded by other factors, such as parents’ educational backgrounds and networks. To limit this concern, we follow a twofold strategy.
First, we control for a number of observable attributes that are likely correlates of parental inventorship and that potentially affect a child’s propensity to become an inventor, including the parents’ financial resources, their level and field of education, and the municipality of residence of the family. We hence consider the effect of parental inventorship on top of these observable factors.
Second, we follow the approach of Peter et al. (2018), Brenøe (2021), and Mishkin (2021) and use an experimental approach that arises naturally from sibling gender composition, exploiting the random occurrence of the gender of a second-born sibling. Specifically, we examine whether parental inventorship translates into a first-born child’s probability of becoming an inventor, depending on the gender of the second-born sibling, that is, whether a first-born child receives a sister or a brother.
The rationale for using sibling gender composition as a natural experiment to identify potentially gendered effects in the intergenerational transmission of inventorship is that the gender of the second-born child represents an exogenous random occurrence in the family environment of the first-born child. In other words, it is independent of families’ idiosyncratic differences, including pre-existing gender preferences, as well as the first-born child’s taste for, attitudes toward, or talent for science and technology. We compare first-borns of the same gender and leverage the random occurrence of the gender of a second-born child. We argue that any systematic difference in the estimated impact of parental inventorship between first-borns with a second-born sister or brother is causally associated with the gender of the second-born sibling. We analyze first-born daughters and sons separately.
In addition to providing exogenous variations in the family environment, sibling composition is also relevant for the intergenerational transmission of inventorship and the extent to which this transmission is gendered. The literature shows that parents’ behaviors differ when they have same-gender versus mixed-gender children. On one hand, daughters might benefit from the presence of brothers because families with sons tend to be more stable, and fathers, if they (also) have a son, show higher involvement with children (Morgan et al. 1988, Dahl and Moretti 2008). On the other hand, parents with mixed-gender children are likely to adopt different (gendered) specialized parenting behaviors and choices compared with parents with same-gender children (see Brenøe 2021 and Cools and Patacchini 2019 for a review of relevant contributions). Mixed-gender children may even unlock parents’ gender-dependent unequal attitudes toward their children that lie dormant on the birth of a first-born daughter and would remain latent for same-gender siblings (Dahl and Moretti 2008, Rao and Chatterjee 2018, Blau et al. 2020, Brenøe 2021). A second-born son may also rationally distract parents’ resources, time commitment, and expectations from his older sister. This is, for example, because there are different expectations about the potential returns to boys compared with girls from certain activities, such as their choice of occupations. This dilution of attention and commitment can affect the educational choices of first-born girls, especially the choice of STEM fields (Oguzoglu and Ozbeklik 2016), as well as professional activity-related transmission between parents and children (Mishkin 2021).
Despite the merits of the sibling experiment, we face the challenge of interpreting the estimate of the parental inventorship transmission effect. In fact, even if we control for other meaningful factors in the regressions, potential confounders might still correlate with parental inventorship and impact first-borns differently depending on the gender of their second-born sibling. We address the extent to which alternative factors are likely to bias the estimated effect of parental inventorship in Section 5. In addition, the natural experiment allows us to estimate the causal difference in the association of parental and child’s inventorship depending on the gender of the second-born sibling, but it does not tell us why parental inventorship differently affects the probability of daughters and sons to become inventors. It may be, for example, because of the time parents spend with their children or the advice they provide them about job prospects if they are inventors themselves (Laband and Lentz 1983). We explore potential routes through which parental inventorship may potentially contribute to children’s probability to become inventors, such as access to a STEM education, and remain cautious with our claims in interpreting what parental inventorship means for and brings to the children.
5. Results from the Sibling Experiment
We provide results for the effect of parental background on the probability of first-born daughters to become inventors, conditional on the gender of their second-born sibling. We compare the sample of first-born daughters “treated” by the arrival of a brother with a “control” sample of first-born daughters whose second sibling is a sister. We interpret differences between the two samples in the effect of parental inventorship on the probability of first-born daughters becoming inventors as a causal effect of the gender of the second-born.
The sample of observations for the main analysis consists of first-born daughters who have at least one sibling born within four years.10 We use a maximum age difference of four years between the first and second sibling, such that if a dilution of parental effects takes place because of the arrival of the second-born sibling, this dilution should begin early and have large and long-term effects. To check whether the chosen age difference drives our results, we conduct robustness checks with a longer time window (Table 4, Panel B). Moreover, to limit the role of confounding factors, for example, from intersibling differences in parental composition or family disruption, we restrict the analysis to full siblings, that is, siblings who have the same legal parents. For the same purpose of keeping the research design as clean as possible, we focus on the probability of first-born daughters (or sons) to become inventors, conditional on the gender of the second-born sibling, instead of, for example, doing the opposite, such as investigating the destiny of the second-born conditional on the gender of the first-born child. Focusing on first-borns allows us to have the same initial conditions across families, as they are untreated by the arrival of a previous child. Otherwise, the gender of the first-born might create specific family dynamics and preferences that could influence the potential of the second-born child to become an inventor.11
The 122,709 first-born daughters in this sample account for 21% of the women in the 1966–1985 cohorts. Of these, 62,596 received a second-born brother and 60,113 received a second-born sister. Table A2 (Panel A) in the online appendix shows that there are hardly any statistically significant differences in terms of predetermined family and parental characteristics across families in these two samples.12 This provides support for the idea that the gender of the second-born child is indeed random with respect to these characteristics. Only the age of parents on the birth of their first-born daughter is slightly higher if the second-born is a girl rather than a boy, but the absolute difference is negligible (about 20 days for mothers, 23 days for fathers). Consistent with previous contributions (Angrist and Evans 1998), we find (Table 4, Panel B) that families on average grow larger if the first two children are girls than if they have a girl first and then a boy. We discuss later how, through family size, sibling gender can affect the parental time and material resources available to each child. In supplementary analysis, we control for family size and parental age (Table 4, Panel A).
The results of the sibling experiment are provided in Table 2. Inventorship is the dependent variable. Model 1 shows the estimation for the full sample of women in the population (579,676 individuals) as a reference. Model 2 uses the subsample of 122,709 first-born daughters with siblings, and the last two columns split the sample into first-born daughters with a second-born brother (Model 3) or a second-born sister (Model 4).13
|
Table 2. Inventorship: Effect of the Gender of the Second-Born Sibling on First-Born Women (Split-Sample Analysis)
| Sample | Model 1 | Model 2 | Model 3 | Model 4 |
|---|---|---|---|---|
| Full population of women | All first-born women with siblings | First-born women with a second-born brother | First-born women with a second-born sister | |
| Lived with parents at age 15 (reference group: Lived with both parents or one parent and a step-parent) | ||||
| Lived with single mother | 0.0001 | 0.0003 | 0.0004 | 0.0003 |
| (0.0001) | (0.0005) | (0.0006) | (0.0007) | |
| Lived with single father | 0.0006* | 0.0010 | 0.0002 | 0.0018 |
| (0.0003) | (0.0009) | (0.0010) | (0.0015) | |
| Real disposable | 0.0003*** | 0.0003* | 0.0003 | 0.0003 |
| income (logs) | (0.0001) | (0.0002) | (0.0002) | (0.0002) |
| Field and level of parental education (reference group: no BSc; no STEM) | ||||
| Mother (no BSc; STEM) | 0.0009*** | 0.0011*** | 0.0013** | 0.0009* |
| (0.0002) | (0.0004) | (0.0005) | (0.0005) | |
| Mother (BSc; no STEM) | 0.0011*** | 0.0015* | 0.0016 | 0.0012 |
| (0.0004) | (0.0009) | (0.0013) | (0.0012) | |
| Mother (BSc; STEM) | 0.0039*** | 0.0065** | 0.0048 | 0.0084* |
| (0.0013) | (0.0031) | (0.0038) | (0.0050) | |
| Father (no BSc; STEM) | 0.0011*** | 0.0016*** | 0.0006 | 0.0025*** |
| (0.0002) | (0.0005) | (0.0006) | (0.0007) | |
| Father (BSc; no STEM) | 0.0002 | 0.0002 | 0.0002 | 0.0003 |
| (0.0001) | (0.0003) | (0.0005) | (0.0005) | |
| Father (BSc; STEM) | 0.0037*** | 0.0054*** | 0.0054*** | 0.0054*** |
| (0.0004) | (0.0009) | (0.0013) | (0.0013) | |
| Parental inventor status | 0.0072*** | 0.0074* | 0.0002 | 0.0154** |
| (0.0018) | (0.0039) | (0.0034) | (0.0071) | |
| Municipality dummies | Yes | Yes | Yes | Yes |
| Year-of-birth dummies | Yes | Yes | Yes | Yes |
| Constant | 0.0003 | 0.0005 | −0.0009 | 0.0019 |
| (0.0003) | (0.0008) | (0.0008) | (0.0014) | |
| Observations | 579,676 | 122,709 | 62,596 | 60,113 |
| R2 | 0.0024 | 0.0052 | 0.0074 | 0.0083 |
Notes. Ordinary least squares (OLS) OLS regressions. The dependent variable is inventorship, a dummy variable that takes the value of one if the person has applied for at least one patent. Parental inventor status is a dummy variable equal to one if at least one parent applied for a patent. Indicators for parents’ field and level of education are included separately for mothers and fathers. Model 1: Full population of women (for reference). Model 2: First-born women with a second-born sibling born within four years. Model 3: First-born women with a second-born brother born within four years. Model 4: First-born women with a second-born sister born within four years. Corresponding results for a fully interacted joint specification are reported in the Online Appendix, Table A4. Robust standard errors are in parentheses.
*p < 0.1; **p < 0.05; ***p < 0.01.
The results from Model 1 show that, for the full population of women, parental STEM background and parental inventorship correlate positively with the probability of daughters becoming inventors. Results in Model 2, restricted to the sample of first-born daughters, remain largely unchanged, suggesting that the sample of first-born girls does not behave differently from the general population of women in terms of correlations with core covariates. In particular, in both models the coefficient of parental inventor status, which compares daughters with an inventor parent with daughters without an inventor parent, is positive and statistically significant for women’s probability of being inventors (p < 0.01 and p < 0.10, respectively). The estimated coefficient equals approximately seven more inventors per thousand girls. This corresponds to about six times the incidence rate of inventorship in the full population of women. Similarly, a parental STEM background correlates positively with daughters’ propensity to become inventors.
Models 3 and 4 provide the split-sample results for first-born girls who have either a second-born brother or sister. The estimated effects are summarized in Figure 2(a). We find that the coefficient of parental inventorship is strikingly different depending on the gender of the second-born child. There is a positive and significant effect of an inventor parent only for first-born daughters with a second-born sister (Model 4); it disappears if the second-born sibling is a brother (Model 3). The difference is statistically significant (p < 0.05). Thus, the arrival of a second-born brother nullifies the possibilities that a first-born daughter will reap the potential benefits of parental inventorship. The difference is also economically sizable, amounting to about 15 more inventors per thousand girls, almost 13 times the incidence rate of inventorship in the full female population.

Notes. The effects of parental inventorship shown in (a) are the coefficients reported in Table 2, Model 2 (all first-born daughters with siblings), Model 3 (first-born daughters with a second-born brother), and Model 4 (first-born daughters with a second-born sister), multiplied by 1,000. The effects of parental educational background in (b) are the corresponding coefficients of mothers (fathers) with a BSc+ STEM education, multiplied by 1,000. *Coefficient is statistically significant at the 5% level; n.s., coefficients that are insignificant at the 5% level.
We find differential effects only for parental inventorship and not for parental STEM background at the bachelor’s level or above (Figure 2(b)). These estimates remain largely stable irrespective of the gender of the second-born sibling: that is, the effects are not statistically significantly different between the two subsamples in Models 3 and 4 (p > 0.10).14
To consider whether the differential effect of parental inventorship is salient only for daughters or whether instead it is a more general effect of mixed-sibling composition, we estimated the same models for first-born sons. The estimated results in Table 3 show that parental educational background in STEM and parental inventorship are positively associated with sons’ probability of becoming inventors. The cross-sectional correlations are generally much larger for boys than for girls.15 For example, the effect of parental inventorship in the full population of first-born boys (Table 3, Model 2) amounts to 30 more inventors per thousand compared with 7 more inventors per thousand for first-born daughters (Table 2, Model 2). However, the effects of parental STEM background and parental inventorship do not change significantly with the gender composition of the siblings for the sample of first-born boys (Figure 3, (a) and (b); Table A4, Model 2 in the online appendix).
|
Table 3. Inventorship: Effect of the Gender of the Second-Born Sibling on First-Born Men (Split-Sample Analysis)
| Sample | Model 1 | Model 2 | Model 3 | Model 4 |
|---|---|---|---|---|
| Full population of men | All first-born men with siblings | First-born men with a second-born sister | First-born men with a second-born brother | |
| Lived with parents at age 15 (reference group: Lived with both parents or one parent and a step-parent) | ||||
| Lived with single mother | 0.0006* | 0.0001 | 0.0012 | 0.0009 |
| (0.0003) | (0.0009) | (0.0012) | (0.0013) | |
| Lived with single father | 0.0009* | 0.0016 | 0.0012 | 0.0024 |
| (0.0005) | (0.0012) | (0.0018) | (0.0016) | |
| Real disposable | 0.0010*** | 0.0011*** | 0.0011*** | 0.0011*** |
| income (logs) | (0.0001) | (0.0003) | (0.0004) | (0.0004) |
| Field and level of parental education (reference group: no BSc+; no STEM) | ||||
| Mother (no BSc; STEM) | 0.0042*** | 0.0054*** | 0.0050*** | 0.0056*** |
| (0.0003) | (0.0008) | (0.0011) | (0.0011) | |
| Mother (BSc; no STEM) | 0.0027*** | 0.0014 | 0.0028 | 0.0001 |
| (0.0008) | (0.0014) | (0.0022) | (0.0018) | |
| Mother (BSc; STEM) | 0.0120*** | 0.0084* | 0.0079 | 0.0087 |
| (0.0023) | (0.0044) | (0.0065) | (0.0060) | |
| Father (no BSc; STEM) | 0.0045*** | 0.0060*** | 0.0066*** | 0.0053*** |
| (0.0004) | (0.0010) | (0.0014) | (0.0013) | |
| Father (BSc; no STEM) | 0.0019*** | 0.0022** | 0.0015 | 0.0028** |
| (0.0004) | (0.0009) | (0.0012) | (0.0012) | |
| Father (BSc; STEM) | 0.0112*** | 0.0130*** | 0.0128*** | 0.0131*** |
| (0.0007) | (0.0016) | (0.0023) | (0.0022) | |
| Parental inventor status | 0.0293*** | 0.0301*** | 0.0338*** | 0.0264*** |
| (0.0036) | (0.0073) | (0.0106) | (0.0100) | |
| Municipality dummies | Yes | Yes | Yes | Yes |
| Year-of-birth dummies | Yes | Yes | Yes | Yes |
| Constant | 0.0010* | 0.0020 | 0.0012 | 0.0029 |
| (0.0006) | (0.0016) | (0.0022) | (0.0022) | |
| Observations | 612,173 | 131,087 | 64,009 | 67,078 |
| R2 | 0.0057 | 0.0079 | 0.0101 | 0.0098 |
Notes. Ordinary least squares regressions. The dependent variable is inventorship, an indicator for having applied for at least one patent. Parental inventor status is a dummy variable that is one if at least one parent applied for a patent. Indicators for parents’ field and level of education are included separately for mothers and fathers. Model 1: Full population of men (for reference). Model 2: First-born men with a second-born sibling born within four years. Model 3 and Model 4 split the sample according to the gender of the second-born sibling. Model 3: First-born men with a second-born sister born within four years. Model 4: First-born men with a second-born brother born within four years. Corresponding results for a fully interacted joint specification are reported in the online appendix, Table A4. Robust standard errors are in parentheses.
*p < 0.1; **p < 0.05; ***p < 0.01.

Notes. The effects of parental inventorship shown in (a) are the coefficients reported in Table 3, Model 2 (all first-born sons with siblings), Model 3 (first-born sons with a second-born sister), and Model 4 (first-born sons with a second-born brother), multiplied by 1,000. The effects of parental educational background in (b) are the corresponding coefficients of mothers (fathers) with a BSc+ STEM education, multiplied by 1,000. *, coefficient is statistically significant at the 5% level; n.s., coefficients that are insignificant at the 5% level.
In summary, for the subsample of first-born girls, the difference in estimated coefficients between the two groups—girls with brothers or sisters (Models 3 and 4 in Table 2)—reflects a crowding-out of benefits from parental inventor background because of the arrival of a brother. The benefits from parental inventorship are completely diluted or diverted by the presence of a younger brother. For first-born boys, in contrast, there is no such difference. The fact that the gender of the second-born sibling is random excludes the possibility that the difference can be explained by systematic family differences or differences in innate abilities, skills, or preferences among first-borns in these comparisons.
We checked the robustness of the findings of the sibling experiment with the specifications displayed in Table 4 (Panels A–E).16 Inventorship is used as the dependent variable in all five panels. Although we only report the coefficients of parental STEM BSc+ background and parental inventorship, the specifications include the same regressors as in Table 2. The full results are shown in Table A6 in the online appendix.
|
Table 4. Inventorship: Effect of the Gender of the Second-Born Sibling on First-Born Women (Split-Sample Analysis: Alternative Specifications)
| Sample | Model 1 | Model 2 | Model 3 |
|---|---|---|---|
| All first-born women with siblings | First-born women with a second-born brother | First-born women with a second-born sister | |
| Panel A: Additional controls for family size and mother’s and father’s age at first childbirth | |||
| Mother (BSc, STEM) | 0.0063** | 0.0046 | 0.0083 |
| (0.0031) | (0.0038) | (0.0051) | |
| Father (BSc; STEM) | 0.0052*** | 0.0053*** | 0.0052*** |
| (0.0009) | (0.0013) | (0.0013) | |
| Parental inventor status | 0.0073* | 0.0002 | 0.0153** |
| (0.0039) | (0.0034) | (0.0071) | |
| Standard controls | Yes | Yes | Yes |
| Family-size dummies | Yes | Yes | Yes |
| Mother’s age | Yes | Yes | Yes |
| Father’s age | Yes | Yes | Yes |
| Constant | 0.0018 | 0.0031** | 0.0003 |
| (0.0012) | (0.0016) | (0.0018) | |
| Observations | 121,724 | 62,082 | 59,642 |
| R2 | 0.0054 | 0.0077 | 0.0085 |
| Panel B: Sample of first-born women with next-born sibling within eight years | |||
| Mother (BSc; STEM) | 0.0052** | 0.0053 | 0.0053 |
| (0.0025) | (0.0035) | (0.0037) | |
| Father (BSc; STEM) | 0.0052*** | 0.0056*** | 0.0048*** |
| (0.0008) | (0.0011) | (0.0011) | |
| Parental inventor status | 0.0074** | 0.0035 | 0.0115** |
| (0.0032) | (0.0038) | (0.0053) | |
| Standard controls | Yes | Yes | Yes |
| Constant | 0.0004 | 0.0001 | 0.0010 |
| (0.0006) | (0.0008) | (0.0010) | |
| Observations | 172,240 | 88,047 | 84,193 |
| R2 | 0.0041 | 0.0058 | 0.0058 |
| Panel C: Additional controls for type of parental occupation and industry | |||
| Mother (BSc; STEM) | 0.0069* | 0.0060 | 0.0081 |
| (0.0041) | (0.0053) | (0.0063) | |
| Father (BSc; STEM) | 0.0061*** | 0.0055*** | 0.0066*** |
| (0.0011) | (0.0015) | (0.0017) | |
| Parental inventor status | 0.0091* | 0.0000 | 0.0192** |
| (0.0047) | (0.0042) | (0.0086) | |
| Standard controls | Yes | Yes | Yes |
| Parental occupation dummies | Yes | Yes | Yes |
| Parental industry-affiliation dummies | Yes | Yes | Yes |
| Constant | 0.0038** | 0.0028 | 0.0047* |
| (0.0019) | (0.0026) | (0.0028) | |
| Observations | 88,539 | 45,243 | 43,296 |
| R2 | 0.0078 | 0.0119 | 0.0131 |
| Panel D: Sample of birth cohorts 1966–1975 | |||
| Mother (BSc; STEM) | 0.0016 | 0.0000 | 0.0036 |
| (0.0038) | (0.0041) | (0.0066) | |
| Father (BSc; STEM) | 0.0060*** | 0.0066*** | 0.0056*** |
| (0.0013) | (0.0018) | (0.0018) | |
| Parental inventor status | 0.0146** | 0.0018 | 0.0283** |
| (0.0068) | (0.0062) | (0.0122) | |
| Standard controls | Yes | Yes | Yes |
| Constant | 0.0000 | 0.0002 | −0.0003 |
| (0.0010) | (0.0013) | (0.0016) | |
| Observations | 72,217 | 36,831 | 35,386 |
| R2 | 0.0077 | 0.0117 | 0.0127 |
| Panel E: Logistic model | |||
| Mother (BSc; STEM) | 1.4241*** | 1.4746*** | 1.4870*** |
| (0.3673) | (0.5572) | (0.5177) | |
| Father (BSc; STEM) | 1.6698*** | 1.7149*** | 1.7172*** |
| (0.1974) | (0.2776) | (0.2788) | |
| Parental inventor status | 0.8755** | 0.1491 | 1.5201*** |
| (0.3605) | (0.7651) | (0.4358) | |
| Controls | Yes | Yes | Yes |
| Constant | 7.3036*** | 8.6784*** | 6.6306*** |
| (0.5242) | (0.9998) | (0.6375) | |
| Observations | 73,146 | 23,676 | 25,350 |
| Pseudo R2 | 0.1070 | 0.1337 | 0.1295 |
Notes. Ordinary least squares regressions (Panels A–D) and logistic regression (Panel E). Next-born sibling is born within four years (Panels A and C–E) or eight years (Panel B). The dependent variable is inventorship, an indicator for having applied for at least one patent. Parental inventor status is a dummy variable equal to one if at least one parent applied for a patent. Controls include the full set of indicators included in Table 2 for parents’ field and level of education separately for mothers and fathers (reference category: lower than bachelor’s level, not in a STEM field), municipality dummies, year-of-birth dummies, indicators for whether the individual lived with their parents at age 15, and family real disposable income (logs). Family-size dummies (Panel A) control for number of children. We include individual dummies for each number of children. Parental occupation dummies (Panel C) are indicators for the following categories: Employers/self-employed/assisting spouses, managers, upper-level professionals, intermediate-level professionals, skilled manual workers, unskilled manual workers, other workers, unemployed/pensioners/in education (eight categories). Parental industry affiliation dummies (Panel C) are indicators for the following: agriculture, fishing, quarrying; manufacturing; electricity, gas and water supply; construction; wholesale and retail trade, hotels, restaurants; transport, post and telecommunications; finance and business activities; public and personal services; activity not stated (nine categories). Model 1: All first-born women with a second-born sibling. Models 2 and 3 split the sample according to the gender of the second-born sibling. Model 2: First-born women with a second-born brother. Model 3: First-born women with a second-born sister. Corresponding results for a fully interacted joint specification are reported in the online appendix, Table A6. Robust standard errors are in parentheses.
***p < 0.01; **p < 0.05; *p < 0.1.
In each panel in Table 4, Model 1 shows the estimated results for the sample of first-born daughters irrespective of the gender of their second-born sibling. Models 2 and 3 show the results for the samples of first-born daughters with a second-born brother or a second-born sister, respectively.
Panel A in Table 4 illustrates the results from a specification that controls for the number of children in the family of the focal individual and the age of the mother and the father at the birth of the first child, in addition to variables included in Table 2. We control for the age of the parents because it can correlate with different stages in parents’ professional life and therefore with the time they might dedicate to and the knowledge they can transfer to their children. We control for family size because differences in family size are found to be correlated with sibling composition (Angrist and Evans 1998, Brenøe 2021). If family size has an independent effect on gender conformity, it may also affect girls’ propensity to become an inventor and thus be a potential confounder of the parental inventor effect. Two considerations should be made with respect to the inclusion of these control variables in the regressions. First, these family characteristics challenge the interpretation of our main result only if they are correlated with parental inventorship. Second, we would expect any effect of family size to go in the opposite direction to what we observe in the estimated results. Our data show that a second-born brother would imply a smaller family size on average (online appendix, Table A2). This would allow more attention and resources to all children, including the first-born girl, because attention and resources would have to be shared by fewer children. Thus, if family size explained our results for first-born daughters with brothers, we would expect them to be more likely to become inventors. In fact, Panel 1 in Table A2 shows that the results from this specification are robust and very similar in size to those in Table 2. We still find the crowding-out of benefits from parental inventorship when a brother is born to a first-born daughter.
In Panel B in Table 4, we estimate the same regressions as in Table 2 but allow for a maximum time window of eight years instead of four years between the births of the first and second children. As expected, we find a milder degree of dilution of parental inventorship effects, consistent with the fact that first-born daughters have, on average, enjoyed a longer period of childhood without a younger brother.
Panel C in Table 4 shows the results from a specification that controls for parents’ occupation and industry in addition to the variables included in Table 2. It is known that parents’ occupation is passed on to children to some extent (Laband and Lentz 1983, 1992; Mishkin 2021) and that certain industries are more conducive to inventorship than others (Cohen et al. 2000). Hence, we want to rule out the possibility that the differential parental effects that we estimate for first-born girls with brothers compared with sisters are because of the intergenerational transmission of other occupational characteristics, such as the type and sector of activity of the parents. Again, the results remain robust and very similar to the baseline specifications in Table 2, which speaks against confounding effects from parents’ occupation or industry.17
We also address concerns related to the right truncation that results from the data of our latest cohorts ending as early as age 30. We therefore present estimates in Panel D in Table 4 for the sample of people born between 1966 and 1975. Individuals in these cohorts are at least 40 years old at the time we record their patent activity. The estimated results for fathers’ higher education in STEM are similar to those in Table 2, whereas the effects are smaller for mothers’ education in STEM. The effects are instead larger for parental inventorship, consistent with truncation being less likely for inventors in this subsample. Importantly, the asymmetric effect of parental inventorship on the probability that first-born daughters become inventors depending on next-born’s gender remains. This limits the concern that our results are affected by observing fewer female than male inventors because the truncation affects women more severely than men due to women’s professional life following different timings, for example, because of pregnancy and maternity leave.18 The fact that our study investigates entry into inventorship instead of, for example, the number of patents produced by women and men within a certain time window, or other types of productivity measures, also limits concerns that career breaks or other factors that come into play after entry into the labor market drive our results.
Finally, Panel E in Table 4 shows the outcomes of an alternative estimator. Whereas we use linear regressions models throughout the study to facilitate the interpretation of our results, we perform a logit regression to check that our results are not driven by the model specification.19 Again, our results about the crowding-out effect because of the arrival of a second-born brother rather than a sister remain robust.
The results of supplementary regressions with inventorship of the second-born individual as the outcome are in Table A8 (split-sample) and Table A9 (interacted models) of the online appendix. Comparing the outcomes of second-born girls who are born to an older brother or sister, we find a strong, negative effect of having an older brother for the probability of second-born daughters to become inventors, consistent with results in Table 2 and Figure 2(a). We find no significant differences for second-born boys, consistent with the findings for first-born boys in Table 3 and Figure 3(a).
6. Exploring the Mechanisms: Children’s Educational Trajectories and the Transition into Inventorship
Turning to the nature of the mechanisms through which parental transmission of inventorship possibly occurs, we go back in time to look at the stages of children’s educational trajectories. We focus on educational outcomes that equip children with the skills necessary to become inventors and describe the role of parental background in the transition from one level to the next of the educational ladder up to the final transition into inventorship. Our objective is to investigate how parental background plays out at each stage, and, ultimately, to understand the origins of the gendered effect of parental inventorship on children’s probability to become inventors.
We use a three-step approach. We first model two educational outcomes: graduating from a science-oriented high school track over other tracks (step 1) and graduating from a STEM field over other fields in tertiary education (step 2). Finally (step 3), we consider the final transition from a STEM bachelor’s degree into inventorship. For this analysis, we consider the full population of individuals born in Denmark between 1966 and 1985. This makes it possible to count on a relatively large number of parents with a STEM or inventor background.
Table 5 shows the results of three regressions for women (Models 1, 3, and 5) and men (Models 2, 4, and 6), separately.20 Models 1 and 2 represent high school graduation from a science (math/tech) track over graduation from other tracks (binary 0/1), conditional on high school completion. We control for the full set of parental variables included in the models shown in Tables 2 and 3. Models 3 and 4 represent the graduation from a STEM field (binary 0/1), conditional on earning at least a bachelor’s degree. These models control for high school GPA and high school track choices on top of the other control variables. Finally, Models 5 and 6 predict the realization of actual inventorship (binary 0/1), conditional on a bachelor’s degree or higher in STEM, and additionally control for type of track in higher education.
|
Table 5. Educational Trajectories and Inventorship: Stepwise Regressions
| Sample | Model 1 | Model 2 | Model 3 | Model 4 | Model 5 | Model 6 |
|---|---|---|---|---|---|---|
| Graduated from math/tech high school track (0/1) | Graduated from STEM BSc+ degree (0/1) | Inventorship (0/1) | ||||
| High school completers | Tertiary education (BSc+) completers | STEM tertiary education (BSc+) completers | ||||
| Women | Men | Women | Men | Women | Men | |
| Lived with parents at age 15 (reference group: Lived with both parents or one parent and a step-parent) | ||||||
| Lived with single mother | 0.0299*** | 0.0347*** | 0.0082*** | 0.0261*** | 0.0000 | 0.0051 |
| (0.0026) | (0.0037) | (0.0026) | (0.0047) | (0.0032) | (0.0041) | |
| Lived with single father | 0.0288*** | 0.0209*** | 0.0113** | 0.0104 | 0.0118 | 0.0155** |
| (0.0052) | (0.0064) | (0.0054) | (0.0083) | (0.0072) | (0.0062) | |
| Real disposable | 0.0213*** | 0.0181*** | 0.0048*** | 0.0145*** | 0.0010 | 0.0010 |
| income (logs) | (0.0010) | (0.0013) | (0.0010) | (0.0016) | (0.0011) | (0.0014) |
| Field and level of parental education (reference group: no BSc+; no STEM) | ||||||
| Mother (no BSc; STEM) | 0.0726*** | 0.0801*** | 0.0009 | 0.0102*** | 0.0001 | 0.0053** |
| (0.0019) | (0.0023) | (0.0017) | (0.0029) | (0.0020) | (0.0026) | |
| Mother (BSc; no STEM) | 0.0611*** | 0.0511*** | 0.0187*** | 0.0283*** | 0.0106 | 0.0017 |
| (0.0052) | (0.0068) | (0.0052) | (0.0089) | (0.0065) | (0.0072) | |
| Mother (BSc; STEM) | 0.2213*** | 0.1614*** | 0.0882*** | 0.0725*** | 0.0019 | 0.0118 |
| (0.0087) | (0.0083) | (0.0088) | (0.0107) | (0.0059) | (0.0082) | |
| Father (no BSc; STEM) | 0.0773*** | 0.1058*** | 0.0047** | 0.0297*** | 0.0003 | 0.0035 |
| (0.0023) | (0.0027) | (0.0019) | (0.0032) | (0.0024) | (0.0031) | |
| Father (BSc; no STEM) | 0.0334*** | 0.0552*** | 0.0106*** | 0.0244*** | 0.0013 | 0.0050 |
| (0.0028) | (0.0039) | (0.0027) | (0.0053) | (0.0030) | (0.0046) | |
| Father (BSc; STEM) | 0.1882*** | 0.2301*** | 0.0649*** | 0.1054*** | 0.0010 | 0.0033 |
| (0.0032) | (0.0033) | (0.0030) | (0.0043) | (0.0026) | (0.0033) | |
| Mother inventor | 0.1477*** | 0.0483 | 0.0209 | 0.0262 | 0.0247 | 0.0497 |
| (0.0366) | (0.0372) | (0.0366) | (0.0495) | (0.0466) | (0.0545) | |
| Father inventor | 0.0677*** | 0.0798*** | 0.0284*** | 0.0661*** | 0.0219** | 0.0503*** |
| (0.0098) | (0.0098) | (0.0095) | (0.0131) | (0.0107) | (0.0121) | |
| GPA | 0.0304*** | 0.0168*** | 0.0048*** | 0.0103*** | ||
| (0.0007) | (0.0013) | (0.0010) | (0.0012) | |||
| High school track (reference group: math track) | ||||||
| Language | 0.1723*** | 0.3174*** | 0.0106*** | 0.0275*** | ||
| (0.0018) | (0.0029) | (0.0016) | (0.0032) | |||
| Technical | 0.2341*** | 0.2830*** | 0.0024 | 0.0009 | ||
| (0.0118) | (0.0067) | (0.0038) | (0.0036) | |||
| Other | 0.1549*** | 0.2625*** | 0.0073*** | 0.0213*** | ||
| (0.0019) | (0.0029) | (0.0019) | (0.0028) | |||
| Field of tertiary education (reference group: engineering) | ||||||
| Science | 0.0138*** | 0.0447*** | ||||
| (0.0022) | (0.0025) | |||||
| Food/agriculture | 0.0108*** | 0.0540*** | ||||
| (0.0022) | (0.0046) | |||||
| Level of tertiary education (reference group: BSc) | ||||||
| MSc | 0.0063*** | 0.0148*** | ||||
| (0.0016) | (0.0024) | |||||
| PhD/Dr | 0.1113*** | 0.1737*** | ||||
| (0.0085) | (0.0076) | |||||
| Municipality dummies | Yes | Yes | Yes | Yes | Yes | Yes |
| Year-of-birth dummies | Yes | Yes | Yes | Yes | Yes | Yes |
| Constant | 0.2206*** | 0.4197*** | 0.2301*** | 0.3675*** | 0.0135** | 0.0324*** |
| (0.0052) | (0.0066) | (0.0052) | (0.0085) | (0.0056) | (0.0072) | |
| Observations | 337,781 | 248,839 | 194,193 | 121,202 | 23,378 | 39,070 |
| R2 | 0.0476 | 0.0561 | 0.0971 | 0.1420 | 0.0616 | 0.0709 |
Notes. OLS regressions. Models 1 and 2: subsample of high school completers; the dependent variable is equal to one for graduation from math/tech high school track and zero for other tracks such as language or business. Models 3 and 4: subsample of tertiary education (BSc+) completers; the dependent variable is equal to one for graduation in a STEM field and zero otherwise. Models 5 and 6: subsample of STEM tertiary education completers; the dependent variable is equal to one if the person becomes an inventor and zero otherwise. Models 1, 3, and 5: male populations. Models 2, 4, and 6: female populations. Mother (father) inventor is an indicator for the mother (father) having applied for a patent. Indicators for parents’ field and level of education are included separately for mothers and fathers. Indicators for whether the individual lived with their parents at age 15 are included. Models 3–6 include indicators for high school track completed. Models 5 and 6 include indicators for field of completed tertiary education and indicators for level of completed tertiary education. Corresponding results for each stage in a fully interacted joint specification are reported in the online appendix, Table A7. Robust standard errors are in parentheses.
***p < 0.01; **p < 0.05; *p < 0.1.
The correlations resulting from this analysis provide interesting insights into the role of parental background for children’s educational outcomes and the probability of becoming inventors. In particular, we find that the family environment in which children grow up matters for science education. Family disposable income is positively correlated with graduating from a scientific-type high school track, whereas growing up with a single parent is negatively correlated with completing a scientific track (step 1). Gender differences for these family characteristics occur mainly at the bachelor’s level (step 2; p < 0.01, joint test of differences). Neither family income nor family structure predicts STEM BSc+ graduates transitioning into inventorship (step 3) at least not for daughters (p > 0.10, jointly). For sons, instead, having lived with a single father is negatively correlated with inventorship (p < 0.05).
Parental education matters differently for daughters and sons. Figure 4 summarizes the associations of daughters’ and sons’ educational outcomes with having a parent with a BSc+ in a STEM subject compared with having a parent with a lower level of education in a non-STEM subject (the reference group). Figure 4(a) shows the result for graduation from a math/tech high school track (step 1). Figure 4(b) reports the estimates for the type of bachelor’s degree (step 2).
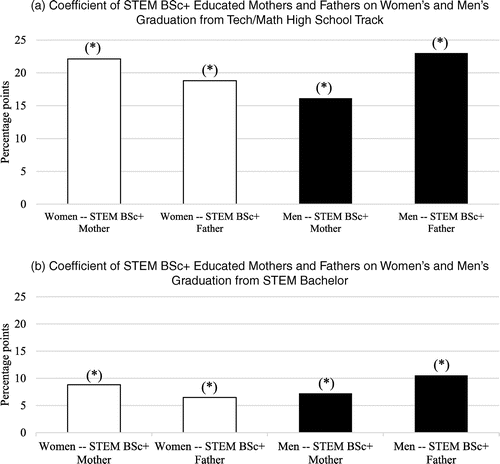
Notes. (a) Coefficients (multiplied by 100) of mothers (fathers) with a BSc+ STEM education in a regression that has an indicator (0/1) for graduating from a math/tech high school track as the dependent variable, separately for women (Table 5, Model 1) and men (Table 5, Model 2). They are estimated on the sample of high school completers. (b) Coefficients (multiplied by 100) of mothers (fathers) with a BSc+ STEM education from a regression that has an indicator (0/1) for graduating from a STEM BSc+ education as the dependent variable, separately for women (Table 5, Model 3) and men (Table 5, Model 4). *, coefficient is statistically significant at the 5% level; n.s., coefficients that are insignificant at the 5% level.
Figure 4(a) shows a strongly gendered correlation. For daughters, having a mother with a STEM BSc+ degree is significantly related to the propensity to graduate from a high school science track rather than nonscience tracks, more than having a father with a STEM BSc+ (+3.3 percentage points, p < 0.01). For sons, conversely, graduation from a high school science track is much more dependent on fathers having a STEM BSc+ education than on mothers having this education (+6.9 percentage points, p < 0.01). Thus, parental educational background in science correlates with the scientific education of daughters and sons, and mothers (more than fathers) are crucial for the likelihood that daughters will choose science early in their educational paths, whereas fathers (more than mothers) are crucial for sons. These gendered patterns are consistent with mechanisms related to role models and parental specialization. The gendered effects of parental education are also evident at the bachelor’s degree stage (step 2), although gender differences are less pronounced (Figure 4(b)). For daughters, the propensity to graduate in a STEM field is higher if the mother rather than the father has a STEM BSc+ degree (+2.3 percentage points, p < 0.05); the opposite applies to sons (+3.3 percentage points, p < 0.01).
Daughters are also significantly more likely to graduate from science-oriented rather than nonscience high school tracks (Table 5, Model 1 (step 1)) if they have a mother who is an inventor than a father who is an inventor. The difference is 8.0 percentage points (p < 0.05). Again, for sons, this difference reverses (3.0 percentage points), although not significantly so (p > 0.10; Model 2), in part because the association of sons’ inventorship and inventor mothers is not statistically significant at the 10% level. The relationship between mother’s inventorship and the field of tertiary education is not statistically significant, irrespective of the child’s gender (Table 5, Models 3 and 4 (step 2)). Having a father who is an inventor himself is significantly associated with children graduating from a STEM field for both genders, but again, the effect size is much smaller for daughters than for sons (p < 0.05).
For the final step, the transition from BSc+ STEM degrees into inventorship (step 3), there is no evidence of a direct correlation with parental STEM education (Table 5, Models 5 and 6, p > 0.1 jointly for both daughters and sons). Parental inventorship, instead, is still directly related to the transition into inventorship (Figure 5), although statistically significant only for fathers. Also, having a father who is an inventor likely matters more for sons than for daughters (p < 0.1 for the difference). By this yardstick, the difference between the effect size of father’s inventorship on sons’ and daughters’ propensity to become inventors amounts to 28 inventors per thousand, or 64% of the overall inventor propensity among STEM BSc+ graduates, which is 44 inventors per thousand (Table 1, Panel D). Remarkably, father’s inventorship is related to the final transition to inventorship, even for STEM BSc+ graduates, and even as we control for individuals’ high school background (track and GPA), chosen subfield within STEM, and final educational level (BSc/MSc/PhD). We estimate comparably large correlations of mothers who are inventors, again much larger for sons than for daughters, but the relative scarcity of mothers in the population who are inventors makes it difficult to assign statistical significance to these results.
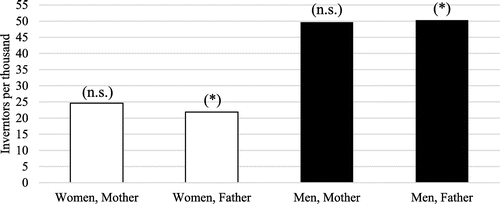
Notes. Coefficients (multiplied by 1,000) of inventor mothers (fathers) in a regression that has an indicator (0/1) for inventorship as the dependent variable, separately for women (Table 5, Model 5) and men (Table 5, Model 6). They are estimated on the sample of individuals who completed a STEM BSc+ education. *, sum of coefficients is statistically significant at the 5% level; n.s., effects that are insignificant at the 5% level.
As for the other control variables in the stepwise regressions in Table 5, a higher GPA in high school significantly increases the probability of graduating from a STEM field relative to other fields (step 2) and more so for girls than for boys (the difference is statistically significant, p < 0.01). Notably, GPA in high school still matters for STEM graduates’ likelihood of becoming inventors (step 3), although more prominently for boys than for girls (the difference is statistically significant, p < 0.01). Consistent with expectations, we find that the type of high school track is relevant for tertiary field of study (step 2; p < 0.01 jointly, for both daughters and sons). Among STEM graduates, engineers are more likely to become inventors than are graduates of natural science or food/agricultural science (step 3; p < 0.01 jointly, for both daughters and sons). There is also a clear positive gradient for inventorship (step 3) with respect to level of tertiary education, with a strong advantage for holders of a PhD.
Overall, the results from this exploration of children’s educational trajectories reveal that the importance of family factors diminishes as children move up the educational ladder. This means that whereas family structure, family resources, and parental education relate directly to the selection of high school tracks and fields of study at the tertiary level, they are related to inventorship only indirectly through children’s education. Moreover, parental education shows a significantly gendered correlation with both choice of high school tracks and STEM field in tertiary education, consistent with an interpretation of parental role models that mothers and fathers with a STEM degree have a stronger influence on their same-gender children. The effect of father’s inventorship is related to boys much more than to girls choosing a STEM field in tertiary education. Interestingly, the educational effect of parental inventorship via role models and gender-specific parenting effects fade earlier for daughters than for sons. Finally, parental inventorship, and in particular having a father who is inventor, is the only parental factor directly related to the transition into inventorship among STEM-educated individuals, predominantly for sons.
7. Discussion
We now connect the different pieces of evidence from our study and try to solve the puzzle about the drivers of the gendered intergenerational transmission of inventorship. For this purpose, we combine the results from the siblings experiment with those from the analysis of children’s educational trajectories.
We found that siblings’ gender composition strongly affects the extent to which girls’ entry into inventorship benefits from parental inventor background, after controlling for the indirect effect of a STEM background of the parents on children’s level and field of education. This result suggests that the transmission of inventorship suffers from a crowding-out effect, such that the presence of a brother limits girls’ benefits associated with parental inventorship that could pave or at least point the way to inventorship for them, such as the transmission of relevant knowledge or skills, the possible discussion of career plans, access to parent’s network, or the transmission of enthusiasm for creative and innovation tasks (Laband and Lentz 1992, Adamic and Filiz 2016, de Vaan and Stuart 2019). A similar result is found by Mishkin (2021), who showed a strong degree of dilution of intergenerational transmission of entrepreneurship for girls who have brothers. This contrasts with our findings for sons, for whom the transmission of inventorship is not affected by sibling composition. Overall, this shows that there is a strong gender component to the dilution of the parental inventorship effects. It also suggests that the observed crowding-out effect for daughters is not merely a (mechanical) consequence of the sharing of limited resources among more children, supported by the fact that the siblings’ experiment compares families with two or more children (and controls for family size in a robustness check).
Another important finding from tracking children’s educational trajectories is that parental STEM education correlates only indirectly with the probability that children will become inventors, namely through their choice of STEM education. Importantly, the sibling experiment also shows that the effect of parental STEM education on children’s inventorship is not crowded out by the gender of a younger sibling. Together with the prevalence of mother–daughter and father–son education associations, these results suggest that this intermediate mechanism that ultimately increases the probability of becoming an inventor operates through parental role modeling and parental specialization in children’s educational choices. Existing literature has also highlighted these relationships (Cheng et al. 2017, Chise et al. 2021).
The final piece of evidence is that parental (especially father) inventorship is transmitted very asymmetrically to boys and girls and that this is the only parental background characteristic that directly affects the transition from a STEM BSc+ degree into actual inventorship. Because the direct effect of parental inventorship on children’s probability of becoming inventors (on top of children’s education) is likely related to the transmission of relevant knowledge or skills, access to parent’s network, or the transmission of enthusiasm for creative problem solving (Laband and Lentz 1992, Adamic and Filiz 2016, de Vaan and Stuart 2019), we conclude that the crowding-out effect we observe in the sibling experiment concerns knowledge and other resources that are specific to the job as an inventor.
This gendered, unequal allocation of inventorship-specific resources suggests that, in addition to the benefits from being exposed to a conducive environment (Bell et al. 2019), there is a process that targets girls and boys differently and sets in with the arrival of a second-born brother to a first-born girl. In fact, general exposure alone cannot explain the results from the sibling experiment unless exposure changes with a second-born brother (but not with a second-born sister, and only for first-born girls but not for first-born boys). Suppose that the arrival of a brother changes the context in which a first-born girl grows up because, for instance, the parents’ personal network changes. If this network becomes particularly inventor-friendly, increasing the family’s exposure to science, technology, and inventorship, it should also increase the girl’s likelihood of becoming an inventor. However, this is not what we find in the sibling experiment. Instead, we argue that the crowding-out effect we observe for otherwise comparable girls with a second-born brother rather than a sister is consistent with a behavioral parental mechanism that shifts inventorship-specific resources or that mediates the effects of objective background characteristics that influence children’s opportunities to the benefit of boys.
Why does this happen? What makes a picture of our puzzle pieces seems to be the interpretation that parents, and in particular parents who are inventors themselves, are exposed to external information about the inventive job, such as the fact that it is practiced by few women and that, on average, women face more obstacles than men in this male-dominated setting (, Ding et al. 2006, Sugimoto et al. 2015, Toivanen and Väänänen 2016, Hoisl and Mariani 2017, Jensen et al. 2018). This external information is interpreted according to the parents’ own beliefs (Bau and Fernández 2021) and helps form parents’ expectations about their children in these jobs. These expectations, in turn, drive parents’ decisions and behaviors in the transmission of inventorship to their children, for example, via advice or the assignment of resources. The fact that first-born girls with a brother are less or not at all influenced by parental inventorship, that is, that advice or resources do not seem to reach them, suggests that gendered considerations are involved in the process of interpreting external information about the suitability of the inventive jobs for children. In this regard, the sibling experiment is an effective means to uncover the presence of gendered interpretations and consequent gender-dependent unequal attitudes of parents toward their children (Brenøe 2021).
One could challenge this interpretation of the results by arguing that they are driven by internal family dynamics other than parental influence. For example, the arrival of a different-gender sibling could change the older child’s likelihood of becoming an inventor because it generates comparisons and competitive pressure between siblings that differ from that of a same-gender siblings’ environment (Grotevant 1978, McGuire et al. 1979, McHale et al. 1999). Competition and gender specialization in families with mixed-gender children could explain differences in children’s educational and professional activity-related choices. Transferred to our setting, the second-born sibling may influence these choices of the older sister. However, the evidence we present does not point to this explanation as the main (or at least not the only) reason for our results, as, for example, we do not observe a second-born sibling changing the effect of parental educational background on the transition to inventorship. In fact, the asymmetric effect is specific to parental inventorship only.
The existence of potential confounders could also challenge our interpretation of the role of parents in the intergenerational transmission of inventorship. Although such confounders might exist, for these confounders to play a role, they must first be correlated with parental inventorship on top of all the factors for which we control in the regressions; second, they must affect first-borns differently depending on the gender of the second-born child in their family.
As a final note, given that the causal analysis focuses on first-born girls with siblings, we check the extent to which our findings about parental inventorship apply to all girls with siblings, irrespective of birth order and family size. As noted in Section 5, we obtain similar negative results for second-born girls if they have a first born brother (see results in Table A8 in the online appendix), although by looking at the fate of second-born siblings, we cannot assume the same plain field for all of them, as other forces such as the role models of the older siblings could come into play and affect the interpretation of our results. Nevertheless, the results from this analysis suggest that our findings are not limited by birth order as such and that potential confounders resulting from the gender of the first-born do not overturn the general result on sibling composition.21
8. Conclusion and Implications
This research investigates the role of parental background in the intergenerational transmission of inventorship to daughters and sons. The literature has considered family and the environment as mostly objective background characteristics that influence children’s opportunities and, through these, the probability of becoming an inventor. Our research adds the role of the family, in particular parents, as an intermediary that acquires and interprets external information and forms expectations about the returns to the investment in children becoming inventors. Thereby, we contribute to the literature on factors that explain the gender gap in STEM jobs and to studies about forces that affect choices made early in life and individuals’ future professional activities, in this specific case, the likelihood of becoming an inventor (Aghion et al. 2018, Bell et al. 2019), adding an important boundary condition to this literature: the role of parents as intermediaries in the intergenerational transmission of inventorship.
To this end, we use a research design to examine the role of parental background for first-born children, conditional on the gender of the second-born sibling. The key result of our empirical analysis is that parental inventorship increases the probability of daughters becoming inventors only if they do not have a second-born brother. For first-born sons, instead, the effect of parental inventorship on the probability of becoming an inventor does not change with the gender of the second-born sibling. By bringing together different pieces of evidence, we interpret this result to suggest that parents interpret external information based on their beliefs and form gendered expectations about daughters’ and sons’ returns from being an inventor. These expectations, in turn, can lead parents to a gendered allocation of time and other resources to their children, and to a bad equilibrium that is hard to break.
There should be ways to improve on this bad equilibrium, some of which we suggest in the following. Importantly, to be effective, these actions must address both parental beliefs and the information created by the environment, which contribute to forming and confirming these beliefs and which can lead to gendered expectations about the returns and careers of girls versus boys. In this respect, we expect our findings to inspire actions by policymakers, schoolteachers, firm managers, and families themselves, who can possibly improve on these imbalances.
Our results suggest that behaviors that create gendered career or professional activities’ choices for children begin early, they can develop within the family, and they influence children’s opportunities also through routes other than education. Thus, pushing women into STEM graduate degrees can help, but it might not be enough to eliminate the gender gap in inventorship. Role models alone cannot close the gap for the new generations, either. (Gendered) role models strongly influence educational choices, but not the transmission of parental inventorship. In addition, the number of mothers in science and technology is still too low compared with fathers, and therefore boys are automatically advantaged.
We should think of additional actions that begin during childhood and target children and parents. Making people aware of stereotypical thinking and gendered behaviors is an important first step. As an example, between 1966 and 1977, David Chambers, a social scientist, asked 4,807 elementary school children to draw a scientist (Chambers 1983). In his first study, which was conducted in 1966, only 28 children (0.6% of the total, all girls) drew a female scientist. In the following years, the study was repeated several times. Miller et al. (2018) conducted a meta-analysis of five decades “Draw-A-Scientist studies” in the United States. Based on 78 studies (n = 20,860), they find that the share of children drawing female scientists has increased considerably among younger cohorts. However, within cohorts, the probability of drawing a female scientist decreases as children grow older. The authors suggest that this is because children develop gendered attitudes (possibly through their parents) to associate scientists predominantly with men and not women. Thus, awareness and effective communication of counterfactuals in different environments, such as family, school, university, friends, and workplace, where the relevant information is created and interpreted, are important to overcoming gender biases (see Carrell et al. 2010 for the importance of teachers).
An effective tool to create awareness can further be the dissemination of information about successful women in male-dominated jobs, and in STEM-related jobs, in particular. Here, reports on women’s careers in science and technology, examples of successful female researchers and the decisions that they made over their life cycle, and the role of the environment in shaping such decisions can be of help. Recently, for example, Fabiola Gianotti, the first female Director General of CERN (European Council for Nuclear Research), whose tenure began in 2016, was interviewed about factors that led her to this field of research and finally to this position. She acknowledged that her parents, who never said “This is not a women’s job,” were key in the choices she made. She noted that for many people prejudices begin in the family (Fraioli 2021). She also explained that it is important to give women the right messages that a job in a scientific field can be highly rewarding, as they can contribute as much as men to the development of scientific knowledge and human well-being. Children can be introduced to (successful) women in science in a playful way early in life by parents and schoolteachers, together with an education rooted in critical thinking (Annenkova and Domysheva 2020) and outside-the-box thinking, which can help avoid the formation of stereotypes (Sassenberg and Moskowitz 2005).
Because parents develop their interpretations based on external information they receive, interventions should also be directed to change the context that generated this information. Thus, any action that increases the number of women in science and technology and improves their treatment and visibility would help move away from this bad equilibrium. At the level of the patent system, Jensen et al. (2018) show that U.S. patent applications filed by female inventors are less likely to be granted than those filed by male inventors.22 They show that much of the disadvantage during the examination process is likely to come from decision-makers being able to infer the inventor’s gender. Among other implications, this disadvantage translates to lower visibility of women as inventors, which, in our framework, contributes to shaping parental expectations about the gendered returns to being an inventor. A direct and relatively easy to implement action could be to make the examination process “blind”; that is, examiners and all decision-makers involved in the patenting process should not know the identity of an inventor until the examination is completed. Jensen et al. (2018) suggest that this could significantly reduce biases based on inventor gender. At the level of employer organizations, it would be helpful if decision-makers were willing to increase the number of women in technology leadership positions, such as Chief Technology Officer or research and development manager. This could help overcome the (perceived) disadvantage of women in technology-related positions.
At the 43rd annual Group of 7 (G7) Summit in Taormina, Italy, on May 26 and 27, 2017, leaders adopted the first “G7 Roadmap for a Gender-Responsive Economic Environment” (G7 Working Group 2017, p. 6). In this document, they summarized a set of government measures to accelerate women’s economic participation and empowerment and to promote gender equality. Besides role models and the need to convince women to choose STEM subjects at university, the outlined measures also include “[r]aising awareness among young women and men, parents, teachers, educational institutions and employers about gender-stereotypical attitudes towards performances in academia and apprenticeship programs.” These measures seem to address the right problem. It will take generations, however, to slowly increase the proportion of women (and other minorities) in STEM jobs.
We began our paper by noting that a large gap between the share of qualified women and the actual share of female inventors combined with the fact that talent and creativity are equally distributed across gender implies that there are “lost Marie Curies.” As we also noted in the introduction, the family of Marie Curie is an excellent example of children following their parents: Irène Joliot-Curie, the first-born daughter of Marie and Pierre Curie, just like her parents, received a Nobel Prize. Not surprisingly, given our results, Irène Joliot-Curie had a second-born sister, not a brother.
The authors appreciate feedback on prior drafts from Waverly Ding, Anne Sophie Lassen, Vera Rocha, and Scott Stern, as well as conference and seminar participants at the Copenhagen Business School Paper Development Workshop on Gender, Work and Society 2020, the Asian Innovation and Entrepreneurship Association—National Bureau of Economic Research Conference 2020, the Wharton Technology & Innovation Conference 2021, the NBER Productivity Seminar (2020 Series), the DRUID Conference 2021, the Academy of Management Meeting 2021, the Munich Summer Institute 2021, the Econometrics and Business Statistics Seminar, Aarhus University 2021, the Internal Research Seminar, University of Maryland 2021, the Internal Research Seminar, University of Groningen 2021, the Internal Research Seminar, London Business School 2021, and Research Group in Theoretical and Applied Economics Lunch Seminar 2021, University of Bordeaux. The comments of the editors and three anonymous reviewers are gratefully acknowledged. The authors contributed equally, and their names are listed alphabetically.
1 Aghion et al. (2018) only study male individuals.
2 A total of 23 matched inventors were supposedly less than 20 years old at the time of their first patent application. To be conservative, we consider them likely mismatches and omit them from the analysis.
3 A part of our empirical investigation considers the subpopulation of individuals born between 1966 and 1975, whom we can track at least until they turn 40.
4 We do not expect a significant loss of Danish inventors if we rely on the European Patent System rather than other jurisdictions, since we would only miss those inventors who had not filed at least one European patent for another invention. Moreover, any resulting loss of inventors would only matter for our analysis if differences in filing behavior varied systematically with the gender of the inventors' siblings.
5 Although this operationalization of inventors has become established in the literature, we cannot assume that our results apply to individuals who invent but do not apply for (at least) one patent, because not all inventions are patented or patentable (Cohen et al. 2000).
6 Overall GPA is available for almost all regular math- or language-track students, whereas only 43% of technical high school students and 63% of graduates in the “Other” category have valid GPAs available in the registry information for the cohorts analyzed in this study.
7 We excluded individuals who did not live with either of their legal parents at the age of 15 (2.3% of the gross population; 31,136 individuals), since other dynamics, such as possible conflicts or stays in children’s homes, which we cannot control for, may drive the results for this group of individuals. Nevertheless, the results do not change when we include these cases as well.
8 Descriptive statistics for the inventors in the full population can be found in the online appendix.
9 Additional variables used for the validation of the sibling instrument or in robustness checks are documented in the notes for the relevant tables.
10 We exclude twins and siblings who are separated by less than nine months (e.g., adoptive children).
11 We provide the results for the probability of the second-born child to become an inventor in the online appendix (Table A8).
12 Performing a regression of the indicator of a second-born girl against all predetermined variables yields an overall F test with a p value of 0.28. This suggests that the predetermined variables are indeed balanced across the subsamples.
13 Performing the regressions separately for each subsample is equivalent to running a joint regression that is fully interacted with a dummy for second-born gender. We report the fully dummy-interacted regression in the online appendix, Table A4, Model 1. Wald tests of differences across subsamples are based on the statistical significance of the dummy interactions in that regression.
14 The effects of mother’s level and field of education are not jointly significantly different between the subsamples (p > 0.10) and are similar for father’s education. The effect of a father with a STEM degree below the bachelor’s level (mainly technicians) compared with fathers with a below-bachelor’s-level degree in a non-STEM field shows a significantly lower estimate for first-born daughters with a brother rather than a sister.
15 In Table A5 of the online appendix, we estimate a fully interacted joint model for first-born daughters and sons. The estimated interaction terms provide Wald tests of the significance of gender differences.
16 When we add further controls, the sample size reduces compared with Table 2. The number of observations for the different analyses are provided in Table 4.
17 These results remain robust to controlling for dummy variables that represent children’s occupation–industry combinations in the first year after they graduate from their highest completed education, suggesting that the differences we observe are not driven by children’s occupation or industry choices. These results are available from the authors upon requests. We refrained from adding them to the manuscript because children’s choice of occupation and industry is likely an additional outcome of parental influence, including parental inventorship. However, future research may find it valuable to further investigate children’s occupational and industry choices as channels through which parents affect their children.
18 We also conducted a t test to compare the age at first patent filing for female and male inventors: 33 years for women and 33.4 years for men; the difference is not significant at the 10% significance level (see Table A1 in the online appendix).
19 The online appendix, Table A10, provides results also for a penalized logit specification and for a Poisson specification.
20 In Table A7 of the online appendix, we estimate fully interacted joint models for daughters and sons corresponding to the separate models in Table 5.
21 Related to this, our causal analysis does not include single-child families. Children without siblings are likely to face different dynamics, as previous research has shown that one-child families and, in particular, one-girl families, are less stable than families with more than one child (Morgan et al. 1988). The potential for family breakup might have (adverse) effects on the girls’ prospects and the extent to which they can benefit from parental background.
22 To explore potential causes for these gender differences in the application process, Jensen et al. (2018) exploit the degree of popularity of inventors’ first names as an indicator of how easily patent examiners can infer inventors’ gender during the examination process. It turns out that the gender gap in terms of the probability of a patent being granted is much higher for female inventors whose first names are common than in the case where their first names are rare (8.2% versus 2.8%).
References
- (2016) Do jobs run in families? Facebook Research Blog, accessed May 10, 2022, https://research.fb.com/blog/2016/03/do-jobs-run-in-families/?mc_cid=c904304e76&mc_eid=f46aa7b654.Google Scholar
- (2018) The social origins of inventors. NBER Working Paper No. 24110, National Bureau of Economic Research, Cambridge, MA.Google Scholar
- (1998) Children and their parents’ labor supply: Evidence from exogenous variation in family size. Amer. Econom. Rev. 88(3):450–477.Google Scholar
- (2020) Developing critical thinking skills for overcoming stereotypes in intercultural communication. Eur. Proc. Social Behav. Sci. 90:1028–1038.Crossref, Google Scholar
- (2021) The family as a social institution. NBER Working Paper No. 28918, National Bureau of Economic Research, Cambridge, MA.Google Scholar
- (1991) A Treatise on the Family (Harvard University Press, Cambridge, MA).Crossref, Google Scholar
- (2019) Who becomes an inventor in America? The importance of exposure to innovation. Quart. J. Econom. 134(2):647–713.Crossref, Google Scholar
- (2013) The trouble with boys: Social influences and the gender gap in disruptive behavior. Amer. Econom. J. Appl. Econom. 5(1):32–64.Crossref, Google Scholar
- (2017) Gender stereotypes about intellectual ability emerge early and influence children’s interests. Science 355(6323):389–391.Crossref, Google Scholar
- (2020) Is there still son preference in the United States? J. Population Econom. 33(3):709–750.Crossref, Google Scholar
- (2021) Brothers increase women’s gender conformity. J. Populuation Econom. Forthcoming.Crossref, Google Scholar
- (2007) Prior family business exposure as intergenerational influence and entrepreneurial intent: A theory of planned behavior approach. J. Bus. Res. 60(10):1090–1098.Crossref, Google Scholar
- (2010) Sex and science: How professor gender perpetuates the gender gap. Quart. J. Econom. 125(3):1101–1144.Crossref, Google Scholar
- (1983) Stereotypic images of the scientist: The draw-a-scientist test. Sci. Ed. 67(2):255–265.Crossref, Google Scholar
- (2017) Can parents’ growth mindset and role modelling address STEM gender gaps? Working paper 2017-07, Department of Education Reform, University of Arkansas, Fayetteville, AR.Google Scholar
- (2021) On the intergenerational transmission of STEM education among graduate students. B. E. J. Econom. Anal. Policy 21(1):115–145.Google Scholar
- (2018) Gender differences in undergraduate engineering applicants: A text mining approach. International Conference on Educational Data Mining, Raleigh, NC (International Educational Data Mining Society).Google Scholar
- (2000) Protecting their intellectual assets: Appropriability conditions and why US manufacturing firms patent (or not). NBER Working Paper No. w7552, National Bureau of Economic Research, Cambridge, MA.Google Scholar
- (2019) The brother earnings penalty. Labour Econom. 58:37–51.Crossref, Google Scholar
- (2001) Gender and the career choice process: The role of biased self-assessments. Amer. J. Sociol. 106:1691–1730.Crossref, Google Scholar
- (2008) The demand for sons. Rev. Econom. Stud. 75(4):1085–1120.Crossref, Google Scholar
- (2019) Does intra-household contagion cause an increase in prescription opioid use? Amer. Sociol. Rev. 84(4):577–608.Crossref, Google Scholar
- (2021) More women in tech? Evidence from a field experiment addressing social identity. Management Sci. Forthcoming.Google Scholar
- (2006) Gender differences in patenting in the academic life sciences. Science 313(5787):665–667.Crossref, Google Scholar
- (2021) Born in the family: Preferences for boys and the gender gap in math. J. Econom. Behav. Organ. 183:175–188.Crossref, Google Scholar
- (2003) How chronic self-views influence (and potentially mislead) estimates of performance. J. Personality Soc. Psych. 84:5–17.Crossref, Google Scholar
- (1987) A multivariate model for explaining gender differences in career and achievement motivation. Edu. Res. 16(2):5–9.Crossref, Google Scholar
- (2021) Gianotti: “Ora la scienza è un mestiere per donne.” La Repubblica (May 29), accessed May 10, 2022, https://www.repubblica.it/esteri/2021/05/29/news/intervista_fabiola_gianotti_direttrice_cern-303377251/.Google Scholar
G7 Working Group on Gender Equality and Women’s Empowerment (2017) G7 roadmap for a gender-responsive economic environment. Accessed May 10, 2022, http://www.g7italy.it/sites/default/files/documents/Gender%20Roadmap/index.pdf.Google ScholarGender Equality Index (2021) European Institute for Gender Equality. Accessed May 10, 2022, https://eige.europa.eu/gender-equality-index/2020.Google Scholar- (2020) Does quality time produce quality children? Evidence on the intergenerational transmission of human capital using parental deaths. J. Labor Econom. 38(2):569–610.Crossref, Google Scholar
- (1978) Sibling constellations and sex typing of interests in adolescence. Child Development 49(2):540–542.Crossref, Google Scholar
- (2017) It’s a man’s job: Income and the gender gap in industrial research. Management Sci. 63(3):766–790.Link, Google Scholar
- (2013) Why are women underrepresented amongst patentees? Res. Policy 42(4):831–843.Crossref, Google Scholar
Irène Joliot-Curie Facts (2021) Nobel Prize Outreach AB 2021. Accessed May 10, 2022, https://www.nobelprize.org/prizes/chemistry/1935/joliot-curie/facts/.Google Scholar- (2018) Gender differences in obtaining and maintaining patent rights. Nature Biotech. 36(4):307–309.Crossref, Google Scholar
- (2018)
Women and science, technology, engineering, and mathematics (STEM): Are differences in education and careers due to stereotypes, interests, or family ? Averett SL, Argys LM, Hoffman SD, eds. The Oxford Handbook of Women and the Economy (Oxford University Press, New York), 767–798.Google Scholar - (2016) Father presence and the intergenerational transmission of educational attainment. J. Human Resources 51(4):869–899.Crossref, Google Scholar
- (1983) Like father, like son: Toward an economic theory of occupational following. Southern Econom. J. 50:474–493.Crossref, Google Scholar
- (1992) Self-recruitment in the legal profession. J. Labor Econom. 10(2):182–201.Crossref, Google Scholar
- (2018) On the origins of gender human capital gaps: Short and long term consequences of teachers’ stereotypical biases. J. Public Econom. 167:263–279.Crossref, Google Scholar
- (2013) Bildung und Qualifikation als Grundlage der technologischen Leistungsfähigkeit Deutschlands (Studien zum Deutschen Innovationssystem, Berlin).Google Scholar
- (2005) We can do it: The interplay of construal orientation and social comparisons under threat. J. Personality Soc. Psych. 88:432–446.Crossref, Google Scholar
- (2019) Learning from mum: Cross-national evidence linking maternal employment and adult children’s outcomes. Work Employment Soc. 33(3):374–400.Google Scholar
- (1979) Effects of household sex composition on the salience of one’s gender in the spontaneous self-concept. J. Experiment. Soc. Psych. 15(1):77–90.Crossref, Google Scholar
- (1999) Family context and gender role socialization in middle childhood: Comparing girls to boys and sisters to brothers. Child Development 70(4):990–1004.Crossref, Google Scholar
- (1982) Sex differences in math achievement: Toward a model of academic choice. Psych. Bull. 91:324–348.Crossref, Google Scholar
- (2018) The development of children’s gender‐science stereotypes: A meta‐analysis of 5 decades of US draw‐a‐scientist studies. Child Development 89(6):1943–1955.Crossref, Google Scholar
- (2021) Gender and sibling dynamics in the intergenerational transmission of entrepreneurship. Management Sci. 67(1):6116–6135.Link, Google Scholar
- (1988) Sons, daughters, and the risk of marital disruption. Amer. J. Sociol. 94(1):110–129.Crossref, Google Scholar
- (2016) Like father, like daughter (unless there is a son): Sibling sex composition and women’s TEM major choice in college. Discussion paper 10052, Institute for the Study of Labor (IZA), Bonn, Germany.Google Scholar
- (2018) The effect of a sibling’s gender on earnings and family formation. Labour Econom. 54:61–78.Crossref, Google Scholar
- (2018) Sibling gender and wage differences. Appl. Econom. 50(15):1725–1745.Crossref, Google Scholar
- (2005) Don’t stereotype, think different! Overcoming automatic stereotype activation by mindset priming. J. Experiment. Soc. Psych. 41(5):506–514.Crossref, Google Scholar
- (2017) Women in STEM Disciplines: The Yfactor 2016 Global Report on Gender in Science, Technology, Engineering and Mathematics (Springer, Cham, Switzerland).Crossref, Google Scholar
- (2015) The academic advantage: Gender disparities in patenting. PLoS One 10(5):e0128000.Crossref, Google Scholar
- (2016) Education and invention. Rev. Econom. Statist. 98(2):382–396.Crossref, Google Scholar
- (2003) Wage effects of motherhood: A double selection approach. Accessed May 10, 2022, http://repositorium.sdum.uminho.pt/handle/1822/11433.Google Scholar

