Market Design Choices, Racial Discrimination, and Equitable Microentrepreneurship in Digital Marketplaces
Abstract
This study investigates the potential of market design choices, specifically quality certification, to mitigate racial discrimination in digital marketplaces. Using a regression discontinuity design (RDD) that exploits the discontinuity in Airbnb’s Superhost assignment, we find that Black hosts benefit 1.5 times more from the quality certification than other hosts. Moreover, we find compelling evidence that this disproportionate increase does not come at the expense of non-Superhost Black hosts. This suggests that quality certification can effectively reduce discrimination and promote equitable outcomes. Further, our analysis utilizing a doubly robust machine learning approach reveals that the effectiveness of quality certification persists even in the prominent presence of consumer reviews, a widely used market feature and a credible user-generated quality signal. Our research underscores the judicious use of market design in fostering equity for minority entrepreneurs in digital marketplaces.
This paper was accepted by Hemant Bhargava, information systems.
Supplemental Material: The online appendix and data files are available at https://doi.org/10.1287/mnsc.2023.01717.
1. Introduction
Digital marketplaces have become a significant part of the global economy. Firms such as eBay, Amazon, Etsy, Airbnb, Uber, and TaskRabbit, among others, enable microentrepreneurs as well as small and large businesses to engage with consumers with unprecedented efficiency. The rapid growth and wide market reach of these platforms are largely attributed to their capacity to address a variety of socioeconomic challenges and obstacles. Recently, many digital marketplaces have begun responding to calls for equity by launching initiatives to ensure equitable outcomes for minority supply-side participants. For instance, in June 2021, Amazon committed $150 million to support Black-owned businesses selling as third parties on Amazon.1 Concerns regarding equitable outcomes are more acute in business models where the identifiable information of the sellers and/or the consumers is deemed necessary by platform owners. Platforms in the sharing economy, such as Airbnb, Uber, and Lyft, are prominent examples of marketplaces that disclose identifiable information about supply-side providers. Naturally, the presence of identifiable personal information can lead to marketplace discrimination and cause disparities in outcomes among supply-side entrepreneur groups based on their race or ethnicity. This issue is further compounded by the inability of platform owners to police prejudices or regulate consumer choices.2
In their endeavor to enhance marketplace efficiency and facilitate transactions, digital platforms also utilize market design choices to underscore the quality of sellers and products. A notable example of such a design choice is quality certification. This feature is designed to provide consumers with a transparent and concise signal of product or service quality. Examples of such certification programs include “Airbnb Superhosts,” a distinction given to home-sharing hosts of exceptional quality; “TaskRabbit Elite,” a status reserved for the most dependable TaskRabbit workers; and the “All-Star Hosts,” a designation for top-tier hosts on Turo. Although quality certification is intended to bolster efficiency, its ramifications on discrimination and market equity within platforms warrant further investigation.
Quality certification could inadvertently amplify market inequity. If consumers’ discriminatory tendencies originate from an aversion to transacting with a specific group, certification might unintentionally facilitate their selective search for top-tier providers from their preferred groups. For instance, if a consumer harbors bias against a particular race or ethnic group, quality certification could expedite the process of identifying high-caliber sellers from their preferred racial or ethnic group. This could perpetuate discriminatory practices and reinforce existing disparities.
Furthermore, the wealth of information readily available on digital platforms could render quality certification superfluous. In terms of informational value, platform certification could be deemed redundant. If the data provided by the platform (e.g., comprehensive product descriptions, high-resolution images, user-generated reviews, etc.) already address information asymmetries that influence a consumer’s likelihood to discriminate, then certification may not significantly alter the outcome. This is noteworthy as platforms typically confer quality certification based on factors that are already visible to the consumer.
Besides, in numerous digital marketplaces, the correlation between product quality and the seller’s credibility signal, as indicated by certification, remains tenuous. For instance, in sharing economy services such as Airbnb’s home-sharing and Turo’s car-sharing, the inherent value of a product may not necessarily be contingent on the seller’s certification status. In these contexts, a high-quality home or car retains its value irrespective of whether the host or owner has been awarded a “Superhost” or “All-Star Host” status.
On the contrary, the distinctiveness, succinctness, and perceived trustworthiness of quality certification may alleviate the information burden consumers face, reducing the cost associated with evaluating individual seller quality. In particular, although quality certification predominantly relies on visible and other proxy forms of information, the sheer volume of data available on digital platforms can lead to information overload (Simon 1971, Iyengar and Lepper 2000, Dellaert et al. 2012). As a result, the convenience afforded to consumers through certification—compared with alternative design choices that necessitate subjective assessments (e.g., interpreting consumer reviews)—can help mitigate information overload. Notably, several studies suggest that market discrimination often stems from consumers’ inability to accurately assess a seller’s individual quality. They may resort to using skin color as a heuristic for group-level characteristics to infer the quality of products provided by the seller, a practice known as statistical discrimination (List 2004, Lang and Spitzer 2020). Thus, the fundamental attributes of quality certification—its transparency, brevity, and ease of comprehension—may help mitigate statistical discrimination by simplifying the process of assessing the quality of individual supply-side participants.
In this study, we examine the impact of the Superhost quality certification program used by the home-sharing marketplace Airbnb. Airbnb enables hosts (supply-side participants) to offer their properties for short-term rentals to guests (demand-side participants). Prior to confirming a reservation, guests have access to a host’s name and photo, detailed property descriptions, and high-quality images. They can also view user feedback and information about the number of available bathrooms and bedrooms, among other pertinent attributes. Crucially, the platform indicates whether a host has attained Superhost status, a distinction Airbnb describes as follows:
Superhosts are experienced hosts who provide a shining example for other hosts, and extraordinary experiences for their guests.
The Superhost program presents an ideal context for identifying discrimination, given the sensitive nature of the exchanged good (home-sharing). Although the Superhost certification does not alter the property itself, it offers a prominent quality signal about the host to potential guests. We capitalize on a specific discontinuity in the Superhost achievement criteria by focusing on hosts positioned at the threshold of meeting these standards. This borderline creates a natural experiment, enabling us to assess the causal effect of Superhost certification on host performance. Our analysis targets hosts near this discontinuity—termed marginal hosts—as their proximity to the cutoff facilitates a quasi-experimental design. This methodology approximates the random assignment of Superhost certification among a subset of hosts. Utilizing this approach, we observe that Black hosts achieving Superhost certification experience a significant increase in reservations, 17.23%, compared with a 6.93% lift for all other hosts. These findings underscore the role of quality certification in reducing discrimination and promoting more equitable outcomes within digital marketplaces.
One limitation of studying the marginal hosts lies in the challenge of generalizing the findings to the broader spectrum of hosts. To address this limitation, we utilize the abundant and detailed data available in our study, combined with the latest advancements in causal inference enabled by machine learning techniques. Specifically, we implement doubly robust machine learning (DML) methods (Chernozhukov et al. 2017, Athey and Imbens 2019) to identify the causal and heterogeneous treatment effects of the certification in our sample. This dual identification approach reinforces our findings and generalizes the results beyond the observations at the immediate vicinity of the certification thresholds.
Notably, the DML-based approach allows for an in-depth examination of the heterogeneous effects of Superhost certification. We study the shifts in the benefits of the certification program when another widely recognized quality signal—crowdsourced reviews—is present. Our findings suggest that platform certification continues to play a significant role in fostering more equitable outcomes even in the prominent presence of user-generated reviews. This underscores the efficacy of platform-certified quality signals, which extend the scope of user-generated signals, in devising a market-oriented solution to counteract discrimination experienced by supply-side participants.
We investigate the underlying mechanism by exploring whether the demand lift for certified Black hosts occurs at the expense of noncertified Black hosts. We consider the role of homophily—the propensity for individuals to connect with others of similar racial or ethnic backgrounds—as a potential catalyst for the demand boost observed for certified Black hosts. Additionally, we examine the impact of certification on noncertified Black hosts, assessing impacts at both the individual and area (census tract) levels. Our empirical analysis shows that certified Black hosts experience a substantial increase in the number of White guests, in contrast to their noncertified counterparts. Moreover, our findings indicate that increasing the number of certified hosts within a specific area does not adversely affect the demand for noncertified Black hosts offering services in the same area. These results lead us to conclude that quality certification, by reducing uncertainty, is attracting new customers to the platform and this market expansion disproportionately benefits certified Black hosts. Therefore, quality certification emerges as a tool that not only promotes more equitable outcomes but also aligns with the platform owners’ objectives of overall market growth.
The remainder of the paper is organized as follows. The following section provides a summary of the relevant literature and highlights our scholarly contributions. Section 3 provides a description of the home-sharing context and Airbnb specifically, as well as an overview of our data. Section 4 discusses the challenges of identification and elaborates on the two strategies employed in our study. In this section, we first outline the specifics of the regression discontinuity (RD) strategy that focuses on the marginal hosts, and then we present the results of this approach. Following this, we present the DML-based strategy along with its results, including a discussion on the heterogeneous treatment effects estimated using the DML estimator. Section 5 provides an examination of the underlying mechanisms behind our findings. The last section of the paper summarizes the findings and offers concluding remarks.
2. Related Literature
Our study contributes to the broad literature on discrimination and potential mitigation strategies. Arrow (1998) emphasizes the need for empirical validation in discrimination studies, cautioning against the reliance on assumptions without quantitative evidence, especially when formulating policies. Arrow makes two assertions: (1) “There is no way of separating completely the study of racial discrimination (or indeed many other aspects of economics) from moral feelings” (p. 91) and (2) “It is, of course, important to be analytic; moral feelings without analysis can easily lead to unconstructive policies” (p. 91). Furthermore, Bertrand and Duflo (2017) highlight the need for innovative methods to document discrimination and develop effective interventions, noting that the focus has often been more on documenting discrimination than on understanding its consequences or devising strategies to counteract it. We provide robust evidence, derived from a dynamic and active online consumer marketplace, of discrimination faced by supply-side participants. More importantly, we establish that statistical discrimination is a significant factor explaining the performance gap of Black microentrepreneurs, compared with their counterparts, even in an environment where there is ample information about supply-side participants and where the product is clearly defined. Finally, we demonstrate the efficacy of quality certification as a mitigating tool of discrimination in these information-rich digital marketplaces.
Although the majority of discrimination research has focused on labor markets, as comprehensively reviewed by Lang and Spitzer (2020), the proliferation of digital marketplaces has made it increasingly feasible to investigate discrimination within consumer markets. This is largely due to the experimental adaptability of digital environments, where the creation and manipulation of digital identities can be easily accomplished. This adaptability has naturally facilitated the application of correspondence studies for documenting discrimination in online marketplaces. These studies implement randomized field experiments that subtly modify identity markers to address the empirical challenges tied to using observational data for directly linking disparities with discriminatory practices (Bertrand and Mullainathan 2004).3 Correspondence studies have been employed to document discrimination faced by demand-side participants across various online consumer platforms. For instance, correspondence studies on home-sharing and ride-sharing service providers find evidence of higher cancellation rates facing minority home-sharing guests (Edelman et al. 2017, Cui et al. 2020) and minority ride-sharing riders (Ge et al. 2020). Similar discrimination is documented facing buyers in online used car markets (Zussman 2013).
Investigating discrimination against supply-side participants, particularly in active and dynamic markets, is more complex. Discrimination against demand-side participants is apparent when they face rejection based on their race or ethnicity during transactions. However, identifying discrimination against supply-side participants involves choices made by demand-side participants that do not reveal who was rejected or why, making it difficult to conclusively distinguish between discrimination and disparity. Consequently, some studies resort to investigating disparities by comparing group-level outcomes between two racial groups and controlling for other factors that might impact the outcome. Although this method can underscore disparities, it does not necessarily signify discrimination, as disparities can also arise from differences in unobserved preferences, skills, opportunities, and other nondiscriminatory factors.
Examples of observed disparity on online platforms include lower funding rates for Black participants on crowdfunding platforms (Pope and Sydnor 2011, Younkin and Kuppuswamy 2018) and lower prices charged by Black home-sharing hosts (Laouénan and Rathelot 2022). Younkin and Kuppuswamy (2018) further investigated the observed disparity in a laboratory setting using Amazon Mechanical Turkers as a proxy for demand-side participants. They examined whether the Turkers would incorporate race into their assessment of otherwise similar funding requests. The laboratory experiment determined that race was a contributing factor for the proxy demand-side participants in terms of their hypothetical intent to fund. This provides suggestive evidence of discrimination as a driver of the observed disparity on crowdfunding platforms. Like other laboratory experiments, this analysis does not reflect the dynamic nature of real-world markets (Levitt and List 2007) and cannot causally link discrimination to actual transactions.
Employing correspondence study designs to investigate supply-side discrimination necessitates creating fictitious seller profiles, a process that’s both costly and fraught with legal and ethical issues, potentially destabilizing a platform’s market equilibrium. Nevertheless, studies such as Doleac and Stein (2013) and Zussman (2013) have used this approach to randomly vary the participant advertising products in online marketplaces. However, these studies are limited to measuring intent to transact. Moreover, although Doleac and Stein (2013) advertised in over 300 markets, many markets were very thin, and only about 16% of the advertisements overtly indicated race. This potentially skews market dynamics in these smaller markets, as the experiment introduces a possibly nonrepresentative number of minority sellers. It also fails to accurately reflect larger, more diverse markets, potentially missing key aspects of the broader market context (List 2004, Levitt and List 2007). Ayres et al. (2015) sold baseball cards on eBay auctions, varying the race of the hand of the person selling the card. In this auction format, market expertise was critical because of the high potential for misvaluing cards and even encountering fake cards. Notwithstanding, these studies found that products perceived as being sold by minorities faced inferior outcomes.
Our results contribute to the existing literature by providing robust and quantitative evidence of transaction-level discrimination faced by supply-side participants in a dynamic and active marketplace where the products are easily comparable. More importantly, we identify the specific type of discrimination that supply-side participants encounter within an information-heavy marketplace. Notably, the question of discrimination type is intricately tied to strategies aimed at reducing discrimination. Thus, understanding the type of discrimination is critical for evaluating mechanisms that the platform can employ to effectively mitigate discriminatory practices.
The economics literature primarily identifies two types of discrimination in market outcomes: taste-based and statistical discrimination (Arrow 1973). Taste-based discrimination reflects the prejudices or preferences of the consumer (Arrow 1998). In cases of taste-based discrimination, the inherent preferences and animus of market participants toward certain groups render additional information about these groups ineffective in mitigating discrimination. On the other hand, statistical discrimination occurs when consumers discriminate against sellers based on group-level beliefs about members of a racial or ethnic group. These beliefs, underlying statistical discrimination, may be founded on either valid or invalid statistical rationales. Statistical discrimination is typically observed when the cost of acquiring detailed information about individual agents is prohibitively high (Phelps 1972).4 Importantly, statistical discrimination can be mitigated by providing additional individual-level quality information about participants (Castillo and Petrie 2010, Kaas and Manger 2012, Bohren et al. 2019).
Digital marketplaces provide a wealth of information to demand-side participants, including user-generated reviews, images, and detailed descriptions. These platforms actively facilitate transactions by making this information easily accessible. Consequently, the cost of acquiring information is relatively low, potentially minimizing statistical discrimination because of the abundance of available data. This is highlighted by research that shows that user-generated reviews play a significant role in mitigating discrimination faced by demand-side participants (Cui et al. 2020). Therefore, it may be the case that the wealth of available information negates the presence of statistical discrimination facing supply-side participants in these marketplaces.
Laouénan and Rathelot (2022) find, in a cross-sectional observational setting, that reviews can provide useful information and help minimize price gaps between comparable listings of minority and nonminority home-sharing hosts. However, closing the price gap does not guarantee greater equity in realized demand (e.g., transactions). Moreover, the information quality and credibility of user-generated reputation systems have recently come under criticism (Nosko and Tadelis 2015, Tadelis 2016), suggesting that quality uncertainty may not be resolved through the review feedback system. Specifically, user-generated feedback is prone to have an upward bias (Dellarocas and Wood 2008, Bolton et al. 2013, Nosko and Tadelis 2015), which is more pronounced in markets with reciprocal reviews, such as Airbnb (Fradkin et al. 2021, Zervas et al. 2021). In addition, recent studies have highlighted the potential for fraudulent reviews to contaminate the review generation process (Mayzlin et al. 2014, Luca and Zervas 2016). User-generated reviews may also suffer from the same racially motivated biases previously outlined. Consequently, the concerns about the effectiveness of user-generated reviews in facilitating trust are more pronounced when they affect the sellers.
To address whether sellers face statistical discrimination on an information-rich digital marketplace, we explore the impact of a market design choice—quality certification. Specifically, by quasi-randomly varying the assignment of quality certification, we provide an empirical examination of the type of discrimination affecting sellers in such marketplaces. Moreover, we can determine whether quality certification can be utilized as a platform mechanism to mitigate discrimination. Notably, research has found that quality certification is a clear and trustworthy reputation signal (Saeedi 2019, Barach et al. 2020). However, it is important to note that the factors that determine quality certification in our context are all readily visible to the consumer.
Although there is extensive research across various disciplines documenting that additional information can mitigate discrimination (Castillo and Petrie 2010, Kaas and Manger 2012, Younkin and Kuppuswamy 2018, Bohren et al. 2019), the situation becomes less clear in an information-rich digital marketplace. The abundance of information, the clarity of the product offered, and the fact that almost all participants reveal their race/ethnicity all contribute to the complexity of the issue. Furthermore, our results are not derived from controlled laboratory experiments or small samples, but from a dynamic, real-world marketplace. This adds another layer of complexity, as it introduces numerous variables and potential biases that are difficult to control or account for. Therefore, although additional information can potentially reduce discrimination, its effectiveness in a complex, real-world context is not as clear. Research posits that market actors may not deliberately discriminate—that is, they may not actively trade off the different aspects of the transaction (Bertrand et al. 2005). These scholars suggest, in concert with findings from related research in psychology, that consumers may discriminate unintentionally and without awareness (Greenwald et al. 1998). Known as implicit discrimination, this type of discrimination suggests that the additional information provided by a quality certification signal would not bring equal payoff for minority sellers.
In fact, implicit discrimination, along with taste-based discrimination, can exacerbate discrimination by reinforcing stereotypes when additional information is provided. In labor studies, a college degree is often seen as a parallel to quality certification, as it is widely recognized as a credible signal for distinguishing individual abilities among Black employees (Spence 1973). However, Lang and Manove (2011) demonstrated that the return on 16 years of education is significantly less for Black individuals compared with their White counterparts. Similarly, Bertrand and Mullainathan (2004) found that White job applicants generally receive more callbacks than Black applicants, even when race is randomly assigned to similar resumes. Moreover, improving the quality of an applicant (e.g., adding a professional certification to the resume) has a smaller positive effect for Black applicants than for White applicants. Ewens et al. (2014) found that providing potential landlords with positive information about tenants’ histories increased the racial gap in landlord responses, favoring White applicants over Black applicants. Ahmed et al. (2010) also found that providing additional information about potential tenants did not reduce discrimination. These studies suggest that market participants place less weight on signals from Black participants. Therefore, it remains unclear whether quality certification would mitigate or amplify the discrimination faced by Black hosts.
Our findings indicate that statistical discrimination continues to persist, even in the information-rich environment of a home-sharing digital marketplace. The validity and clarity of the information provided by quality certification, which has the potential to reduce information overload (Simon 1971, Dellaert et al. 2012), can significantly mitigate the statistical discrimination faced by sellers, with Black hosts benefiting disproportionately from the quality signal of certification. This occurs despite the presence of other quality signals and the fact that quality certification primarily utilizes information already visible to a consumer.
Importantly, our unique and rich data set, along with the context, allows us to examine the mechanisms driving the disproportionate increase for Black hosts. We are able to investigate both homophily and the overall impact of quality certification on Black hosts, not just those who are certified. Our analysis reveals that, in our setting, the increases for minority sellers are not solely due to a redistribution of transactions, but also to an expansion of the overall market. This suggests that quality certification is not only shifting consumer preferences within the existing market but also attracting new consumers to the platform. Thus, it appears that quality certification can be an effective tool for mitigating discrimination in such marketplaces.
Our work also contributes to the entrepreneurship literature that investigates the racial differences in entrepreneurial participation and success. Digital platforms are often touted for their capacity to democratize access, reducing the role of traditional obstacles to entrepreneurship (Blanchflower et al. 2003, Freeland and Keister 2016, Chetty et al. 2020). Prior studies have examined the potential for digital marketplaces to directly mitigate traditional obstacles facing minority entrepreneurs. Although we do not investigate a digital marketplace’s direct capacity to alleviate traditional obstacles, considering the oft-stated potential for these markets to democratize access and overcome traditional barriers, we contribute by documenting the discrimination affecting the minority entrepreneurs. Our findings also highlight that the discrimination faced by microentrepreneurs in digital markets is at least partly statistical in nature and, therefore, design interventions that support credible information availability can be effective in promoting more equitable outcomes.
3. Empirical Context and Summary Statistics
3.1. Airbnb Overview
As previously outlined, our empirical context is Airbnb, a home-sharing digital marketplace. Airbnb enables microentrepreneurs (hosts) to list their properties for short-term rentals on the platform. Airbnb operates worldwide and is one of the most visible and utilized digital marketplaces for microentrepreneurs engaging in the sharing economy, with over five million hosts as of 2023 (Airbnb, Inc. 2023). Given the nature of the service—individuals sharing their homes with strangers—Airbnb hosts and guests generally provide detailed profiles, which include a profile picture, name, and a brief description of themselves and the property.
To assist guests in the selection process, the platform displays listing characteristics such as the number of rooms, bedrooms, beds, and bathrooms, as well as various pictures of the property. Listings can be shared, meaning the host and the guest may share amenities during the guest’s stay (i.e., guests stay in a room while the host uses other parts of the house), or private, meaning the host and guest do not share the amenities (i.e., the host does not have access to the property during the guest’s stay). Figure 1 shows a sample listing page with information about the host, including the host name and photo, as well as whether the host has been designated a Superhost by the platform.

Note. This figure shows a sample Airbnb listing.
The Superhost certification program is used by Airbnb to provide guests with a clear and visible platform-initiated indicator of host quality. Although guests may utilize user-generated reputation signals, such as average ratings or reviews about the host and the property, the Superhost status is salient and unambiguous as it is binary in nature. Guests who use reviews and ratings to assess quality must examine the content themselves and develop their own metrics to identify hosts who meet an acceptable quality threshold. Moreover, because of the reciprocal nature of reviews (hosts and guests review each other), Airbnb reviews are generally positive, which reduces their discriminant information value (Zervas et al. 2021). On the contrary, Airbnb determines the qualifying criteria for the Superhost status and prominently displays the certification to the guests, simplifying the guest’s decision inputs.
Airbnb assesses whether a host has met the Superhost criteria once every three months. If a host meets the criteria, the host attains Superhost status and keeps that status until the next evaluation period. From the inception of this certification program (2009) until October 2018, Airbnb hosts must have met the following criteria over the previous 365 days to be awarded the Superhost status: (i) hosted at least 10 trips, (ii) maintained a 90% response rate when responding to guests’ requests, (iii) completed all confirmed reservations without cancellation, and (iv) received a five-star review at least 80% of the time.5 Airbnb uses specific “evaluation periods” to assess whether hosts have met the Superhost certification criteria. The three-month evaluation periods begin on January 1st, April 1st, July 1st, and October 1st. Each host’s Superhost status is reevaluated at the beginning of the subsequent evaluation period, usually within 10 days of the start of the evaluation period (i.e., for a January 1st evaluation period, each host’s status is adjusted, if necessary, by January 10th). The Superhost evaluation is based on the host’s previous 365 days, whereas the average rating and number of reviews that guests observe when making their selection are based on the overall historical performance of a listing.
3.2. Our Sample
We obtained data on Airbnb listings from a third-party vendor, AirDNA. These data provide periodic snapshots of a listing’s characteristics (i.e., Superhost status of host, number of beds, number of reviews, etc.) as well as daily reservation information. We independently obtained details on each review written by a guest (with the associated rating, date, and text) as well as host pictures and listing pictures.6 We studied Airbnb listings in 10 major U.S. cities: Boston, Chicago, Dallas, Houston, Los Angeles, Miami, New York City, Oakland, Philadelphia, and Washington, DC. The examined cities have high levels of Airbnb activity as well as diverse populations. This provides an ideal setting to investigate discrimination facing supply-side participants on a digital platform. The observations in our analysis span from July 2016 to October 2018.7
For each reservation the platform facilitates, we observed the date the guest made the booking on the platform—referred to as the Booking Date—and the date the guest would stay at the property—referred to as the Travel Date. This distinction is important because we are concerned with what the consumer was able to view on the website while making their booking. To exemplify the naming conventions, assume a consumer visited the Airbnb website on August 20, 2017, and booked a stay for November 15, 2017. The Booking Date for this reservation is August 20, 2017, and the Travel Date is November 15, 2017. This is important because we are concerned with the Superhost status of a listing on the day the reservation is made (August 20, 2017) and not necessarily the date the booking is for (November 15, 2017). Recall that a host’s Superhost status may change before the Travel Date because it will be reevaluated in October 2017.
For each host, we also collected the profile picture that the host uses on their Airbnb host page. Profile pictures can be used by potential guests to perceive the race of the host. Accordingly, we used these images to predict the perception of the host race (this process is outlined in detail in Section 3.3). Moreover, for each listing, we obtained all of the property images posted by the host. Naturally, these images, particularly the first image, play an important role in shaping the consumers’ perception of a property. Consequently, for each property image, we utilized recent advances in computer vision algorithms to classify the aesthetic appeal of the image (Lennan et al. 2018). This process provides a score for the aesthetic appeal of each image and allowed us to measure the first impression from the property images in a systematic and scalable fashion. Specifically, each image’s aesthetic appeal was measured on a scale from 1–10.
We observed eight Superhost evaluation periods in our study period.8 We examined the Booking Dates in the two months after the evaluation month for all potential Travel Dates in the six months after each evaluation month.9 For example, April 2017 was a Superhost evaluation month, which means that Airbnb hosts were evaluated on the aforementioned Superhost criteria and either obtained, retained, or lost their Superhost certification status. The next evaluation month was July 2017. Therefore, all hosts who obtained the status in April 2017 were guaranteed to keep the certification until the end of June 2017. As such, the Superhost status did not change during May and June 2017. For each listing, we identified the Booking Dates that occurred in May and June 2017, which correspond to Travel Dates on days between May 1, 2017, and October 31, 2017 (a six-month period after the evaluation month, April 2017). Our unit of analysis is the observation for each evaluation period during which a listing was active.10
To leverage a discontinuity-based identification strategy, we identified all observations associated with hosts who had satisfied criteria (i)–(iii) for attaining the Superhost status. These hosts, however, may or may not have satisfied criterion (iv). Thus, for each evaluation period, we dropped any host-period combinations where, in the past 365 days, the host had hosted fewer than 10 trips, maintained a response rate lower than 90% when responding to guests, or had any cancellations. This left us with 30,549 hosts, 53,751 listings, and 154,391 observations, where each observation is associated with one of the eight evaluation periods in which the listing was active.
3.3. Determining the Host’s Race
We relied on the profile picture of a host to label their race. For a subset of the sample, we recruited U.S. residents from Amazon Mechanical Turk (MT), a crowdsourcing marketplace, to provide their predictions for the race for each host. The subset selected consists of hosts who are on the boundary of Superhost status based on the RD design (RDD) identification strategy outlined in Section 4.1. Therefore, these labels are used in that analysis. Our complementary identification strategy (Section 4.3) requires the full set of observations. Considering the costs of using the human-based approach and the reliability of the recent advances in machine learning to label races, we utilized the latest image processing literature to label the remaining hosts. Specifically, we employed the models trained by Kärkkäinen and Joo (2021) to predict the race of each host in our sample. We also used the MT worker-labeled images as a validation sample to assess the credibility of the machine learning approach used for classifying the images.11 Please refer to the Online Appendix for the details on using the machine learning models to predict the race of each host.
Although the MT workers may not always be able to identify the self-identified race of the host, they are ideal for our objective of determining the perceived race of a host. We also recognize the concerns about potential biases in labeling pictures of minorities through machine learning methods. Moreover, machine learning methods are optimized to predict the race of the individual and not necessarily the perception of race. For example, these algorithms may identify certain races by a person’s bone structure, which may not align with how individuals perceive a person’s race. As such, our complementary approach allows us to improve trust in the images labeled through the machine learning methods.
For the human-based approach, we recruited MT workers for labeling all the hosts (10,280 hosts) who were part of the discontinuity design (see Section 4.1). Each host profile picture was initially assigned to three MT workers. Each MT worker was asked to label the individual(s) in the picture from the following criteria: no faces, more than one face, Black, White, East Asian (e.g., China, Japan, …), South Asian (e.g., India, Pakistan, …), Latino/Hispanic, unknown, and combination of two or more races. If all three MT workers agreed on the race classification, the host was labeled based upon the unanimous classification indicated by the workers. If the three workers did not agree, we assigned an additional two workers to classify the host’s profile picture, increasing the number of workers to five for that specific picture. If four out of the five workers agreed on a classification, we assigned the host the race with the majority classification. In cases where fewer than four MT workers agreed on a race, we assigned a further five MT workers, taking the total number of workers assigned to classify the host’s profile picture to 10. If 7 out of 10 workers agreed, we assigned the host’s race to the agreed-upon classification. Otherwise, we assigned the host race as unknown because the workers did not reach a consensus on the classification for the host’s picture.
If the MT workers classified a host as “no faces,” the host does not have a profile picture that shows a face. These could be pictures of rooms, animals, etc. Also, in cases where the MT workers classified the profile picture as a “combination of two or more races,” we conducted a secondary procedure and requested the workers to identify whether all the races in the picture are the same. If the MT workers agreed that this is the case, we labeled the host accordingly. Otherwise, we assigned the host race as unknown.
3.4. Variables and Summary Statistics
As the key performance metric of market outcomes, we calculated the # of Reservations and the # of Booked Days associated with each observation. # of Reservations refers to the number of unique reservations made for a listing as of a specific observation period. It captures the number of guests who are willing to transact with a particular host. # of Booked Days refers to the total booked days corresponding to the reservations.
We utilized an extensive set of listing- and host-level control variables from our rich data set. These variables enabled us to account for factors that may impact a listing’s performance beyond the Superhost status. We included Price ($), the average posted price of any available days in the six months that are considered as future bookable days, to account for price-related performance differences. This is also important to account for potential baseline differences in prices charged by Black hosts compared with other hosts. To control for the fact that some listings may have greater availability, we included Available Days, which is the number of available days in the six months considered as potential Travel Dates.
Although price is often used by consumers as a proxy for quality, we also include variables to account for the fact that the competitive impact of Price ($) may change because of the location and listing type (shared or private listing). Although two listings from different areas may have similar prices, these listings may encounter different competitive pressures depending on the prices of competing listings in their respective localities. Therefore, we also included localized market-level price variables, defining markets at the census tract level.12 Specifically, to account for differences in price distributions across census tracts, we included Price Tract Quartile, which refers to the quartile of Price ($) as compared with the price of other listings in listing i’s census tract that are of the same listing type (shared versus whole home) during evaluation period t. This provides a relative metric to compare each listing’s prices with similar listings in its vicinity. We also include Tract Price Var., which calculates the variance of the average prices posted by all listings of the same type (shared or whole home listings) in listing i’s census tract during period t. This helps to account for the price dispersion in the listing’s census tract.
The performance of a listing may be subject to temporal changes in the popularity of a location, perhaps because of an event that attracted a significant number of guests to an area. As such, we included Tract Revenue Share, which refers to the proportion of Airbnb revenue that was earned by all listings in listing i’s census tract relative to all Airbnb revenue in listing i’s city during evaluation period t. This captures the popularity, among Airbnb guests, of the listing’s vicinity at a specific time. This also assuages concerns that our findings may be a result of inherent differences across the locations that different groups reside in.
Another important factor associated with the relative competitiveness of a locality is the ratio of competing Superhosts. Listings in locations where a larger proportion of local competitors are Superhosts may not benefit as much from the Superhost assignment. To account for the local tract-level competition related to competing Superhosts, we also included Tract Superhost Ratio and Tract Prev. Superhost Ratio. Tract Superhost Ratio refers to the proportion of listings in listing i’s census tract that were managed by Superhosts. If a greater proportion of hosts are Superhosts, this can dampen the benefit of obtaining Superhost status. Tract Prev. Superhost Ratio is the same except it is measured for the immediate past evaluation period. This accounts for any changes to the competitive landscape of a listing’s census tract with regard to competing Superhosts. Additionally, we included Prev. Host Superhost (1/0), which is a binary variable indicating whether the host was a Superhost in the previous period.
We also included factors that impact a listing’s performance based on the information made available by the platform to assist potential guests. Number of Reviews and Average Rating refer to the count and mean rating of the user-generated reviews that a listing has accrued over its lifetime, respectively. These are visible to the guest as they make their decision. Because hosts may have multiple listings (approximately 60% of listings in our sample correspond to hosts with multiple listings), Airbnb also makes the aggregated host-level reviews available to guests. Moreover, the aggregated host number of reviews is also available to potential consumers. Therefore, # of Host Reviews refers to the number of the user-generated reviews a host has accrued.13 Such user-generated evaluations may assist guests in selecting potential listings.
To further account for the appeal of a listing, Image Aesthetic Score refers to the aesthetic appeal score of the listing’s main image. It ranges from 1–10, where a higher number signifies greater aesthetic appeal. As previously outlined, we utilized the deep learning approach outlined in Lennan et al. (2018) to obtain this measure. Moreover, Instant Bookable (1/0) refers to an optional feature that the host can use to enable potential guests to book their property without the host’s approval. This essentially eliminates the screening possibilities by the host. Shared Listing (1/0) refers to whether the guest will be sharing the lodging with the host during their stay (Shared Listing) or not (Whole Home Listing). We also included Bedrooms and Bathrooms that each listing provides. Table 1 provides summary statistics for the variables used in our analysis. It also includes the proportion of Black hosts and White hosts in the data set.
|

Table 1. Summary Statistics
| Count | Mean | Min | 25th Perc. | Median | 75th Perc. | Max | |
|---|---|---|---|---|---|---|---|
| # of Reservations | 154,391 | 7.85 | 0.00 | 2.00 | 6.00 | 12.00 | 94.00 |
| # of Booked Days | 154,391 | 29.38 | 0.00 | 10.00 | 27.00 | 44.00 | 177.00 |
| Price ($) | 154,391 | 124.76 | 10.01 | 65.87 | 97.60 | 147.76 | 2,348.98 |
| Available Days | 154,391 | 156.63 | 1.00 | 120.00 | 171.00 | 203.00 | 245.00 |
| Price Tract Quartile | 154,391 | 1.34 | 0.00 | 0.00 | 1.00 | 2.00 | 3.00 |
| Tract Revenue Share | 154,391 | 0.01 | 0.00 | 0.00 | 0.00 | 0.01 | 0.13 |
| Tract Price Var. | 154,391 | 2.94 | 0.00 | 0.18 | 1.02 | 3.09 | 166.99 |
| Tract Superhost Ratio | 154,391 | 0.22 | 0.00 | 0.10 | 0.17 | 0.29 | 1.00 |
| Tract Prev. Superhost Ratio | 154,391 | 0.18 | 0.00 | 0.08 | 0.14 | 0.25 | 1.00 |
| Prev. Host Superhost (1/0) | 154,391 | 0.47 | 0.00 | 0.00 | 0.00 | 1.00 | 1.00 |
| Number of Reviews | 154,391 | 51.72 | 1.00 | 16.00 | 35.00 | 69.00 | 601.00 |
| Average Rating | 154,391 | 94.72 | 20.00 | 93.00 | 96.00 | 98.00 | 100.00 |
| # of Host Reviews | 154,391 | 143.17 | 1.00 | 34.00 | 70.00 | 150.00 | 3,519.00 |
| Image Aesthetic Score | 154,391 | 5.05 | 3.05 | 4.80 | 5.07 | 5.32 | 6.71 |
| Instant Bookable (1/0) | 154,391 | 0.39 | 0.00 | 0.00 | 0.00 | 1.00 | 1.00 |
| Shared Listing (1/0) | 154,391 | 0.40 | 0.00 | 0.00 | 0.00 | 1.00 | 1.00 |
| Num. of Bathrooms | 154,391 | 1.23 | 0.00 | 1.00 | 1.00 | 1.00 | 25.00 |
| Num. of Bedrooms | 154,391 | 1.28 | 0.00 | 1.00 | 1.00 | 2.00 | 21.00 |
| Prop. Black Hosts | 154,391 | 0.08 | 0.00 | 0.00 | 0.00 | 0.00 | 1.00 |
| Prop. White Hosts | 154,391 | 0.63 | 0.00 | 0.00 | 1.00 | 1.00 | 1.00 |
Notes. This table presents the summary statistics for all observations (listing/period combinations) in our sample. Perc., percentile; Num., number; Prop., proportion.
We also construct an additional variable based on the Superhost requirement of receiving at least 80% five-star reviews as previously described. For each host, we calculated the number of additional five-star reviews the host would have needed to obtain to reach the 80% threshold. We name this variable 5-Star Review Deficit. For example, if a host has received eight total reviews over the past year, and six are five-star reviews, that host has 75% () five-star reviews. A host with eight total reviews would need at least seven five-star reviews () to meet the 80% minimum threshold and obtain Superhost status. Therefore, the value of 5-Star Review Deficit would be one for this host (recall, the host had six five-star reviews).14 This host would not be assigned Superhost status. This host would need 5-Star Review Deficit to have a value of zero, or lower, to obtain Superhost status. We utilized the 5-Star Review Deficit to identify the hosts on the margins of obtaining Superhost status. Specifically, we refer to the subset of hosts where 5-Star Review Deficit equals zero as Marginal Superhosts, and the subset of hosts where 5-Star Review Deficit equals one as Marginal Non-Superhosts for a specific evaluation period.
Table 2 provides a comparison of mean values between Superhosts and non-Superhosts for all observations (columns 1–3) and the Marginal Superhosts and Marginal Non-Superhosts (columns 4–6). The comparison in the full sample (columns 1–3) indicates that, as expected, Superhosts outperform non-Superhosts across both performance metrics. Listings managed by Superhosts have more reservations and booked days.
|
Table 2. Summary Statistics: Superhosts
| All hosts | Hosts on margin of Superhost status | |||||
|---|---|---|---|---|---|---|
| All | Superhosts | Non-Superhosts | All | Superhosts | Non-Superhosts | |
| (1) | (2) | (3) | (4) | (5) | (6) | |
| Observations | 154,391 | 89,289 | 65,102 | 22,248 | 11,183 | 11,065 |
| # of Reservations | 7.85 | 7.96 | 7.71 | 5.98 | 6.13 | 5.82 |
| # of Booked Days | 29.38 | 29.54 | 29.15 | 24.86 | 25.54 | 24.17 |
| Price ($) | 124.76 | 129.97 | 117.61 | 124.50 | 124.30 | 124.70 |
| Available Days | 156.63 | 153.82 | 160.48 | 148.09 | 147.54 | 148.65 |
| Price Tract Quartile | 1.34 | 1.38 | 1.29 | 1.39 | 1.39 | 1.38 |
| Tract Revenue Share | 0.7% | 0.7% | 0.6% | 0.6% | 0.6% | 0.6% |
| Tract Price Var. | 2.94 | 3.25 | 2.52 | 2.71 | 2.80 | 2.61 |
| Tract Superhost Ratio | 21.6% | 26.8% | 14.4% | 20.0% | 24.4% | 15.6% |
| Tract Prev. Superhost Ratio | 18.2% | 22.1% | 12.9% | 16.0% | 17.3% | 14.6% |
| Prev. Host Superhost (1/0) | 0.47 | 0.75 | 0.08 | 0.31 | 0.42 | 0.20 |
| Number of Reviews | 51.72 | 54.52 | 47.87 | 34.38 | 34.98 | 33.78 |
| Average Rating | 94.72 | 97.17 | 91.37 | 94.82 | 95.53 | 94.10 |
| # of Host Reviews | 143.17 | 134.97 | 154.41 | 56.52 | 55.82 | 57.23 |
| Image Aesthetic Score | 5.05 | 5.07 | 5.02 | 5.03 | 5.04 | 5.01 |
| Instant Bookable (1/0) | 0.39 | 0.36 | 0.42 | 0.32 | 0.33 | 0.31 |
| Shared Listing (1/0) | 0.40 | 0.39 | 0.42 | 0.41 | 0.40 | 0.42 |
| Num. of Bathrooms | 1.23 | 1.24 | 1.22 | 1.19 | 1.20 | 1.19 |
| Num. of Bedrooms | 1.28 | 1.29 | 1.26 | 1.26 | 1.26 | 1.27 |
| Prop. Black Hosts | 8.4% | 7.2% | 10.0% | 10.0% | 9.7% | 10.3% |
| Prop. White Hosts | 62.9% | 66.9% | 57.3% | 63.1% | 63.7% | 62.6% |
Notes. This table presents the summary statistics comparing the Superhosts and non-Superhosts in our data. Columns 1–3 provide statistics for the full sample of hosts and can be matched to Table 1. Columns 4–6 consist of hosts who are on the margin regarding their Superhost certification.
Columns 4–6 of Table 2 provide statistics for the subset of hosts who are on the margins of fulfilling Superhost criteria. The results indicate a clear difference between the performance metrics. Reassuringly, the gap between Superhosts and non-Superhosts for other variables is significantly reduced in the marginal sample. This provides evidence that the marginal hosts are highly comparable.15 In Section 4.1, we investigate these differences more thoroughly and find significant evidence that the two groups are highly comparable and members of either group cannot systematically manipulate whether they obtain the Superhost status.
Our objective in this study is to examine whether the Superhost assignment has a different impact for Black hosts. If it does, this is indicative of statistical discrimination. Table 3 shows the statistics for the marginal subsample for Black and White hosts, respectively. Comparing columns 1 and 4, which show the statistics for all Black and all White hosts, respectively, Black hosts generally have a higher number of reservations and booked days. However, the lower prices entail that this does not necessarily translate to greater revenue, especially given the clear difference in prices. Notably, there is not a large difference between the average ratings of the two groups of hosts, indicating that the quality of the offering may not be starkly different. Moreover, Black hosts are much more likely to forgo screening and utilize Instant Bookable and are generally located in areas that obtain lower revenue in general, as observed by the difference in Tract Revenue Share. Columns 2, 3, 4, and 5 of Table 3 show the differences between Black and White Superhosts/non-Superhosts, respectively. The statistics indicate that Black Superhosts outperform Black non-Superhosts considerably compared with the difference between White Superhosts and non-Superhosts. This provides initial suggestions of statistical discrimination and the potential for the Superhost status to promote equitable outcomes.
|
Table 3. Summary Statistics: Marginal Superhosts by Race
| Black hosts | White hosts | |||||
|---|---|---|---|---|---|---|
| All | Superhosts | Non-Superhosts | All | Superhosts | Non-Superhosts | |
| (1) | (2) | (3) | (4) | (5) | (6) | |
| Observations | 1,902 | 966 | 936 | 11,640 | 6,011 | 5,629 |
| # of Reservations | 5.93 | 6.33 | 5.51 | 5.72 | 5.88 | 5.55 |
| # of Booked Days | 25.10 | 26.65 | 23.51 | 24.47 | 25.05 | 23.84 |
| Price ($) | 96.88 | 96.60 | 97.17 | 130.37 | 129.21 | 131.61 |
| Available Days | 158.41 | 157.26 | 159.59 | 142.97 | 143.22 | 142.71 |
| Price Tract Quartile | 1.34 | 1.35 | 1.32 | 1.38 | 1.38 | 1.38 |
| Tract Revenue Share | 0.3% | 0.3% | 0.3% | 0.6% | 0.6% | 0.6% |
| Tract Price Var. | 2.12 | 2.12 | 2.11 | 2.88 | 3.03 | 2.71 |
| Tract Superhost Ratio | 21.0% | 27.2% | 14.5% | 19.8% | 23.5% | 15.9% |
| Tract Prev. Superhost Ratio | 16.0% | 18.0% | 14.0% | 16.1% | 17.5% | 14.5% |
| Prev. Host Superhost (1/0) | 0.31 | 0.43 | 0.19 | 0.33 | 0.45 | 0.21 |
| Number of Reviews | 33.38 | 34.17 | 32.58 | 36.50 | 36.78 | 36.21 |
| Average Rating | 94.50 | 95.16 | 93.82 | 94.95 | 95.67 | 94.19 |
| # of Host Reviews | 47.71 | 48.77 | 46.62 | 58.28 | 56.60 | 60.07 |
| Image Aesthetic Score | 4.95 | 4.95 | 4.94 | 5.03 | 5.04 | 5.02 |
| Instant Bookable (1/0) | 0.39 | 0.41 | 0.36 | 0.28 | 0.29 | 0.28 |
| Shared Listing (1/0) | 0.49 | 0.49 | 0.50 | 0.39 | 0.38 | 0.40 |
| Num. of Bathrooms | 1.18 | 1.17 | 1.19 | 1.18 | 1.19 | 1.17 |
| Num. of Bedrooms | 1.24 | 1.22 | 1.25 | 1.25 | 1.25 | 1.25 |
Note. This table presents the summary statistics comparing the Superhosts and non-Superhosts for the marginal set of Superhosts further delineated by Black and White hosts, respectively.
To further examine the Black and White Superhosts, we next focused on majority-Black census tracts. Table 4 presents the statistics for listings that are strictly in census tracts where more than 50% of the residents are Black. This subsample allows us to compare the Superhost benefit differences in areas where listings are more similar. This is supported by the similarities in Price ($) observed in Table 4 as compared with Table 3. A comparison of columns 1 and 4 indicates that White hosts generally outperform Black hosts. However, the gain from the Superhost status is significantly higher for Black hosts. This provides further evidence that the trends observed are not simply a result of Black hosts residing in areas that are more amenable to gains related to obtaining the certification.
|
Table 4. Summary Statistics: Marginal Superhosts by Race; Majority-Black Census Tracts
| Black hosts | White hosts | |||||
|---|---|---|---|---|---|---|
| All | Superhosts | Non-Superhosts | All | Superhosts | Non-Superhosts | |
| (1) | (2) | (3) | (4) | (5) | (6) | |
| Observations | 935 | 477 | 458 | 892 | 491 | 401 |
| # of Reservations | 5.63 | 6.19 | 5.05 | 5.76 | 5.97 | 5.50 |
| # of Booked Days | 24.00 | 26.25 | 21.65 | 24.93 | 25.48 | 24.26 |
| Price ($) | 94.74 | 93.72 | 95.81 | 96.32 | 96.83 | 95.69 |
| Available Days | 161.25 | 160.94 | 161.57 | 139.83 | 140.79 | 138.64 |
| Price Tract Quartile | 1.37 | 1.32 | 1.42 | 1.35 | 1.37 | 1.33 |
| Tract Revenue Share | 0.1% | 0.1% | 0.1% | 0.2% | 0.2% | 0.2% |
| Tract Price Var. | 1.84 | 1.50 | 2.18 | 1.88 | 1.97 | 1.78 |
| Tract Superhost Ratio | 22.2% | 30.3% | 13.7% | 21.8% | 27.1% | 15.2% |
| Tract Prev. Superhost Ratio | 16.2% | 18.5% | 13.7% | 16.7% | 19.2% | 13.7% |
| Prev. Host Superhost (1/0) | 0.33 | 0.45 | 0.20 | 0.32 | 0.45 | 0.16 |
| Number of Reviews | 34.01 | 34.19 | 33.82 | 36.25 | 36.51 | 35.93 |
| Average Rating | 94.49 | 95.28 | 93.67 | 95.10 | 95.58 | 94.52 |
| # of Host Reviews | 50.43 | 50.07 | 50.79 | 61.22 | 54.88 | 69.00 |
| Image Aesthetic Score | 4.92 | 4.95 | 4.90 | 5.03 | 5.04 | 5.02 |
| Instant Bookable (1/0) | 0.36 | 0.39 | 0.33 | 0.33 | 0.33 | 0.33 |
| Shared Listing (1/0) | 0.49 | 0.48 | 0.49 | 0.50 | 0.51 | 0.49 |
| Num. of Bathrooms | 1.19 | 1.19 | 1.20 | 1.20 | 1.22 | 1.17 |
| Num. of Bedrooms | 1.30 | 1.30 | 1.29 | 1.29 | 1.30 | 1.28 |
Notes. This table presents the summary statistics in census tracts where more than 50% of residents are Black. The table compares the Superhosts and non-Superhosts for the marginal set of Superhosts further delineated by Black and White hosts, respectively.
4. Identification Strategies and Results
Our goal is to investigate the presence of statistical discrimination facing Black Airbnb hosts, despite the information-rich Airbnb marketplace, and, more importantly, whether quality certification can mitigate it. Our identification challenge is to identify the conditional average treatment effect (ATE) of quality certification assignment conditional on the host’s race. Importantly, Superhost status does not change the innate quality of a listing (e.g., more rooms or offer of additional amenities). To present our identification strategy, we formalize the causal effects of the Superhost assignment based on the potential outcomes framework (Imbens and Rubin 2015). Specifically, and correspond to the outcome we would have observed had listing i been assigned Superhost status (1) or not assigned Superhost status (0) during period t. The causal effect of the Superhost status is represented by the difference . The fundamental problem of not observing the pair and is overcome by focusing on the average effects of the treatment. Because we are analyzing a nonexperimental observational setting, we require unconfoundedness to identify the causal average treatment effects. Unconfoundedness refers to the assumption that, conditional on covariates, Xi,t, the assignment of Superhost status is as good as random (Rosenbaum and Rubin 1983):
Admittedly, the Superhost status assignment is not random. Naturally, the host qualities that enable a host to attain the Superhost status may also influence the outcome variables of interest. To overcome this challenge, we utilize two distinct identification strategies to satisfy the unconfoundedness assumption and estimate the heterogeneous impact of Superhost assignment on host outcomes. First, we exploit the quasi-random nature of Airbnb’s Superhost program and identify hosts who are on the margins (either slightly above or below) of fulfilling the necessary certification criteria. Essentially, this discontinuity allows us to use an RDD (Hahn et al. 2001, Lee and Lemieux 2010). Because the marginal hosts have imprecise control over the Superhost assignment, the unconfoundedness assumption is satisfied from the local randomized assignment on either side of the discontinuity. Although the strength of RD is that it is a much closer cousin of randomized experiments and the unconfoundedness is trivially satisfied (Hahn et al. 2001, Lee and Lemieux 2010), there are often concerns about extrapolations of estimates away from the threshold. Consequently, as a second identification strategy, we employ a doubly robust machine learning approach, introduced in Chernozhukov et al. (2018), that uses orthogonalization and cross-fitting in the full sample. It allows a more flexible specification of treatment assignment through nonparametric estimation as well as ensuring that the estimator is “doubly robust” to misspecification of either the outcome or propensity of treatment (Chernozhukov et al. 2018, Wager and Athey 2018).
4.1. Identification Based on Regression Discontinuity Design
Our first identification strategy exploits the discontinuity in 5-Star Review Deficit used to identify the Marginal Superhosts and the Marginal Non-Superhosts. As long as the marginal hosts are unable to precisely manipulate the reviews they receive such that 5-Star Review Deficit increases from zero to one, the Superhost assignment is akin to a locally randomized experiment. Figure 2 presents a histogram of the assignment variable—5-Star Review Deficit. As desired, there is no unusual jump from zero (Marginal Superhosts) to one (Marginal Non-Superhosts). Moreover, if the assignment is locally random, the covariates determined prior to the assignment for both Marginal Superhosts and Marginal Non-Superhosts should not have significant differences. Table 5 presents statistics that examine the differences between the hosts where 5-Star Review Deficit equals zero and one, respectively.16 Because assignment is quasi-random in this set, we would expect that there is little difference in the variables corresponding to the previous Superhost assignment period. We examine previous period values for the following: Price ($), Available Days, Price Tract Quartile, Tract Revenue Share, # of Host Reviews, and Instant Bookable (1/0). We also compare factors that do not change over time: Bedrooms, Bathrooms, Image Aesthetic Score, and Shared Listing (1/0). The results indicate that the marginal subsample is similar across all the dimensions. Although some means are statistically different, the magnitude of the differences is minimal. This is more evident when we compare the analogous results for hosts with 5-Star Review Deficit values equal to 3 and −2, respectively. This set compares hosts who are not on the margins (Superhosts who had two more than the necessary number of five-star reviews and non-Superhosts who missed it by three five-star reviews). These comparisons are available in Table 6. The differences observed in Table 6 are significantly larger as compared with Table 5. This provides evidence that, although hosts can affect their overall quality, they cannot precisely manipulate at the threshold.
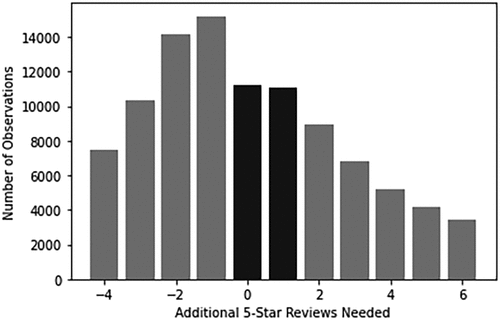
Notes. This figure plots the number of observations in the data set based on the 5-Star Review Deficit variable. Hosts with 5-Star Review Deficit equal to zero have exactly the right number of five-star reviews to attain Superhost status, whereas hosts with 5-Star Review Deficit equal to one need one additional five-star review to attain Superhost status. The figure shows that there is not a discernable difference in the number of observations for hosts who are on the margin of attaining Superhost status.
|
Table 5. Comparing Averages Between Marginal Superhosts and Marginal Non-Superhosts
| Non-Superhosts | Superhosts | |||||
|---|---|---|---|---|---|---|
| Mean | St. Dev. | Mean | St. Dev. | T-Stat. | p-value | |
| Previous Period Posted Price | 124.09 | 103.82 | 123.57 | 95.88 | 0.39 | 0.70 |
| Previous Period Available Days | 155.35 | 61.41 | 155.01 | 60.60 | 0.41 | 0.68 |
| Previous Period Price Tract Quartile | 1.38 | 1.10 | 1.39 | 1.10 | −0.50 | 0.62 |
| Previous Period Tract Revenue Share | 0.01 | 0.01 | 0.01 | 0.01 | −1.27 | 0.21 |
| Previous Period # of Host Reviews | 57.23 | 79.08 | 55.82 | 65.13 | 1.45 | 0.15 |
| Image Aesthetic Score | 5.01 | 0.42 | 5.04 | 0.42 | −3.91 | 0.00 |
| Previous Period Instant Bookable (1/0) | 0.29 | 0.45 | 0.31 | 0.46 | −3.34 | 0.00 |
| Shared Listing (1/0) | 0.42 | 0.49 | 0.40 | 0.49 | 2.35 | 0.02 |
| Num. of Bedrooms | 1.27 | 0.81 | 1.26 | 0.79 | 0.46 | 0.65 |
Notes. This table presents statistics comparing the listings whose hosts have exactly the right number of five-star reviews to obtain Superhost status (marginal Superhosts) and hosts who need exactly one more five-star review (marginal non-Superhosts). T-Stat., t statistic.
|
Table 6. Comparing Averages Between Superhosts and Non-Superhosts: Three Reviews Away from Margin
| Non-Superhosts | Superhosts | |||||
|---|---|---|---|---|---|---|
| Mean | St. Dev. | Mean | St. Dev. | T-Stat. | p-value | |
| Previous Period Posted Price | 123.32 | 101.17 | 133.17 | 119.06 | −6.21 | 0.00 |
| Previous Period Available Days | 163.17 | 57.79 | 157.38 | 57.02 | 6.82 | 0.00 |
| Previous Period Price Tract Quartile | 1.41 | 1.09 | 1.43 | 1.10 | −1.19 | 0.24 |
| Previous Period Tract Revenue Share | 0.01 | 0.01 | 0.01 | 0.01 | 1.68 | 0.09 |
| Previous Period # of Host Reviews | 81.96 | 97.00 | 66.76 | 93.42 | 12.38 | 0.00 |
| Image Aesthetic Score | 5.06 | 0.40 | 5.06 | 0.40 | 0.70 | 0.48 |
| Previous Period Instant Bookable (1/0) | 0.31 | 0.46 | 0.29 | 0.45 | 2.98 | 0.00 |
| Shared Listing (1/0) | 0.40 | 0.49 | 0.41 | 0.49 | −0.58 | 0.56 |
| Num. of Bedrooms | 1.31 | 0.83 | 1.31 | 0.84 | 0.50 | 0.62 |
Note. This table presents the summary statistics comparing the listings of Superhosts who had two more than the necessary number of five-star reviews and non-Superhosts who missed the 80% cutoff by three five-star reviews.
We use a linear regression to estimate the treatment effect as well as the heterogeneity in the effect for the Black hosts. We include the extensive set of listing-specific control variables outlined previously in the model. The covariate ensures selection on observables and helps to account for sampling variability in the estimates (Lee and Lemieux 2010). As such, for the marginal set of hosts, we estimate the following equation:
4.2. RDD Results
Table 7 presents the results estimating the impact of Airbnb certification on a listing’s performance (measured by # of Reservations and # of Booked Days) based on the RDD identification strategy outlined in Section 4.1. Columns 1 and 4 present the results excluding the binary Black host indicator and the corresponding interaction term. This specification recovers the overall average effect of attaining Superhost status. The results, unsurprisingly, indicate that obtaining Superhost status has a positive impact on the performance of a listing. Specifically, attaining Superhost status increases reservations by approximately 7.68% and booked days by approximately 11.85%. Although unsurprising, these results confirm the importance of quality certification for the decisions that platform demand-side participants make. Our results indicate that Airbnb listings whose hosts marginally attain Superhost status significantly outperform comparable listings whose hosts fell short of attaining Superhost status by one five-star review. The coefficients associated with the various control variables are also reassuringly consistent with our expectations. Listings with more reviews and higher average ratings perform better. Moreover, listings in census tracts with a greater share of revenue as well as those with a higher aesthetic score for the listing main image perform better as well.
|
Table 7. RDD Estimates of Superhost Impact
| log(# of Reservations) | log(# of Booked Days) | |||||
|---|---|---|---|---|---|---|
| (1) | (2) | (3) | (4) | (5) | (6) | |
| Superhost | 0.074*** | 0.067*** | 0.063*** | 0.112*** | 0.102*** | 0.080*** |
| (0.011) | (0.012) | (0.015) | (0.017) | (0.017) | (0.023) | |
| Black Host (1/0) | −0.144*** | −0.127*** | −0.188*** | −0.200*** | ||
| (0.026) | (0.028) | (0.041) | (0.043) | |||
| Superhost × Black Host (1/0) | 0.092** | 0.090** | 0.128** | 0.134** | ||
| (0.036) | (0.038) | (0.055) | (0.057) | |||
| log(Price ($)) | −0.212*** | −0.220*** | −0.228*** | −0.415*** | −0.424*** | −0.455*** |
| (0.015) | (0.015) | (0.019) | (0.023) | (0.024) | (0.030) | |
| log(Available Days) | 0.430*** | 0.433*** | 0.437*** | 0.663*** | 0.666*** | 0.682*** |
| (0.006) | (0.006) | (0.008) | (0.010) | (0.010) | (0.012) | |
| Price Tract Quartile | −0.070*** | −0.070*** | −0.059*** | −0.049*** | −0.049*** | −0.039*** |
| (0.006) | (0.006) | (0.007) | (0.009) | (0.009) | (0.012) | |
| Tract Price Var. | −0.002* | −0.002* | −0.002 | −0.002 | −0.002 | −0.002 |
| (0.001) | (0.001) | (0.002) | (0.002) | (0.002) | (0.003) | |
| Tract Revenue Share | 9.675*** | 9.576*** | 9.805*** | 13.760*** | 13.634*** | 13.937*** |
| (0.713) | (0.713) | (0.909) | (1.067) | (1.067) | (1.361) | |
| Tract Superhost Ratio | −0.124*** | −0.126*** | −0.089 | −0.218*** | −0.222*** | −0.150 |
| (0.048) | (0.048) | (0.065) | (0.071) | (0.072) | (0.098) | |
| Prev. Tract Superhost Ratio | 0.050 | 0.050 | −0.020 | 0.047 | 0.048 | −0.023 |
| (0.055) | (0.055) | (0.074) | (0.082) | (0.082) | (0.114) | |
| Prev. Host Superhost (1/0) | −0.151*** | −0.150*** | −0.126*** | −0.158*** | −0.157*** | −0.126*** |
| (0.012) | (0.012) | (0.015) | (0.019) | (0.019) | (0.023) | |
| log(Number of Reviews) | 0.254*** | 0.255*** | 0.259*** | 0.368*** | 0.369*** | 0.368*** |
| (0.007) | (0.007) | (0.009) | (0.011) | (0.011) | (0.015) | |
| Average Rating | 0.010*** | 0.010*** | 0.012*** | 0.016*** | 0.016*** | 0.019*** |
| (0.001) | (0.001) | (0.002) | (0.002) | (0.002) | (0.003) | |
| log(Host Number of Reviews) | 0.057*** | 0.055*** | 0.045*** | 0.000 | −0.002 | −0.006 |
| (0.008) | (0.008) | (0.010) | (0.012) | (0.012) | (0.016) | |
| Image Aesthetic Score | 0.122*** | 0.118*** | 0.103*** | 0.151*** | 0.147*** | 0.120*** |
| (0.012) | (0.012) | (0.016) | (0.019) | (0.019) | (0.024) | |
| Instant Bookable (1/0) | 0.465*** | 0.467*** | 0.411*** | 0.498*** | 0.500*** | 0.443*** |
| (0.011) | (0.011) | (0.014) | (0.016) | (0.016) | (0.021) | |
| Shared Listings (1/0) | −0.253*** | −0.256*** | −0.259*** | −0.482*** | −0.486*** | −0.503*** |
| (0.015) | (0.015) | (0.019) | (0.023) | (0.023) | (0.029) | |
| Num. of Bedrooms | 0.101*** | 0.103*** | 0.113*** | 0.130*** | 0.132*** | 0.144*** |
| (0.008) | (0.008) | (0.011) | (0.012) | (0.012) | (0.016) | |
| Num. of Bathrooms | 0.025** | 0.027** | 0.012 | 0.033* | 0.035* | 0.036 |
| (0.012) | (0.012) | (0.018) | (0.019) | (0.019) | (0.029) | |
| Period fixed effects | Yes | Yes | Yes | Yes | Yes | Yes |
| City fixed effects | Yes | Yes | Yes | Yes | Yes | Yes |
| Constant | −1.971*** | −1.910*** | −2.017*** | −1.998*** | −1.921*** | −2.054*** |
| (0.172) | (0.173) | (0.217) | (0.269) | (0.270) | (0.353) | |
| Observations | 22,248 | 22,248 | 13,542 | 22,248 | 22,248 | 13,542 |
| R2 | 0.360 | 0.361 | 0.358 | 0.314 | 0.315 | 0.318 |
Note. Robust standard errors are reported in parentheses.
*p < 0.10; **p < 0.05; ***p < 0.01.
Although the results presented thus far indicate the importance of quality certification, our objective is to examine the presence of statistical discrimination facing Black Airbnb hosts. Furthermore, we seek to investigate whether the clarity of the quality certification signals can mitigate some of this discrimination. To accomplish this, we assess the heterogeneity of platform certification as it relates to the host’s race. Columns 2 and 5 of Table 7 include a binary variable that indicates whether the race of the listing’s host is Black (Equation (2)). The results indicate that Black hosts who attain Superhost status increase their reservations (booked days) by approximately 17.23% (25.86%). Conversely, the results indicate that all other hosts (hosts who were not identified as Black) increase their reservations (booked days) by approximately 6.93% (10.74%). Therefore, Black hosts are benefiting from attaining Superhost status with an additional increase in reservations (booked days) of 10.30 (15.12) percentage points. For both reservations and booked days, the difference indicates that Black hosts benefit by more than 1.5 times that of all other hosts. The results show that Black hosts generally perform significantly worse when compared with White hosts, with the coefficient associated with Black Host (1/0) indicating that Black hosts accrue approximately 13.41% fewer reservations and 17.14% fewer booked days, on average, than other hosts. These findings offer compelling evidence of statistical discrimination faced by Black Airbnb hosts, even within the information-rich Airbnb marketplace. Moreover, the results also indicate that the quality certification signal can mitigate some of this discrimination. Columns 3 and 6 show the analogous results for a subsample of hosts only including Black and White hosts. The results are consistent with those in columns 2 and 5, indicating that Black hosts benefit significantly more than other hosts from attaining Superhost status.
4.3. Identification Using the Doubly Robust Machine Learning Approach
As previously outlined, the RDD estimates the localized treatment effects based on the local random assignment in the marginal sample. A limitation of studying the marginal set of hosts is that we are unable to generalize the findings to the full set of hosts in our sample. Therefore, we utilize a DML approach (Chernozhukov et al. 2018), in conjunction with Causal Forests (CF) (Wager and Athey 2018), to recover causal estimates in the full sample (beyond the marginal set of hosts) and complement the RDD. Moreover, CF nonparametrically identifies heterogeneity in the treatment effect. Specifically, CF obtains consistent and asymptotically normal individual treatment effects (ITEs) for each observation. This is desirable given our objective is to assess whether host race matters in determining the demand gains due to quality certification. It also enables us to investigate further treatment heterogeneities related to user-generated content (Athey and Wager 2019, 2021; Cui and Davis 2022).
In the absence of random treatment assignment, the identification of the average treatment effect hinges on satisfying the unconfoundedness assumption through selection on observables. This necessitates not only collecting a comprehensive set of covariates (Xi,t) but also modeling the confounders, Xi,t, in a way such that conditional random assignment of treatment is attained. Traditionally, researchers have relied on the assumption that linearly controlling for a set of relatively small ex ante chosen covariates (Xi,t) can adequately control for the confounding effects. This decision is partly driven by the complexity in modeling confounders flexibly and nonparametrically. The use of linear models also restricts the ability to include high-dimensional covariates. Critics are often concerned that the linearity of the confounders is a strong/invalid assumption, and the infeasibility of controlling for many additional available observables weakens the ability to satisfy the selection on observables assumption.
Fortunately, the recent advances in causal inference with doubly robust machine learning pave the way for flexible and nonparametric modeling of the confounders (Chernozhukov et al. 2018). In many contexts, especially in digital markets, it is possible to observe an extensive set of covariates and derive controls from unstructured data. DML allows for high-dimensional covariates, and researchers are not required to choose a small number of variables ex ante. In particular, in our setting, we not only observe the key factors confounding the treatment assignment (as controlled in the RD analysis) but also have access to a rich set of unstructured data (i.e., texts and images). These texts and images may have redundant information, but, still, they can be featurized to further account for potential confounders.18
We next provide a brief outline of DML and Causal Forests in our context (refer to Chernozhukov et al. (2017, 2018) and Wager and Athey (2018) for a more detailed and general exposition). First, we define e(x) and m(x) as the conditional expectation of Superhost assignment and outcome variable, respectively: and . Following Chernozhukov et al. (2018), we employ machine learning methods to predict and and the subsequent residuals for each observation: and . Importantly, the machine learning method can satisfy the two conditions required for robust estimation of treatment. First, e(x) and m(x) must be estimated at a reasonable rate, with formal guarantees depending on minimizing mean-squared error, making machine learning methods ideal. Second, regularity concerns can be addressed by cross-fitting. Specifically, the same observation is not used to both predict and residualize e(x) or m(x) ( and are obtained from predictions of e(x) and m(x) that did not use observation i). In Section 4.3.1, we outline the additional features this approach enables us to include, and Section 4.3.2 describes the process of predicting e(x) or m(x).
Our objective is to examine the potential for Superhost assignment to promote equitable outcomes, meaning that we need to recover heterogeneous treatment effects for Black Airbnb hosts. Recently, nonparametric methods for identifying heterogeneous treatment effects have been shown to overcome some of the common impediments of such efforts. Specifically, researchers may ex ante select subgroups with high treatment levels, leading to purely spurious heterogeneity (Assmann et al. 2000, Cook et al. 2004). Therefore, we employ the Causal Forests algorithm (Wager and Athey 2018) to estimate ITEs and ATEs. Specifically, CF, using the orthogonalized residual predictions from the DML framework, can recover robust, consistent, and asymptotically normal heterogeneous treatment effects. We outline the CF procedure in more detail in Section 4.3. The Online Appendix examines the validity of the necessary assumptions.
4.3.1. Machine Learning Features.
As mentioned earlier, the benefit of the DML approach is that it enables us to leverage the richness of our data and incorporate features that we are unable to include while examining the marginal set of hosts. First, we construct n-grams, which are ordered sequences of n words based on the text in each listing’s description, which is available to view by any potential guests. We set n using a sliding window of one to three words over all the words in each listing description. As such, for each listing’s description, we obtain all ordered combinations of one, two, and three words. Because including all such combinations is computationally intensive, we use feature importance to identify the 100 most important n-grams for predicting each outcome variable as well as the treatment variable (Superhost). Specifically, for each variable, we estimate a Regression Forest with the feature set including all possible n-gram combinations. For each estimated model (two models predicting the outcome variables and one predicting the treatment variable), we identify the 100 most important n-grams based upon the mean decrease in impurity. We identify the unique n-grams from all the models (135 n-grams) and use the frequency of the unique n-grams as features in all subsequent machine learning models. This provides an important measure of listing-specific characteristics that can impact the appeal of the listing.
Second, we obtain the text for the previous five reviews written for each listing as of the start of each observation period and utilize Latent Dirichlet Allocation (LDA) topic modeling to obtain a measure of the topics recently discussed by reviewers about each listing.19 We include the topic distributions as an additional feature. This accounts for certain topics that may attract visitors to certain listings. We use the most recent five reviews as these are the reviews that potential guests likely took into consideration. Third, we include information about an extensive list of amenities that could potentially be offered by listing hosts. These include over 300 items, including a pool, iron, and balcony, among many others. For each potential amenity, we include a binary variable as a feature in the machine learning model. Fourth, we include the image score of the first five listing images shown to platform guests. The machine learning approach enables us to include more images, potentially accounting for discrepancies in quality between the main image and other images shown to potential guests. Finally, to enable the inclusions of fixed effects to control for host-level unobservables in this framework, we follow Habel et al. (2022) and first train a LASSO model that includes all covariates as well as host-level fixed effects.20 From this specification, we obtain each host’s fixed effect coefficients. We include these coefficients as a new feature in our DML estimation.
4.3.2. Estimating (−i) and (−i).
To estimate and , we evaluated the performance of various ensemble machine learning methods and found that Random Forest performed optimally for both. The Random Forest algorithm is ideal because it is nonparametric, can include potentially relevant interactions and higher-dimension features, and handles overfitting concerns well. Importantly, to avoid biases attributed to regularization, we split the data in half and use the half without observation i to estimate the value for i. To predict , the propensity of observation i to attain Superhost status, we utilized the following features (in addition to the machine-learning-based features outlined in Section 4.3.1): Prev. Period Host Response Average, Prev. Period Instant Bookable (1/0), # of Host Reviews, # of Host Reservation Past Year, # of Host Booked Days Past Year, and Prev. Host Superhost (1/0). We included the host’s number of reviews, reservations, and booked days over the past year because the Superhost status is evaluated based on the host’s performance over the past year. Similarly, the host response average relates to how quickly a host responds to consumers’ requests on the platform. In the set of marginal hosts utilized in Section 4.1, this was not a concern as all hosts included had to meet the Superhost criteria, one of which was based on the host response rate. We also included city and period fixed effects, as well as binary variables for whether the host is Black or White. Importantly, the variables used to predict do not include variables that might be changed by the host after they obtain Superhost status. For example, we used Prev. Period Instant Bookable (1/0) status because this might have impacted whether a host receives Superhost status, but we could not use the current period Instant Bookable (1/0) value because the host may have changed this as a result of obtaining Superhost status. Moreover, we made sure to not suffer from the curse of high-dimensional covariates, that is, loss of positivity because of being able to perfectly predict the treatment assignment. The post diagnosis of our estimates confirms that all units have a nonzero probability of assignment to each treatment condition. Still, to err on the side of caution, we only kept observations whose propensity score was between 0.1 and 0.9 (this reduces our sample size from 154,391 to 105,495). This is critical as DML relies on the positivity assumption in addition to unconfoundedness for identification.
To predict , we used all the variables used to predict as well as additional current period variables that may impact a listing’s performance. Specifically, we added the following variables: Price ($), Available Days, Price Tract Quartile, Tract Revenue Share, Tract Price Var., Tract Superhost Ratio, Number of Reviews, Average Rating, Host Average Rating Past Year, and Instant Bookable (1/0).
4.3.3. Causal Forests.
After obtaining predictions of m(x) and e(x) using machine learning methods (refer to the Online Appendix for a more thorough exposition of this procedure), we turned our attention to identifying individual-level heterogeneous treatment effects of Superhost assignment using CF. Causal Forests are adaptations of the Random Forest algorithm (Breiman 2001), which make predictions using a weighted average of similar observations. The approach is similar to matching methods, such as propensity matching or k nearest neighbor matching, but differs in that the determination of weights of observations is data-driven. This is especially useful in a setting such as ours, with many covariates and complex interactions among the covariates (Athey and Imbens 2019). Notable for our purposes, CF recovers consistent and asymptotically normal estimates of the heterogeneous individual treatment effects. Unlike other matching methods, this makes it ideal for heterogeneity analysis. Specifically, the nonparametric nature of CF reduces the potential of recovering spurious heterogeneity (Assmann et al. 2000, Cook et al. 2004). We next outline the Causal Forests method for our context in detail.
The CF method estimates a generalized Random Forest that partitions the data by decision trees, clustering Airbnb listings that have a similar propensity to attain Superhost status in a specific period into the same terminal node.21 The process is repeated 10,000 times to grow 10,000 causal trees. To reduce bias in tree predictions, we use “honest” forests. This requires that different subsamples be used to construct the tree and make treatment predictions. For each observation, a weighted average of treatment impact is obtained from the trees that the observation was randomly selected into (refer to Athey and Imbens (2019) for details). Because the same host may have multiple listings as well as the same listing over different evaluation periods, we follow Athey and Imbens (2019) and cluster at the host level.
4.4. Doubly Robust Machine Learning Results
As outlined in Section 4.3, the doubly robust machine learning approach enables us to exploit the richness of our data and generalize our analysis to the full set of Airbnb hosts in our sample. The CF estimation recovers individual treatment effects for each listing/period combination. Using these treatment effects, Table 8 reports the ATE, utilizing augmented inverse-propensity weighting (Athey and Imbens 2019) of Superhost assignment. The rows report the estimates for the ATE calculated for all listings in the sample. The recovered estimates for both reservations and booked days indicate a positive and statistically significant impact of Superhost assignment. The coefficient magnitude for both dependent variables is similar to the RDD-based coefficients recovered in Section 4.2 and reported in Table 7. Specifically, the results indicate that, using the Causal Forests estimates, attaining Superhost status causes an 8.0% (10.19%) increase in listing reservations (bookings). The analogous result using the RDD method was 7.68% (11.85%). Table 8 also reports the percentiles of the ITEs, clearly indicating the existence of heterogeneity in the treatment effects.
|
Table 8. Causal Forests Estimates of Superhost Impact
| ATE estimate | Percentiles | |||||
|---|---|---|---|---|---|---|
| 10th | 25th | 50th | 75th | 90th | ||
| log(# of Reservations) | 0.077*** (0.006) | 0.017 | 0.041 | 0.071 | 0.115 | 0.162 |
| log(# of Booked Days) | 0.098*** (0.008) | 0.027 | 0.054 | 0.092 | 0.149 | 0.203 |
Notes. This table reports the average treatment effect of attaining Superhost status. Standard errors are reported in parentheses. It also reports the distribution of the individual treatment effects for all observations.
*p < 0.10; **p < 0.05; ***p < 0.01.
As our objective is to examine the potential for Superhost assignment to promote equitable outcomes, we next turn to utilizing Causal Forests to estimate the heterogeneity of the treatment effect as it relates to a host’s race. The distribution of ITEs reported in Table 8, as well as additional tests for heterogeneity provided in the Online Appendix, indicates that the treatment effects estimated are not homogeneous for all hosts. To assess this heterogeneity, we utilize the ITEs obtained from the CF and estimate the following equation using a doubly robust estimator based on inverse-propensity weighting (Semenova and Chernozhukov 2021):
|
Table 9. Doubly Robust Heterogeneous Treatment Effects: Black Hosts
| log(# of Reservations) | log(# of Booked Days) | |||
|---|---|---|---|---|
| (1) | (2) | (3) | (4) | |
| Black Host (1/0) | 0.043** | 0.047** | 0.068** | 0.073** |
| (0.021) | (0.021) | (0.030) | (0.030) | |
| (Intercept) | 0.073*** | 0.091*** | ||
| (0.006) | (0.009) | |||
| Control variables | No | Yes | No | Yes |
Note. Robust standard errors are reported in parentheses.
*p < 0.10; **p < 0.05; ***p < 0.01.
4.5. Superhost Impact Heterogeneity Based on Reviews
Our results thus far provide evidence of statistical discrimination facing Black hosts on the home-sharing platform Airbnb. More notably, we find that platform certification can be utilized as a tool to promote more equitable outcomes on platforms. By reducing the information uncertainty, platform certification enables visitors to select hosts based on quality factors beyond the group-level assumptions they may initially hold. However, there are other sources of quality information on platforms that can also assist guests in making their decisions. Specifically, user-generated content, such as reviews, can play an important role in a consumer’s decision process. Thus, it is critical to analyze whether user-generated quality signal renders certification inconsequential or mitigates its role.
Because CF recovers Superhost treatment effects for each listing/period combination, we can examine the heterogeneity of the Superhost impact as it relates to reviews. If guests trust the review process, as a host’s listing accrues more reviews, the guests are arguably able to more clearly differentiate the host’s offering from group-level characteristics. Therefore, we investigate whether the heterogeneity in Superhost effect between Black hosts and other hosts is moderated by the number of reviews a listing has accrued. Although reviews provide additional information to guests that may reduce the potential for statistical discrimination, our analysis addresses a concern that reviews may be less effective in assuaging group-level assumptions for Black hosts.
To examine the review heterogeneity, we reestimate Equation (3), with the following modifications:
We include the interaction between # of Reviews and Black Host (1/0) to determine whether the additional information provided by reviews has a similar impact on Black hosts and other hosts. Tables 10 and 11 provide the results of this specification. Columns 1, 2, and 3 show that, not surprisingly, the # of Reviews a listing has plays a role in determining the benefit from platform certification. Most importantly for our purposes, the coefficient associated with Black Host (1/0) is consistently positive and statistically significant, indicating that, even in the presence of reviews, platform certification disproportionately benefits Black hosts. Moreover, the interaction term (log(# of Reviews) × Black Host (1/0)) is statistically insignificant, which indicates that the disproportionate benefit attained by Black hosts is consistent, even as the number of reviews increases. Even when considering the negative coefficient value associated with the interaction term, the conditional expectation of the treatment effect of quality certification for Black hosts will be higher than other hosts, as long as the considered host’s listing has accumulated fewer than 130 (146) reviews in the reservation (booked days) model. Given the distribution of reviews accumulated by Black-owned listings, this means that approximately 94% of Black hosts in our sample would benefit. Moreover, the positive and significant impact for Black hosts, as well as the lack of significance associated with the interaction term, is consistent when other controls (Xi,t) are included (column 4).
|
Table 10. Reservations—Doubly Robust Heterogeneous Treatment Effects: Black Hosts and Reviews
| (1) | (2) | (3) | (4) | (5) | (6) | |
|---|---|---|---|---|---|---|
| Black Host (1/0) | 0.043** | 0.141* | 0.138* | 0.040* | 0.043* | |
| (0.021) | (0.079) | (0.079) | (0.024) | (0.024) | ||
| log(# of Reviews) | −0.015*** | −0.015*** | −0.013** | −0.008 | ||
| (0.005) | (0.005) | (0.006) | (0.006) | |||
| log(# of Reviews) × Black Host (1/0) | −0.029 | −0.027 | ||||
| (0.021) | (0.021) | |||||
| Reviews ≥ 72 (1/0) | −0.059*** | −0.051*** | ||||
| (0.012) | (0.013) | |||||
| Reviews ≥ 72 (1/0) × Black Host (1/0) | 0.011 | 0.014 | ||||
| (0.042) | (0.042) | |||||
| (Intercept) | 0.129*** | 0.125*** | 0.117*** | 0.085*** | ||
| (0.020) | (0.020) | (0.021) | (0.007) | |||
| Control variables | No | No | No | Yes | No | Yes |
Note. Robust standard errors are reported in parentheses.
*p < 0.10; **p < 0.05; ***p < 0.01.
|
Table 11. Booked Days—Doubly Robust Heterogeneous Treatment Effects: Black Hosts and Reviews
| (1) | (2) | (3) | (4) | (5) | (6) | |
|---|---|---|---|---|---|---|
| Black Host (1/0) | 0.069** | 0.217* | 0.211* | 0.068* | 0.072** | |
| (0.030) | (0.122) | (0.121) | (0.035) | (0.035) | ||
| log(# of Reviews) | −0.026*** | −0.026*** | −0.022*** | −0.018** | ||
| (0.008) | (0.008) | (0.008) | (0.008) | |||
| log(# of Reviews) × Black Host (1/0) | −0.044 | −0.041 | ||||
| (0.032) | (0.031) | |||||
| Reviews ≥ 72 (1/0) | −0.070*** | −0.063*** | ||||
| (0.016) | (0.016) | |||||
| Reviews ≥ 72 (1/0) × Black Host (1/0) | −0.002 | 0.001 | ||||
| (0.057) | (0.057) | |||||
| (Intercept) | 0.184*** | 0.178*** | 0.165*** | 0.105*** | ||
| (0.031) | (0.031) | (0.031) | (0.010) | |||
| Control variables | No | No | No | Yes | No | Yes |
Note. Robust standard errors are reported in parentheses.
*p < 0.10; **p < 0.05; ***p < 0.01.
To further investigate whether the greater benefit attained by Black hosts is consistent in the presence of higher numbers of reviews, we replicated our analysis but replaced # of Reviews with a binary variable indicating whether the listing has reviews more than the 80th percentile in our sample (72 reviews). We refer to this as Reviews . The results are reported in columns 5 and 6 of Tables 10 and 11. The results indicate that the treatment effect of attaining quality certification for listings with a number of reviews greater than the 80th percentile (72) is significantly smaller. This is expected given the additional information provided by this large number of reviews. However, the coefficient associated with Black Host (1/0) remains positive and statistically significant, suggesting that this additional information is not enough to remove the information value provided by quality certification. Moreover, the interaction term is statistically insignificant (and positive), indicating that there is not an additional adjustment for listings of Black hosts with more than the 80th percentile of the number of reviews (72).
5. Investigating the Underlying Mechanism: Redistribution or Market Expansion
In previous sections, we find robust evidence that quality certification by a platform disproportionately benefits minority supply-side participants. This is consistent with the predictions from the theoretical mechanism that quality certification reduces statistical discrimination against minority sellers. As one considers this tool to improve overall equity in digital markets, a concern is whether the demand lift for certified Black hosts occurs at the expense of noncertified Black hosts. This is because the demand boost for certified Black hosts could come from three potential sources: (i) redistribution from noncertified Black hosts, (ii) a shift from hosts of other ethnicities, and (iii) market expansion resulting from decreased informational uncertainty among consumers.22 Obviously, overall equity improvement would be questionable if the demand lift from certification comes primarily from (i). The following sections analyze whether quality certification fosters equity in the competitive market without hurting noncertified minority suppliers. The empirical evidence also serves the dual purpose of supporting the underlying mechanism behind our key results—reduction in statistical discrimination as a result of the treatment.
5.1. Investigating Homophily as a Potential Underlying Mechanism
Our study posits that the primary mechanism driving our results is the mitigation of statistical discrimination through quality certification by a platform. Under this hypothesis, we would anticipate not only an uptick in demand for Black hosts who have secured certification but also an increased utilization of their properties by guests of diverse racial backgrounds.
However, an alternative explanation could be homophily—the innate human tendency to associate with those of similar racial or ethnic backgrounds. If the observed increase in reservations for certified Black hosts is primarily attributable to homophily, this could inadvertently favor certified Black hosts at the expense of their noncertified counterparts. Such a scenario would contradict the predicted increase in demand resulting from a decrease in statistical discrimination.
The crux of the issue lies in disentangling the influence of homophily. This necessitates access to granular, transaction-level data, encompassing detailed information about both the hosts and visitors, specifically their racial identities. In our study, we are fortunate to have access to such data. Although we cannot directly observe the perceived race of the visitor associated with each stay, we employ reviews as a proxy for transactions. Airbnb visitors are encouraged to write reviews postvisit, with over 67% of stays being reviewed (Fradkin et al. 2021). These reviews are contingent upon the completion of a transaction. Furthermore, reviewers’ profile pages often include their images, which allows us to infer the visitor’s race. To investigate the potential influence of homophily on our findings, we collected all reviews received by hosts in our main sample (used in Section 4.2). For each reviewer, we obtained their profile image and determined the race of the reviewer using the same machine learning algorithm as detailed in Section 3.3.
Leveraging the review data and associated reviewer images, we conducted a comparative analysis of the pre and post certification periods for hosts. This comparison was made between hosts who achieved certification and those who did not, bearing in mind that these certifications are pseudo-random based on the number of five-star reviews. Our focus was on this sample as it presents a more comparable set of Superhosts and non-Superhosts. Specifically, we scrutinized the racial distribution of reviewers before and after the Superhost evaluation period. These statistics are outlined in Tables 12 and 13.
|
Table 12. Proportion of Visitor Race for Black Hosts Before and After Superhost Evaluation (Marginal Sample)
| Pre-Superhost Black visitors | Post-Superhost Black visitors | Pre-Superhost White visitors | Post-Superhost White visitors | |
|---|---|---|---|---|
| Superhost in post period | 14.38% | 13.19% | 54.17% | 58% |
| N = 4,061 | N = 4,778 | N = 4,061 | N = 4,778 | |
| Not Superhost in post period | 11.73% | 11.43% | 51.07% | 52.18% |
| N = 5,303 | N = 5,493 | N = 5,303 | N = 5,493 |
Notes. This table shows the proportion of visitor reviews written for Black hosts before and after Superhost evaluation periods. N corresponds to the total number of reviews received for the specific set of hosts, and the percentage represents the proportion of those reviews that were written by Black or White visitors.
|
Table 13. Proportion of Visitor Race for White Hosts Before and After Superhost Evaluation (Marginal Sample)
| Pre-Superhost Black visitors | Post-Superhost Black visitors | Pre-Superhost White visitors | Post-Superhost White visitors | |
|---|---|---|---|---|
| Superhost in post period | 6.72% | 6.48% | 69.25% | 69.54% |
| N = 27,109 | N = 31,102 | N = 27,109 | N = 31,102 | |
| Not Superhost in post period | 6.48% | 6.72% | 7.86% | 8.2% |
| N = 32,543 | N = 35,849 | N = 32,543 | N = 35,849 |
Notes. This table shows the proportion of visitor reviews written for White hosts before and after Superhost evaluation periods. N corresponds to the total number of reviews received for the specific set of hosts, and the percentage represents the proportion of those reviews that were written by Black or White visitors.
Our data provide compelling evidence that homophily is not the driving force behind our results. Our analysis reveals that guests of diverse ethnic backgrounds are more inclined to book properties managed by certified Black hosts postcertification. Most notably, there is a significant shift in the proportion of White guests opting to stay with Black hosts following their attainment of certification. Specifically, for Black hosts who become certified, the percentage of White reviewers increases from 54% prior to certification to 58% postcertification. In contrast, similar statistics for Black hosts who do not achieve certification and for White hosts remain relatively stable.
Employing a Z-test to compare these proportions, the increase observed for certified Black hosts (as shown in Table 12) is the only statistically significant change among all the pre and post certification comparisons in both Tables 12 and 13. This pattern suggests that the increase in reservations observed for certified Black hosts cannot be solely attributed to homophily. It further bolsters the hypothesis that quality certification plays a pivotal role in mitigating statistical discrimination and fostering more equitable outcomes on digital platforms.
5.2. Investigating the Impact of Certification on Noncertified Minority Hosts
Building upon the descriptive evidence provided in Section 5.1, which suggests that the benefits accrued by certified Black hosts are not solely due to homophily, we extend our analysis to investigate the impact of certification on noncertified Black hosts. In particular, we econometrically examine the effect of an increase in the proportion of certified competitors within a noncertified Black host’s census tract on the host’s demand.
To conduct this analysis, we employ the same sample of hosts on the margin of certification as analyzed in Section 4.1. We augment Equation (2) with an interaction term between Black Host (1/0) and Tract Superhost Ratio, as shown in Equation (5). This allows us to assess the marginal impact on a host’s demand from an increase in the proportion of certified hosts in the host’s census tract. β3 measures the baseline marginal impact of a higher ratio of certified competitors in a host’s census tract, whereas the interaction term (β4) evaluates whether this marginal effect differs significantly for Black hosts. A negative value for β4 would suggest that Black hosts are more adversely affected by an increase in certified competitors, casting doubt on the effectiveness of certification as a tool for promoting equitable outcomes for Black hosts on the platform.
Our findings are summarized in Table 14. Columns 1 and 4 reveal that the interaction term (β4) is positive and significant, suggesting that Black hosts, relative to other hosts, benefit from an increase in the ratio of certified competitors in their census tract. We, however, must be cautious as this benefit may simply reflect the additional advantage Black hosts gain from becoming certified. To isolate the impact on noncertified hosts, we focus on columns 2 and 5, which include only noncertified hosts. These columns reveal that even among noncertified hosts, an increase in the proportion of certified hosts in a census tract is associated with increased demand. More importantly, the interaction term (β4) is not statistically different from zero, suggesting that the impact on Black noncertified hosts is similar to that on noncertified hosts of other ethnicities. Columns 3 and 6, which include only noncertified Black hosts, confirm that an increase in the proportion of certified hosts in a census tract does not negatively impact these hosts.
|
Table 14. Impact of Local Certification on Noncertified Minority Hosts
| log(# of Reservations) | log(# of Booked Days) | |||||
|---|---|---|---|---|---|---|
| (1) | (2) | (3) | (4) | (5) | (6) | |
| Superhost | 0.075*** | 0.112*** | ||||
| (0.011) | (0.017) | |||||
| Black Host (1/0) | −0.147*** | −0.128*** | −0.195*** | −0.224*** | ||
| (0.027) | (0.041) | (0.042) | (0.064) | |||
| Tract Superhost Ratio | −0.152*** | 0.164* | 0.262 | −0.260*** | 0.123 | 0.668 |
| (0.050) | (0.096) | (0.301) | (0.075) | (0.142) | (0.467) | |
| Tract Superhost Ratio × Black Host (1/0) | 0.237** | −0.099 | 0.343** | 0.254 | ||
| (0.096) | (0.214) | (0.143) | (0.333) | |||
| Listing- and Tract-Level Controls | Yes | Yes | Yes | Yes | Yes | Yes |
| Period fixed effects | Yes | Yes | Yes | Yes | Yes | Yes |
| City fixed effects | Yes | Yes | Yes | Yes | Yes | Yes |
| Constant | −1.904*** | −1.725*** | −1.948*** | −1.911*** | −1.685*** | −1.664 |
| (0.173) | (0.231) | (0.641) | (0.270) | (0.368) | (1.097) | |
| Observations | 22,248 | 11,065 | 1,141 | 22,248 | 11,065 | 1,141 |
| R2 | 0.361 | 0.356 | 0.380 | 0.315 | 0.309 | 0.332 |
Notes. Robust standard errors are reported in parentheses. Columns 1 and 4 show the results for the same sample of hosts on the margin of certification as analyzed in Section 4.2. Columns 2 and 5 include only noncertified hosts. Columns 3 and 6 include only noncertified Black hosts.
*p < 0.10; **p < 0.05; ***p < 0.01.
5.3. Investigating the Impact of Certification on Overall Demand for Noncertified Minority Hosts at the Tract Level
Whereas the preceding sections have focused on listing-level analysis, concerns may arise about the collective welfare of noncertified Black hosts, despite the individual average noncertified Black host’s interest not being harmed. This section extends the analysis to a broader scope, examining the effects of certified hosts on the aggregate demand received by noncertified Black hosts within a census tract. We aim to discern whether an increase in certified competitors negatively impacts the collective demand for noncertified hosts, addressing the pivotal question of whether the demand surge for certified hosts, particularly among Black certified hosts, detracts from the overall demand for noncertified Black hosts.
To conduct this analysis, we aggregate the data from the individual listing level to the census tract level and estimate a panel model at the census tract level, incorporating both period and census tract fixed effects. Our primary dependent variable is the total demand within a specific census tract, measured as either Reservations or Booked Days. The key independent variable is the count of certified hosts within the census tract. Our model captures the within-census-tract variation in demand attributable to changes in the number of certified hosts in a listing’s census tract, with the inclusion of the number of noncertified hosts (# of Non-Superhosts) to control for the demand increase associated with an increase in the number of noncertified hosts. We estimate the following equation to analyze this relationship:
Our findings are detailed in Table 15. Columns 1 and 4 reveal that adding a certified host to a census tract positively and significantly affects collective demand, aligning with expectations as the sample encompasses both certified and noncertified hosts. Columns 2 and 5 present similar analyses but focus solely on noncertified hosts. For noncertified hosts, an increase in the number of certified hosts does not significantly affect their demand, suggesting that the addition of certified hosts does not negatively influence the demand for noncertified hosts within the same tract. This finding supports the notion that demand growth linked to certification primarily reflects demand expansion rather than redistribution.
|
Table 15. Census Tract-Level Analysis of Impact of Number of Local Superhosts on Demand for Non-Superhosts
| log(# of Reservations) | log(# of Booked Days) | |||||
|---|---|---|---|---|---|---|
| (1) | (2) | (3) | (4) | (5) | (6) | |
| # of Superhosts | 0.028*** | 0.001 | 0.007* | 0.015*** | 0.000 | 0.002 |
| (0.002) | (0.002) | (0.004) | (0.002) | (0.002) | (0.005) | |
| # of non-Superhosts | 0.023*** | 0.061*** | 0.173*** | 0.011*** | 0.045*** | 0.143*** |
| (0.002) | (0.002) | (0.006) | (0.003) | (0.003) | (0.009) | |
| Listing- and tract-level controls | Yes | Yes | Yes | Yes | Yes | Yes |
| Period fixed effects | Yes | Yes | Yes | Yes | Yes | Yes |
| City fixed effects | Yes | Yes | Yes | Yes | Yes | Yes |
| Observations | 4,218 | 4,218 | 4,218 | 4,218 | 4,218 | 4,218 |
| R2 | 0.474 | 0.754 | 0.792 | 0.3961 | 0.772 | 0.816 |
Notes. Robust standard errors are reported in parentheses. Columns 1 and 4 show the results for the same sample of hosts on the margin of certification as analyzed in Section 4.2. Columns 2 and 5 include only noncertified hosts. Columns 3 and 6 include only noncertified Black hosts.
*p < 0.10; **p < 0.05; ***p < 0.01.
Columns 3 and 6 examine the effects specifically among Black hosts, that is, the sample is restricted to Blacks only. The results show a positive and significant impact on Reservations, albeit with a relatively small coefficient, and no significant effect on Booked Days. This suggests that increasing the number of certified Black hosts in a census tract does not diminish demand for noncertified Black hosts, underscoring the potential of certification to promote equitable outcomes on the platform by benefiting certified Black hosts without adversely affecting the demand for noncertified Black hosts.
6. Conclusion
Digital marketplaces have emerged as powerful catalysts for economic activity, facilitating transactions between businesses; microentrepreneurs, such as home-sharing hosts; and consumers with unprecedented efficiency. This efficiency has the potential to dismantle traditional barriers to entry, thereby enabling minority participants to circumvent longstanding obstacles and achieve more equitable market outcomes. However, the full potential of these platforms remains untapped, as they continue to grapple with the challenge of fostering an equitable market environment for all participants, irrespective of their race or ethnicity.
Our study contributes to this discourse by providing empirical evidence that, even in the information-rich home-sharing environment, supply-side participants (hosts) face statistical discrimination. Perhaps more importantly, our results underscore the efficacy of quality certification as a platform design tool to mitigate the statistical discrimination. Leveraging granular performance data from Airbnb, the world’s largest home-sharing platform, we demonstrate that Black hosts who attain certification reap significantly greater benefits than their non-Black certified counterparts. Our primary identification strategy hinges on a unique quasi-random design that capitalizes on the discontinuity in the criteria for achieving Airbnb Superhost status. Our findings reveal that an average Superhost experiences a surge in reservations by approximately 7.68% following quality certification. In line with the tenets of statistical discrimination theories, which posit that discrimination stems from group-level statistical beliefs that can be mitigated with additional information, we observe that borderline Black Superhosts benefit disproportionately from the information shock, experiencing a 17.23% increase in reservations. These findings are robust to expanding the analyses to the broader sample using DML combined with Causal Forests as a second identification strategy.
Although the increased demand for certified Black hosts is a promising development, a comprehensive evaluation of quality certification as a tool for promoting equitable outcomes necessitates an examination of its impact on noncertified Black hosts. The increased demand for certified Black hosts could potentially be at the expense of noncertified Black hosts. Alternatively, quality certification, by reducing uncertainty, could attract new customers to the platform. These could be consumers who previously preferred hotels or were not even considering travel. If this market expansion, triggered by the reduction in uncertainty, disproportionately benefits certified Black hosts, then quality certification emerges as a tool that not only promotes more equitable outcomes but also aligns with the platform owners’ objectives of overall market growth. Our analysis provides compelling evidence that the surge in demand for certified Black hosts does not come at the expense of noncertified Black hosts. We do not observe a negative impact on noncertified Black hosts due to an increase in the number of competing certified hosts, whether at the individual or area level. Furthermore, postcertification, we observe a significant shift in the proportion of White guests choosing certified Black hosts, suggesting an expansion of demand beyond homophily.
Moreover, our study highlights the enduring relevance of quality certification in the era of user-generated content. Despite the wealth of information available through online reviews, our findings suggest that platform owners cannot solely rely on these reviews to mitigate statistical discrimination. Instead, they must take proactive measures to ensure that Black hosts can fully leverage the benefits of quality certification. Interestingly, our analysis reveals that Black-owned listings derive substantial benefits from quality certification, even when there exist numerous reviews for the listing. This indicates that although user-generated content is undoubtedly valuable to consumers, the clear and unambiguous signals provided by platform certification remain crucial. Furthermore, platforms have limited control over the volume and quality of reviews across different host categories, reinforcing the importance of judiciously designing their own quality signals.
Building on these insights, our study highlights the need for adjustments to the prevailing approach to mitigating discrimination on sharing economy platforms, which primarily focuses on increasing minority participation on the supply side. Although enhancing minority participation is undoubtedly important, it does not directly address the discrimination that occurs within the platform. Nor does it offer any market design choices that could mitigate this issue. Our research demonstrates that quality certification is a tool that platforms can leverage to reduce discrimination, even in environments rich with crowd-generated information. Platforms must recognize the importance of their quality signals, such as certification, in reducing statistical discrimination. This is particularly crucial given their control over certification thresholds and criteria, which are often influenced by review ratings that can be subject to bias. With such a focus, quality certification could become a viable platform-level solution in marketplaces where regulation is challenging to enforce.
In our specific context, we note that although Black hosts benefit significantly from certification, they are less likely to achieve it. This observation emphasizes the need for platform owners to initiate targeted business development efforts within minority communities. These efforts should aim to educate hosts about the benefits of obtaining quality certification and the processes involved. Furthermore, platform owners should ensure that the criteria and thresholds for certification are designed equitably, without disproportionately benefiting any one group. By focusing on equitable access and fairness in certification, platforms can make significant strides in addressing systemic disparities within the digital economy.
Our study also opens up new avenues for future research. Although our analysis provides robust evidence of the benefits of quality certification for Black hosts, it does not explore the potential impact of certification on pricing dynamics. Future studies could investigate how certification or other platform features might causally influence pricing, which would shed further light on the potential of quality certification to promote more equitable outcomes and grow the platform. However, such efforts are challenging because of the endogenous nature of pricing decisions, which are often influenced by a host’s own perceptions of the market or usage of algorithmic tools. Nonetheless, given the results of our study, examining the potential of quality certification to influence pricing dynamics is a promising direction for future research.
As previously highlighted, we also leverage recent advancements in machine-learning-based causal inference. Although these novel methods hold the potential to explore new questions and provide in-depth insights, there is some skepticism regarding their efficacy, particularly in complex applications, because of challenges in fulfilling the necessary assumptions. We employed the well-established RDD strategy, which effectively creates local random assignment for generating causal estimates, as a baseline for evaluating the performance of DML in a real-world context. Encouragingly, our findings show that the estimates from both methodologies are congruent.
1 See https://www.aboutamazon.com/news/small-business/amazon-commits-150-million-to-empower-black-entrepreneurs. Additional examples include eBay initiating efforts to harness the potential of Global Marketplace for minority owners in 2018 (https://static.ebayinc.com/assets/Uploads/Documents/eBay2018-DI-Full-Report.pdf) and Lyft launching the Black Driver Community Circle in 2021 with the aim of providing Black Lyft drivers a forum to “share their experiences related to racial discrimination.”
2 This inability to police prejudices or regulate consumer choices is similar to the broader regulatory challenges in implementing antidiscrimination policies and laws. For instance, under the Civil Rights Act of 1964, the U.S. federal government can sanction sellers for discriminating against buyers, but it cannot similarly penalize buyers who avoid purchasing from sellers because of discriminatory reasons, such as race.
3 Historically, researchers used audit studies, where they sent similar individuals, differing only by race, to participate in economic transactions and observed the resulting disparities (Ayres and Siegelman 1995). Correspondence studies were developed to address some of the limitations inherent in audit studies.
4 The field of psychology similarly categorizes types of discrimination, examining discrimination based on beliefs (analogous to statistical discrimination) and preferences (comparable to taste-based discrimination) (Greenwald et al. 1998).
5 Starting in November 2018, criterion (iv) was modified such that the hosts must maintain a 4.8 overall rating. This change makes the observations in the post-November 2018 period incompatible with the RDD strategy outlined in Section 4.1.
6 We obtained these reviews from the publicly facing Airbnb website (www.airbnb.com) directly. The reviews also allowed us to identify host listing cancellations and their associated dates because Airbnb generates an automatic review regarding the cancellation.
7 During our observation period, the Airbnb Superhost criteria were consistent. Moreover, although average ratings and number of reviews (among other features) may impact Airbnb’s sorting algorithm, the actual Superhost endorsement does not impact the sorting algorithm during this period (https://www.forbes.com/sites/sethporges/2017/10/30/airbnb-finally-opens-up-on-how-to-rise-through-its-search-rankings/?sh=44c5048f1922; https://www.airbnb.com/resources/hosting-homes/a/how-airbnb-search-works-44).
8 April (2017, 2018), July (2016, 2017), October (2016, 2017), and January (2017, 2018).
9 We excluded the evaluation month because we cannot be certain of the exact date that the Superhost obtained status. AirDNA provides a periodic snapshot of the Superhost status for each listing (usually one snapshot every couple of days). Therefore, if we observe that the host has Superhost status in the subsequent month, this indicates that the host attained Superhost status sometime during the beginning of the evaluation month and, as such, will retain the status through the next two months.
10 The fact that hosts must continually meet the criteria every three months is useful to alleviate concerns that hosts may reduce their effort levels once they obtain the status.
11 The precision of this model in predicting Black hosts in the validation sample is 0.87. This means that 87% of the hosts who were identified as Black by the machine learning algorithm were also identified as Black by the Mechanical Turk workers.
12 Census tracts are small and homogeneous, alleviating concerns associated with larger geographic areas, such as zip codes, that our area-level variables may not adequately capture the dynamics surrounding a listing. The U.S. Census allocates census tracts to relatively small areas, with populations generally ranging from 1,800 to 8,000 and optimally close to 4,000. Boundaries are based on an area’s visible and identifiable features (https://www.census.gov/programs-surveys/geography/about/glossary.html).
13 A host’s overall average rating is not shown to the potential guests and, as such, is not included as an additional variable. It is used in determining a host’s Superhost status, which we discuss later.
14 To further illustrate, assume a host had eight total reviews in the previous year. The host would need seven five-star reviews to achieve Superhost status. If the host had four, five, six, seven, or eight five-star reviews in the previous year, 5-Star Review Deficit would be 3, 2, 1, 0, or −1 for each respective case.
15 Note that some variables record metrics corresponding to the time after certification. For this reason, the differences are persistent. For example, Tract Superhost Ratio corresponds to the ratio after certification. Therefore, because some tracts may not have a high number of hosts, the hosts in the set who became Superhosts will have a higher average than the others.
16 The balance in our sample is further highlighted by the balance between boundary hosts who attain Superhost status and those who do not. Specifically, 11,183 out of 22,248 observations in the boundary set (or 50.2%) are related to hosts who attain Superhost status. Moreover, this balance is retained across race as well: 966/1,902 (50.8%) for Black hosts and 6,011/11,640 (51.6%) for White hosts.
17 Standard errors are clustered by census tracts.
18 A key rationale for preferring high-dimensional covariates in observational settings is that unconfoundedness is more plausible when there are more adjustments for the confounders (Rosenbaum 2002, Rubin 2009). The risk, however, is the loss of positivity (D’Amour et al. 2021).
19 LDA necessitates the selection of the number of topics. We include the topic distributions with the number of topics set at 10, 15, and 20. Please refer to the Online Appendix for a full exposition of the process of creating the features described.
20 Including host-level fixed effects directly is not feasible because of the exploding complexity.
21 Following Athey and Imbens (2019), we set each terminal node as having at least 10 observations to encourage recovery of heterogeneity. Moreover, to avoid overfitting, for each tree we randomly select a subset of observations and base partitions on a random set of one-third of the covariates.
22 For instance, introducing a feature that reduces informational uncertainty on the platform may encourage consumers to prefer the home-sharing platform over more traditional options, such as hotels. This aligns with previous research indicating competition between home-sharing services and hotels (Zervas et al. 2017).
References
- (2010) Can discrimination in the housing market be reduced by increasing the information about the applicants? Land Econom. 86(1):79–90.Crossref, Google Scholar
Airbnb, Inc . (2023) Airbnb, Inc. 2023 annual report (form 10-k). https://www.sec.gov/ix?doc=/Archives/edgar/data/0001559720/000155972024000006/abnb-20231231.htm.Google Scholar- (1973)
The theory of discrimination . Ashenfelter OA, Rees A, eds. Discrimination in Labor Markets (Princeton University Press, Princeton, NJ), 3–33.Google Scholar - (1998) What has economics to say about racial discrimination? J. Econom. Perspect. 12(2):91–100.Crossref, Google Scholar
- (2000) Subgroup analysis and other (mis)uses of baseline data in clinical trials. Lancet 355(9209):1064–1069.Crossref, Google Scholar
- (2019) Machine learning methods economists should know about. Preprint, submitted March 24, https://arxiv.org/abs/1903.10075.Google Scholar
- (2019) Estimating treatment effects with causal forests: An application. Observational Stud. 5(2):37–51.Crossref, Google Scholar
- (2021) Policy learning with observational data. Econometrica 89(1):133–161.Crossref, Google Scholar
- (1995) Race and gender discrimination in bargaining for a new car. Amer. Econom. Rev. 85(3):304–321.Google Scholar
- (2015) Race effects on eBay. RAND J. Econom. 46(4):891–917.Crossref, Google Scholar
- (2020) Steering in online markets: The role of platform incentives and credibility. Management Sci. 66(9):4047–4070.Link, Google Scholar
- (2017)
Field experiments on discrimination . Banerjee AV, Duflo E, eds. Handbook of Economic Field Experiments, vol. 1 (Elsevier, Amsterdam), 309–393.Crossref, Google Scholar - (2004) Are Emily and Greg more employable than Lakisha and Jamal? A field experiment on labor market discrimination. Amer. Econom. Rev. 94(4):991–1013.Crossref, Google Scholar
- (2005) Implicit discrimination. Amer. Econom. Rev. 95(2):94–98.Crossref, Google Scholar
- (2003) Discrimination in the small-business credit market. Rev. Econom. Statist. 85(4):930–943.Crossref, Google Scholar
- (2019) The dynamics of discrimination: Theory and evidence. Amer. Econom. Rev. 109(10):3395–3436.Crossref, Google Scholar
- (2013) Engineering trust: Reciprocity in the production of reputation information. Management Sci. 59(2):265–285.Link, Google Scholar
- (2001) Random forests. Machine Learn. 45(1):5–32.Crossref, Google Scholar
- (2010) Discrimination in the lab: Does information trump appearance? Games Econom. Behav. 68(1):50–59.Crossref, Google Scholar
- (2017) Double/debiased/Neyman machine learning of treatment effects. Amer. Econom. Rev. 107(5):261–265.Crossref, Google Scholar
- (2018) Double/debiased machine learning for treatment and structural parameters. Econom. J. 21(1):C1–C68.Crossref, Google Scholar
- (2020) Race and economic opportunity in the United States: An intergenerational perspective. Quart. J. Econom. 135(2):711–783.Crossref, Google Scholar
- (2004) Subgroup analysis in clinical trials. Medical J. Australia 180(6):289–291.Crossref, Google Scholar
- (2022) Tax-induced inequalities in the sharing economy. Management Sci. 68(10):7202–7220.Link, Google Scholar
- (2020) Reducing discrimination with reviews in the sharing economy: Evidence from field experiments on Airbnb. Management Sci. 66(3):1071–1094.Link, Google Scholar
- (2021) Overlap in observational studies with high-dimensional covariates. J. Econometrics 221(2):644–654.Crossref, Google Scholar
- (2012) Complexity effects in choice experiment–based models. J. Marketing Res. 49(3):424–434.Crossref, Google Scholar
- (2008) The sound of silence in online feedback: Estimating trading risks in the presence of reporting bias. Management Sci. 54(3):460–476.Link, Google Scholar
- (2013) The visible hand: Race and online market outcomes. Econom. J. 123(572):469–492.Google Scholar
- (2017) Racial discrimination in the sharing economy: Evidence from a field experiment. Amer. Econom. J. Appl. Econom. 9(2):1–22.Crossref, Google Scholar
- (2014) Statistical discrimination or prejudice? A large sample field experiment. Rev. Econom. Statist. 96(1):119–134.Crossref, Google Scholar
- (2021) Reciprocity and unveiling in two-sided reputation systems: Evidence from an experiment on Airbnb. Marketing Sci. 40(6):1013–1029.Link, Google Scholar
- (2016) How does race and ethnicity affect persistence in immature ventures? J. Small Bus. Management 54(1):210–228.Crossref, Google Scholar
- (2020) Racial discrimination in transportation network companies. J. Public Econom. 190:104205.Crossref, Google Scholar
- (1998) Measuring individual differences in implicit cognition: The implicit association test. J. Personality Soc. Psych. 74(6):1464–1480.Crossref, Google Scholar
- (2022) EXPRESS: Effective implementation of predictive sales analytics. J. Marketing Res. 61(4):718–741.Crossref, Google Scholar
- (2001) Identification and estimation of treatment effects with a regression-discontinuity design. Econometrica 69(1):201–209.Crossref, Google Scholar
- (2015) Causal Inference in Statistics, Social, and Biomedical Sciences (Cambridge University Press, Cambridge, UK).Crossref, Google Scholar
- (2000) When choice is demotivating: Can one desire too much of a good thing? J. Personality Soc. Psych. 79(6):995.Crossref, Google Scholar
- (2012) Ethnic discrimination in Germany’s labour market: A field experiment. German Econom. Rev. 13(1):1–20.Crossref, Google Scholar
- (2021) FairFace: Face attribute dataset for balanced race, gender, and age for bias measurement and mitigation. Proc. IEEE/CVF Winter Conf. Appl. Comput. Vision (IEEE, New York), 1547–1557.Google Scholar
- (2011) Education and labor market discrimination. Amer. Econom. Rev. 101(4):1467–1496.Crossref, Google Scholar
- (2020) Race discrimination: An economic perspective. J. Econom. Perspect. 34(2):68–89.Crossref, Google Scholar
- (2022) Can information reduce ethnic discrimination? Evidence from Airbnb. Amer. Econom. J. Appl. Econom. 14(1):107–132.Crossref, Google Scholar
- (2010) Regression discontinuity designs in economics. J. Econom. Literature 48(2):281–355.Crossref, Google Scholar
- (2018) Image quality assessment. https://github.com/idealo/image-quality-assessment.Google Scholar
- (2007) What do laboratory experiments measuring social preferences reveal about the real world? J. Econom. Perspect. 21(2):153–174.Crossref, Google Scholar
- (2004) The nature and extent of discrimination in the marketplace: Evidence from the field. Quart. J. Econom. 119(1):49–89.Crossref, Google Scholar
- (2016) Fake it till you make it: Reputation, competition, and Yelp review fraud. Management Sci. 62(12):3412–3427.Link, Google Scholar
- (2014) Promotional reviews: An empirical investigation of online review manipulation. Amer. Econom. Rev. 104(8):2421–2455.Crossref, Google Scholar
- (2015) The limits of reputation in platform markets. NBER Working Paper No. 20830, National Bureau of Economic Research, Cambridge, MA.Google Scholar
- (1972) The statistical theory of racism and sexism. Amer. Econom. Rev. 62(4):659–661.Google Scholar
- (2011) What’s in a picture? Evidence of discrimination from Prosper.com. J. Human Resources 46(1):53–92.Crossref, Google Scholar
- Rosenbaum PR (2002) Observational Studies, 2nd ed. (Springer, New York).Google Scholar
- (1983) The central role of the propensity score in observational studies for causal effects. Biometrika 70(1):41–55.Crossref, Google Scholar
- Rubin DB (2009) Should observational studies be designed to allow lack of balance in covariate distributions across treatment groups? Statist. Medicine 28(9):1420–1423.Google Scholar
- (2019) Reputation and adverse selection: Theory and evidence from eBay. RAND J. Econom. 50(4):822–853.Crossref, Google Scholar
- (2021) Debiased machine learning of conditional average treatment effects and other causal functions. Econom. J. 24(2):264–289.Crossref, Google Scholar
- (1971)
Designing organizations for an information-rich world . Greenberger M, ed. Computers, Communications, and the Public Interest (Johns Hopkins Press, Baltimore), 37–72.Google Scholar - (1973) Job market signaling. Quart. J. Econom. 87(3):355–374.Crossref, Google Scholar
- (2016) Reputation and feedback systems in online platform markets. Annual Rev. Econom. 8(1):321–340.Crossref, Google Scholar
- (2018) Estimation and inference of heterogeneous treatment effects using random forests. J. Amer. Statist. Assoc. 113(523):1228–1242.Crossref, Google Scholar
- (2018) The colorblind crowd? Founder race and performance in crowdfunding. Management Sci. 64(7):3269–3287.Link, Google Scholar
- Zervas G, Proserpio D, Byers JW (2017) The rise of the sharing economy: Estimating the impact of airbnb on the hotel industry. J. Marketing Res. 54(5):687–705.Google Scholar
- (2021) A first look at online reputation on Airbnb, where every stay is above average. Marketing Lett. 32:1–16.Crossref, Google Scholar
- (2013) Ethnic discrimination: Lessons from the Israeli online market for used cars. Econom. J. 123(572):F433–F468.Google Scholar