Getting Down to Business: Chain Ownership and Fertility Clinic Performance
Abstract
Acquisitions by corporate entities have fueled the growth of chain organizations in healthcare. A chain is a multiunit firm under the same ownership and management providing similar services in different locations. Chain ownership has been credited with boosting firm performance in the retail and service sectors but has been criticized for prioritizing profits over the well-being of patients in the healthcare sector. This paper finds that chain ownership improves healthcare outcomes in the market for in vitro fertilization (IVF). Using novel data on U.S. fertility clinics and difference-in-differences methods, we find that IVF cycles increase by 27.2%, and IVF success rates increase by 13.6% after acquisition by a fertility chain. We provide evidence that fertility chains facilitate resource and knowledge transfers needed to enhance quality and expand the IVF market. For example, acquired clinics change IVF processes and procedures to achieve the IVF gold standard of simultaneously reducing higher-risk multiple births and increasing singleton births. We discuss how the fertility sector’s relatively minimal market frictions and information asymmetries may incentivize chain owners to invest in quality.
This paper was accepted by Stefan Scholtes, healthcare management.
Supplemental Material: The online appendix and data files are available at https://doi.org/10.1287/mnsc.2023.02793.
1. Introduction
Over the past several decades, chain organizations have reshaped industries and consumer experiences. For example, by standardizing operations and management and generating reputational incentives, chain ownership has been shown to increase firm productivity and product quality in the retail and service sectors (Jin and Leslie 2009, Bloom et al. 2012, Kosová and Lafontaine 2012). Acquisitions by retail companies and corporate investors have also contributed to the growth of chain organizations in the healthcare sector. This growth has raised concerns that chain operators will place shareholder financial interests over the health and well-being of patients, supported by recent studies documenting a decline in quality under chain ownership (Eliason et al. 2020, Andreyeva et al. 2024, Gupta et al. 2024).
In contrast, using novel data on U.S. fertility chains, this paper finds that chain ownership improves healthcare outcomes. Several features of the fertility industry make it an especially well-suited setting to study the chain business model in healthcare. First, fertility clinic outcomes are easily measurable and observable: the U.S. Congress passed a law in 1992 requiring clinics’ in vitro fertilization (IVF) outcomes to be made publicly available.1 Because the primary goal of IVF is to achieve a live birth, patients can also readily assess the effectiveness of their treatment. Second, fertility clinics operate more like retail settings than traditional healthcare settings. For example, patients typically pay upfront and out of pocket for IVF, placing a greater emphasis on consumer choice because of the minimal involvement of third-party payers. Third, corporate entities, attracted by the growing demand for fertility services, have increasingly acquired fertility clinics (Robbins 2017, The Economist 2023a). Last, despite the high demand and high costs of IVF, success rates are low and vary considerably across clinics, suggesting that clinics have room for improvement.
To study the impact of chain ownership, we combine hand-collected data on fertility clinic transactions from business intelligence databases with clinic-level data from the Centers for Disease Control and Prevention (CDC) Fertility Clinic Success Rates Reports. Between 2004 and 2018, the share of clinics in a fertility chain grew from 5% to 20%, with chain clinics now performing over 40% of IVF cycles in the United States. Critics caution that chains will treat “fertility medicine as a cash cow,” whereas chains argue they can help clinics “deliver high-quality, convenient care to patients while implementing cost savings, improving processes, and driving growth” (Robbins 2017, Krause 2019). We estimate changes in clinic growth and quality using difference-in-differences (DiD) methods, which compare clinics before and after chain ownership to a control group of nonchain clinics. We focus on two key outcomes: (1) clinic volume, measured as the number of IVF cycles, and (2) the success of IVF, measured as the live birth rate per transfer.
Our results show that after a fertility chain acquires a clinic, IVF cycles increase by 27.2% and live birth rate increases by 13.6%. Qualitative data obtained from press releases, marketing materials, and interviews suggest chains help clinics achieve growth by providing financial resources, such as capital, and managerial resources, such as revenue cycle management and marketing services. These materials also suggest that chains help improve quality by implementing best practices, protocols, and trainings, and facilitating knowledge sharing between clinics through research consortiums and complex case review meetings. We provide empirical evidence that these resource and knowledge transfers drive performance improvements rather than alternative mechanisms such as patient selection.
One way we test for the role of resource and knowledge transfer is by comparing outcomes of acquired clinics with those of affiliated clinics. In acquisitions, the fertility chain’s parent company owns the clinic’s assets, whereas in affiliations, a clinic contracts with a fertility chain for management services and access to capital. Because a chain has greater control and ability to direct how resources and knowledge are used in a clinic it owns, we might expect that quality improvements would manifest more strongly in acquired clinics (Grossman and Hart 1986, Bernstein and Sheen 2016). Consistent with this hypothesis, we find that the live birth rate only increases in acquired but not in affiliated clinics.
We also provide evidence that chains update clinic processes and procedures in ways that enhance quality. For example, acquired clinics achieve the IVF gold standard: they reduce multiple births, which pose significantly higher risks for patients, and increase singleton births by enough to have a net positive increase in the live birth rate. We find that this quality-enhancing result coincides with acquired clinics reducing the number of embryos placed in the uterus per transfer, suggesting that clinics improve techniques and processes when conducting single embryo transfers (Reimundo et al. 2021, Mizrachi and McQueen 2022).2 We also find that acquired clinics achieve higher IVF success rates among older patients, whose cases are often more complex. One reason for these improvements is that acquired clinics significantly increase the use of preimplantation genetic testing (PGT), which can help physicians choose higher-quality embryos (Maxwell and Grifo 2018, American College of Obstetricians and Gynecologists 2020). Last, as evidence that clinics learn from their chain, we show that clinics acquired by higher-quality chains experience larger increases in live birth rates than those acquired by lower-quality chains.
In addition to knowledge sharing, chains emphasize providing clinics with resources needed for growth. Consistent with this claim, we find evidence of market expansion rather than business stealing: for every IVF cycle performed by a chain clinic in a market, there is one additional IVF cycle in that market and no reductions for nonchain clinics.3 In cross-sectional analyses using hand-collected data from clinic websites, we find that acquired clinics are nearly twice as likely to market IVF discounts, which could help attract new patients. As another strategy to illustrate resources being used for expansion, we study how private equity (PE) investment into fertility chains impacts volume. Consistent with PE firms easing financial constraints, we find that the largest increases in clinic volume occur when a fertility chain receives PE funding.4
Overall, these results are consistent with fertility chains providing access to resources and knowledge needed to increase clinic volume and IVF success rates. However, rather than improving outcomes, clinics could instead select younger or healthier patients. We do not find evidence of patient selection: results are quantitatively similar whether we include controls for patient characteristics and infertility diagnosis, and there are no systematic changes in patient characteristics posttransaction that would influence IVF success. Because maternal age is the single most important predictor of IVF success, we also show that the distribution of patients in younger and older age groups is similar before and after a clinic transaction.
Fertility chains could also be better at selecting clinics that would generate performance improvements. Although clinic selection is an inherent feature of this setting, we conduct analyses that mitigate concerns that clinic selection explains our results. In event study analyses adjusted for staggered treatment timing, we find no observable pretrends before a clinic transaction. Results are also quantitatively similar in specifications using state × year or market × year fixed effects (FEs), which would help account for state or market-level changes that could impact the demand for fertility services. We also find similar increases in clinic volume and live birth rates for acquired clinics using a matched sample based on pretransaction clinic characteristics.
This paper contributes to several strands of literature. The first studies the economics of chain organizations. Much of this literature has focused on the productivity and competitiveness of large national chains or franchising decisions in the retail and service sector (for a review, see Kosová and Lafontaine 2012). We extend the literature by estimating the causal impact of chain ownership in an understudied healthcare setting. We find that quality improvements depend on clinic ownership: live birth rates increase in acquisitions but not in affiliations. The influence of ownership and control complements the differences found between chain-owned and franchised restaurants (Bernstein and Sheen 2016) and minority- versus majority-owned power plants (Demirer and Karaduman 2024). The fertility chain’s standardization of procedures and processes is also consistent with better management practices contributing to better healthcare outcomes (McConnell et al. 2013, Tsai et al. 2015, Bloom et al. 2020).
Second, this paper contributes to the related literature on the effects of corporate ownership in healthcare.5 The positive impact of chain ownership on fertility clinic quality differs considerably from the predominantly negative or null effects on quality found in the recent healthcare literature.6 For example, Eliason et al. (2020) find that mortality and hospitalization rates increase among dialysis patients after clinics are acquired by large corporate chains. Similar results have been found in the nursing home industry (Harrington et al. 2012, Gupta et al. 2024). There are several possible reasons that outcomes could differ based on the features of these settings. For example, the fertility sector is “a virtually free-market branch of medicine” that relies minimally on third-party payers and heavily on consumer choice (Gabriel 1996). In contrast, the dialysis and nursing home industries rely heavily on Medicare and Medicaid, are more concentrated, and provide longer-term services to a more vulnerable patient population. We discuss additional differences in these settings in our conclusion in Section 6.2.
Third, this research contributes to the literature on the industrial organization of healthcare. There is substantial evidence that as markets become less competitive, prices increase, and quality worsens or remains unchanged (for reviews, see Gaynor et al. 2015, Gaynor 2020). In support of competition incentivizing quality investment, we show that clinics acquired in more competitive markets have larger increases in the live birth rate. We also find limited evidence that fertility chains increase market concentration, likely because they focus on cross-market acquisitions. Beyond changes in market structure, this research also relates to the literature on changes in ownership and outcomes driven by vertical integration (Baker et al. 2014, Saghafian et al. 2023) and nonprofit status conversions (Joynt et al. 2014, Lu and Lu 2022). The fertility sector provides an opportunity to study a change in ownership with fewer organizational complexities because there is minimal integration between clinics, most U.S. fertility clinics are for-profit, and there are no nonprofit chains.
Last, this paper contributes to the research on the fertility industry. Much of the literature has focused on how state fertility coverage mandates impact the utilization of fertility services and treatment choices (Schmidt 2007, Henne and Bundorf 2008, Bitler and Schmidt 2012, Hamilton et al. 2018). Despite expansions in coverage, most of the one in five women struggling with infertility will never have a baby because of barriers to accessing care and low IVF success rates (Centers for Disease Control and Prevention 2023). Although the fertility industry may be “struggling to keep up with demand” (The Economist 2023b), we provide evidence that U.S. fertility chains expand access to IVF and improve IVF success rates. In the long term, these improvements may enable greater gender equality by allowing more women to delay motherhood and invest in their education and careers (Gershoni and Low 2021).
2. The Empirical Setting
2.1. The Fertility Industry
The main providers of infertility services are fertility clinics, which assist couples or individuals who wish to conceive but are unable to naturally. The most effective way to treat infertility is through assisted reproductive technology (ART), where IVF represents over 99% of ART procedures. In the United States, the vast majority of fertility clinics are for-profit businesses, and treatment costs are remarkably high.7 The cumulative cost of IVF is estimated to be between $40,000 and $60,000 because the average patient undergoes multiple IVF cycles (Fertility IQ 2022). These costs are either financed privately by patients or subsidized by insurance companies. However, even with some coverage, patients pay for the majority of services out of pocket (Chambers et al. 2009, McLaughlin et al. 2019).8
By the end of the century, it is estimated that 3% of the world’s population will have been born via IVF (Faddy et al. 2018). This growth is mostly driven by heterosexual couples delaying childbirth and more same-sex couples choosing to have biological children. As a result, “the treatment of infertility has become big business around the world” (Patrizio et al. 2022, p. 305). The projected demand and high margins of fertility clinics have attracted considerable attention from corporate entities such as PE firms, venture capitalists, management companies, and global healthcare chains (Borsa and Bruch 2022, Landi 2022, Pringle 2022). In the United States, these investments have fueled further growth of existing fertility chains (e.g., Reproductive Medical Associates) and helped fund new ones (e.g., Spring Fertility). A similar corporatization trend has been well underway in China, India, Australia, and European countries such as Spain and Denmark (Rønning-Andersson 2018, Mellor 2019, Dhanjal 2023).
2.2. The IVF Process
This paper focuses on fertility clinics that provide IVF. Although the desired outcome of IVF is straightforward, the process of achieving a live birth is complex. The IVF process consists of several stages that involve over 350 steps performed over four to six weeks per cycle (McCaffrey et al. 2022). At a high level, a patient undergoes the five phases of treatment, as shown in Figure 1. Patients often need several cycles to achieve a live birth, with many patients undergoing at least two IVF cycles.

Note. The figure is an illustration of the authors.
Each step of the IVF process depicted in Figure 1 involves subjective decisions that contribute to variation in fertility outcomes across clinics and physicians (Mizrachi and McQueen 2022, Morin 2022). For example, identifying and grading embryo quality and, therefore, which embryos to transfer to the uterus is considered a subjective assessment (Schoolcraft and Meseguer 2017). Similarly, Mizrachi and McQueen (2022) conclude that differences in physician embryo transfer techniques, but not experience, drive much of the variation in the success of an embryo transfer. Several studies have also found that patient mix and clinic volume only explain a small portion of the variation in outcomes across clinics, suggesting that clinic-specific factors are important determinants of IVF success (Lintsen et al. 2010, Wilkinson et al. 2021).
Differences also exist in the core decision made between a reproductive endocrinologist and a patient on whether to transfer a single embryo or multiple embryos: transferring multiple embryos increases the success of pregnancy but also results in multiple births in 30% of pregnancies (Kissin et al. 2016). Multiple births are associated with significant fetal and maternal risks, such as preterm delivery, low birth weight, and preeclampsia. These worse outcomes led the American Society for Reproductive Medicine (2013, 2017) to issue changes in recommended IVF guidelines to lower multiple birth rates by encouraging single embryo transfers. Therefore, the embryo transfer decision generates a tension between increasing a clinic’s live birth rate through multiple embryo transfers and complying with large-scale efforts to reduce multiple births from IVF.
2.3. Organization of Fertility Chains
This paper focuses on fertility clinics that become part of a fertility chain.9 A fertility chain is a multiunit organization, where each unit is owned or managed by a single for-profit business entity and shares in centralized management and standardized business practices. The unit is the fertility clinic, which typically consists of a main office and satellite office for patient visits and procedures and a laboratory for creating, testing, and storing eggs and embryos.10
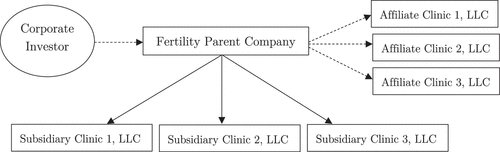
The fertility chain can grow by acquiring a clinic, affiliating with a clinic, or building a new clinic (Figure 2). Most chains pursue a mix of growth strategies. Like other chain organizations in the retail and service sector, fertility chains can be privately held or publicly traded corporations. Therefore, the chains can be sold to or receive funding from other corporations or PE firms. See Online Appendix A for additional details.
2.4. Value Proposition of Fertility Chains
Press releases, company websites, news articles, and industry reports provide insights into the strategies and service offerings of fertility chains. For example, most press releases mention that chains promote growth by providing clinics with managerial capabilities and capital and improve quality by updating clinical processes and developing protocols (see Online Appendix B, Table B1, for press release text analysis). Below we provide additional qualitative evidence on these resource and knowledge transfers.
2.4.1. Financial Resources and Managerial Capabilities.
One reason fertility clinics join fertility chains is to gain access to resources. For example, several chains emphasize providing clinics with long-term “financial stability and growth opportunities”11 and “strong financial support.” These resources can help clinics hire new physicians and build new locations: “[Fertility chain] plans for continued growth through the addition of physicians and satellite offices.” Similarly, another chain advertises that they apply “business and operations strategies that expand [clinic] markets and their market share. This may involve the development of new practice locations, embryology laboratories or ambulatory surgery centers, in order to … achieve strategic growth objectives.” Ultimately, these investments can help increase clinic profitability: one chain advertises that “clinics practices’ patient revenues increased 21% from 2007 to 2009.”
Marketing materials also highlight that fertility chains provide managerial resources to streamline back-office administration. Because fertility clinics are typically run by physicians focused on clinical medicine and not trained in business practices, clinics may benefit from better management practices. For example, one chain advertises providing “operational and financial management, revenue cycle management, patient marketing and sales, information systems support, and various other services, including patient support.” One managerial capability that is particularly highlighted by various chains is marketing, where one chain suggests its clinics should expect “increased patient volume as a result of [the Fertility Chain’s] marketing efforts.”
Chains also attract patients by offering and heavily marketing new pricing models that help patients finance treatment. For example, one fertility chain has its own subsidiary fertility financing company where “the company’s Fertility Loan Specialists will work closely with [the Fertility Chain] to ensure the funds are secured prior to the commencement of [patient] treatment.” Similarly, one chain launched “IVF Refund and Multi-Cycle Programs [that] offer patients the assurance that if multiple IVF cycles are necessary, they will not need to expend additional financial resources to receive them.”
2.4.2. Clinical Knowledge.
A second cited benefit of joining a chain is the ability to share and generate clinical knowledge with other clinics. For instance, a fertility chain advertises that it was “created to break down barriers to idea-sharing and collaborative care.” This sentiment is echoed by a fertility clinic citing “access to … the most advanced on-going research in the field of reproductive medicine” as a reason for joining a chain. Similarly, one clinic suggests their patients will benefit from “improved access to the best treatment protocols and unique programs for specific conditions, … increased access to clinical trials and research initiatives … access to an expanded network of … experts who will come together to review and assist in complex cases.” Multiple physicians echo that chains help standardize clinics’ practices via treatment protocols.
Fertility chains also create internal processes to facilitate knowledge sharing and establish best practices within the chain. Many chains create committees with physicians across clinics who meet regularly to discuss clinical research and patient cases and, in some instances, conduct their own research and clinical trials. For example, one chain states that when “research proves that techniques improve conception rates, [Fertility Chain] incorporates those techniques into their standard care wherever possible.” Another chain says that “treatment breakthroughs are quickly applied to multiple centers, thereby furthering the positive impact for patients.” Chains also advertise using “proprietary platforms, applications, and data and analytics” to track clinic performance and help clinics improve their clinical processes. Last, some chains implement continued medical education and training programs to improve IVF success rates. For example, the chief executive offices of one chain shared: “We’ll look at pregnancy per transfer by physician with a blinded letter for each physician. And we’ll be able to see how everybody stacks up. And if people fall below a standard deviation, we have that doctor go work with somebody who is above a standard deviation to get retrained.”
Fertility chains also advertise strategic goals for the organization that are in line with the latest medical research. For example, many chains advertise increasing single embryo transfers: “Striving for One Embryo-One Baby. [Fertility Chain’s] founding philosophy to achieve successful pregnancy one healthy baby at a time.” This goal is likely motivated by the ongoing efforts from professional associations to reduce multiple births, leading fertility chains to advertise achieving lower multiple birth rates as both a marketing and a reputation tool. Additionally, the chains want to attract employers who offer fertility benefits but are sensitive to the much higher costs associated with multiple births.12 Chains can leverage their outcomes to negotiate with fertility benefits managers to be in an employer’s preferred network of providers. Altogether, the available documentation suggests that when clinics become part of a fertility chain, they receive access to resources and knowledge meant to improve financial and clinical performance.
3. Data and Descriptive Statistics
3.1. Data Description
We construct a panel data set of fertility clinic transactions to estimate the impact of chain ownership on clinic performance. We combine data from several sources to create a novel data set of clinics acquired by or affiliated with a fertility chain between 2004 to 2018. See Online Appendix A for additional details on data construction.
3.1.1. Clinic Characteristics.
All clinics that perform ART must submit data to the CDC annually under the Fertility Clinic Success Rate and Certification Act (FCSRCA) of 1992.13 ART includes all fertility treatments in which either eggs or embryos are handled; over 99% of ART is IVF. The CDC then compiles and publishes Fertility Clinic Success Rates Reports (download from https://www.cdc.gov/art/artdata/index.html), which are meant to inform prospective patients of their probability of achieving a live birth. We will refer to these data as the CDC ART data. Although the data are consistent within a year, the variables collected have undergone changes over time, limiting which variables can be studied in a panel framework. After extensive data cleaning, we create a consistent clinic identification number and identify each clinic’s patient infertility diagnoses, number of IVF cycles and transfers, and IVF success rates. We also use PDF versions of the CDC ART data to extract information on clinic addresses and laboratories.
3.1.2. Market Characteristics.
We define a market as a clinic’s core based statistical area (CBSA), which consists of one or more counties with an urban center of at least 10,000 people plus adjacent counties that are socioeconomically tied to the urban center by commuting.14 Fertility clinics in the sample are present in 145 out of 927 CBSAs.15 Past research on fertility clinic competition has defined the market for fertility services as a metropolitan statistical area (Bundorf et al. 2009, Hamilton and McManus 2012). However, CBSAs, which include both metropolitan and micropolitan statistical areas, help capture additional clinics located in smaller urban areas. We use data from the U.S. Census Bureau and the Bureau of Labor Statistics to obtain market-level population estimates, the median household income, and the unemployment rate. We also calculate the Herfindahl–Hirschman Index (HHI) based on a clinic’s total IVF cycles to measure the competitiveness of the market.
3.1.3. Patient Characteristics.
The CDC ART data are aggregated to the clinic level and do not contain patient-level information. For secondary analyses, we use National Center for Health Statistics (NCHS) vital statistics data to account for market-level patient demographics for women who gave birth after receiving any infertility treatment. The NCHS data include a mother’s race/ethnicity, educational attainment, insurance, and clinical conditions such as hypertension and diabetes, but are only available from 2009–2018 with an indicator for receiving infertility treatment.
3.1.4. Chain Ownership.
We identify clinic transactions through press releases, archived versions of clinic and fertility chain websites, the CDC ART data, and the following business intelligence databases: Levin Associates, SDC Platinum, and Pitchbook data. These business sources often provide the date and the terms of the transaction. Based on their ownership structure, we classify fertility clinics into four main categories (we provide more description on these ownership structures in Online Appendix A):
Acquisition: Some or all of the clinic’s assets are acquired and owned by the chain’s corporate parent.
Affiliation: A clinic contracts with a fertility chain for selected management services and capital or financing options.
De novo: A new fertility clinic built and opened as part of the chain.
Nonchain: A clinic that is never acquired by or affiliated with a fertility chain and never receives funding from corporate investors during the sample period.
To estimate the impact of chain ownership, our primary analysis examines the outcomes of fertility clinics before and after becoming part of chain (i.e., the fertility clinic, not the chain, is the unit of analysis). The control group includes nonchain clinics, and the treatment group includes clinics acquired by or affiliated with a chain.
Both nonchain and chain clinics may be hospital based. This is because even when clinics are part of “nonprofit hospitals or academic institutions, the fertility center itself is often a professionally managed, for-profit, private corporation” (Krawiec 2009, pp. 213–214). Consequently, most fertility clinics in the United States are for-profit. Additionally, even fertility clinics that are part of academic institutions are considered lucrative profit centers (Noah 2003, Jacoby 2009). For these reasons, we include hospital-based clinics in the treatment and control groups. In our empirical analysis, clinic fixed effects account for time-invariant factors associated with being hospital-based, and we show robustness to excluding any clinic that was part of an academic medical center (AMC).
We identify 11 fertility chains in operation in the United States between 2004 and 2018 (see Online Appendix A, Table A1, for details on each chain), which match those identified in industry reports and articles studying fertility clinic business models (Dresner Partners 2018, Borsa and Bruch 2022, Patrizio et al. 2022). During the sample period, ten chains were privately held, and one chain was publicly traded. Most of these chains received PE funding between 2004 and 2018: five of the chains were acquired via leveraged buyouts by PE firms, and three chains received growth equity investments through joint venture agreements with PE firms.16 This means a fertility clinic could be acquired by a chain before the chain itself is acquired by a PE firm. In secondary analyses, we decompose the effect of chain ownership on fertility clinics into chain ownership with PE funding and chain ownership without PE funding.
3.2. Outcome Variables
We focus on two outcomes that measure clinic performance: (1) clinic volume and (2) success of IVF. Clinic volume is measured as the total number of IVF cycles (including donor and nondonor cycles) performed by a clinic in a year. A cycle starts with the intent of retrieving an egg for immediate fertilization or to be frozen for future use. As a secondary volume measure, we also use total transfers. A transfer represents the part of an IVF cycle when one or more embryos are transferred into the uterus of a woman with the intent to establish a pregnancy (Society for Assisted Reproductive Technology 2021a). Not all cycles become transfers because eggs may not develop, the patient may become ill, or the fertilization of the egg may not be successful, among other reasons (Bedrick et al. 2019). In regression analyses, we log volume variables to better fit the data (Online Appendix C, Figure C1).
The success of IVF is measured by the live birth rate per transfer. The live birth rate represents the number of live births divided by the number of transfers using fresh or frozen nondonor eggs (i.e., the patient’s own eggs).17 The CDC ART data report the live birth rates in patient age bins (under 35, 35–37, 38–40, and 41–42). Whereas we present live birth rates separately by age bin, for most analyses, we present a single live birth rate as an age-bin weighted average. We also show results separating the live birth rate into a singleton birth rate and a multiple birth rate (i.e., twin births are counted as one live birth). Unfortunately, changes in how the CDC reports data limit our ability to study alternative live birth outcomes within a panel framework. See Online Appendix A for more details on variable construction and Section 4.6 for further discussion of data limitations and additional analyses to account for data reporting changes.
3.3. Descriptive Statistics
The final analytic sample includes 527 clinics and 6,271 clinic years. To construct this sample, we (1) exclude data reported for patients over the age of 42 because of changes in data availability over the sample period, (2) exclude clinics that perform fewer than 20 cycles a year on average, and (3) exclude clinics that are in the sample for less than 3 years (except for de novo clinics).18 Figure 3 shows that by 2018, over 20% of clinics are in a fertility chain and perform over 40% of IVF cycles in the United States. In total, there are 61 transactions: 33 clinics are structured as acquisitions, and 28 clinics are structured as affiliations. Additionally, 23 clinics are newly built by a chain, 15 clinics are always in a chain, and 428 are never part of a chain (i.e., nonchain clinics). However, in most analyses, we exclude 13 nonchain clinics with multiyear gaps in reporting to the CDC, resulting in 415 nonchain clinics in our analytic sample.19
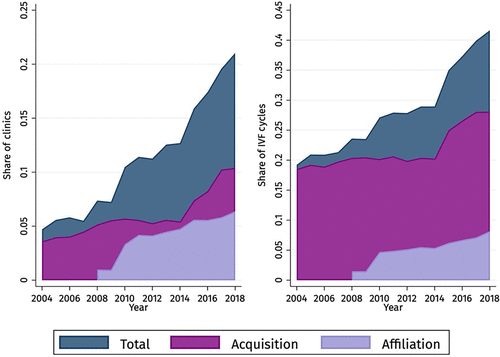
Notes. The left-hand figure shows the share of clinics in a fertility chain each year, and the right-hand figure shows the share of IVF cycles performed by chain clinics. “Total” includes all clinics ever part of a fertility chain, including those always in the chain or that were newly built by the chain.
Table 1 provides additional fertility clinic and market-level characteristics. Prior to a transaction, clinics perform more cycles and transfers and have higher live birth rates than nonchain clinics, suggesting that chains may target better-performing clinics. De novo clinics also provide evidence of the role of chain ownership as they also experience greater volume and IVF success compared with nonchain clinics. Despite differences in these outcomes, patients do not appear to be inherently different across clinics: there are similar distributions of patients under 35 and of patient diagnoses for infertility. Similarly, a mother’s reported education, race/ethnicity, insurance type, and health factors are comparable across clinic categories (Online Appendix C, Table C2).
|

Table 1. Fertility Clinic Summary Statistics, 2004–2018
| Fertility chain | Nonchain | |||
|---|---|---|---|---|
| Acquisition | Affiliation | De novo | ||
| Pretransaction mean | Pretransaction mean | Mean of all years | Mean of all years | |
| Clinic volume | ||||
| IVF cycles | 510.55 | 454.98 | 522.41 | 282.82 |
| IVF transfers | 448.86 | 385.63 | 366.59 | 222.71 |
| Log(IVF cycles) | 5.98 | 5.77 | 5.88 | 5.15 |
| Log(IVF transfers) | 5.85 | 5.62 | 5.48 | 4.93 |
| Birth rates (%) | ||||
| Live birth rate | 40.40 | 39.49 | 42.05 | 36.76 |
| Singleton birth rate | 28.21 | 27.88 | 31.82 | 26.84 |
| Multiple birth rate | 12.16 | 11.59 | 10.23 | 9.85 |
| Patient characteristics (%) | ||||
| Share of patients < 35 | 50.96 | 51.59 | 51.36 | 51.29 |
| Share of patients 35–37 | 24.23 | 23.16 | 22.72 | 23.53 |
| Share of patients ≥ 38 | 24.81 | 25.25 | 25.91 | 25.18 |
| Diagnosis, tubal factor | 10.49 | 9.75 | 8.49 | 12.91 |
| Diagnosis, ov. dysfunction | 9.35 | 8.24 | 10.90 | 12.38 |
| Diagnosis, diminished ov. reserve | 21.28 | 17.14 | 23.62 | 21.33 |
| Diagnosis, endometriosis | 7.28 | 6.03 | 7.21 | 8.00 |
| Diagnosis, uterine factor | 2.96 | 2.36 | 2.50 | 4.01 |
| Diagnosis, male factor | 22.68 | 17.01 | 24.21 | 26.91 |
| Diagnosis, other | 10.47 | 8.62 | 21.31 | 11.03 |
| Diagnosis, unknown | 10.19 | 10.59 | 11.97 | 9.73 |
| Market characteristics (CBSA) | ||||
| Total population (age 20–49) | 1,530,623 | 1,782,535 | 2,721,922 | 1,910,789 |
| Unemployment rate (%) | 6.28 | 5.93 | 5.65 | 6.08 |
| Median household income ($) | 55,008.84 | 54,207.96 | 62,843.02 | 58,461.18 |
| Market concentration (HHI) | 4,281.12 | 3,812.82 | 4,058.80 | 4,410.92 |
| Observations | ||||
| Number of clinics | 33 | 28 | 23 | 415 |
| Clinic-years | 289 | 175 | 138 | 4,962 |
Notes. All summary statistics are at the clinic-year level. Patient age shares are calculated as share of total transfers. See Online Appendix C, Table C1, for year-adjusted summary statistics. ov., ovulatory.
In Online Appendix C, Table C3, we present the results of a targeting regression to understand the probability of a clinic acquisition or affiliation based on pretransaction characteristics. The results suggest chains target clinics that perform more IVF cycles, have a higher live birth rate, and are located in more competitive markets with larger populations aged 20–49. Additionally, chains are less likely to target clinics in markets with a greater share of patients on Medicaid or other insurance.
Overall, these descriptive statistics help inform potential empirical challenges. Although there are differences in the types of clinics selected by fertility chains, there do not appear to be observable differences in the types of patients treated by clinics before the transaction. This pattern is consistent with the homogenous nature of patients treated by fertility clinics. Still, in the empirical analyses that follow, we use several strategies to account for differences between chain and nonchain clinics.
4. The Effect of Chain Ownership
4.1. Empirical Approach
Our empirical strategy aims to identify the causal effects of chain ownership on fertility clinic volume and clinical performance. Our primary strategy utilizes a DiD specification to compare changes in outcomes before and after a fertility clinic becomes part of a fertility chain (treated) with concurrent changes for clinics that were never part of a fertility chain (control). De novo clinics and clinics always in a chain are excluded from DiD analyses. We estimate extensions of this DiD model using an event study framework and a matching estimator, among other analyses, that together provide compelling evidence that chain ownership positively impacts clinic volume and IVF success.
The preferred specification includes clinic fixed effects () to adjust for time-invariant clinic characteristics and calendar state × year fixed effects () to flexibly allow for time-varying factors that are common to all clinics in a state. We also include a vector of controls () that includes an indicator for whether two clinics combined their data reporting to the CDC (i.e., had reported as two separate clinics but then began reporting as a single clinic) and an indicator for the first year a clinic was in the sample to account for partial year reporting when a clinic first enters the data.20 Each estimation uses cluster-robust standard errors at the clinic level:
Equation (1) is a within-clinic regression, where is a binary variable equal to one if clinic c is acquired by or affiliated with a fertility chain in year t. The coefficient of interest, , captures the relationship between becoming part of the chain and . Because there may be differences in clinic outcomes by ownership structure, we use interactions between and whether a clinic transaction was structured as an acquisition or affiliation, as seen in Equation (2):
The identifying variation is primarily based on the staggered timing of clinic transactions and the comparison of treatment and control clinics in their overlapping periods. To interpret the coefficients as the causal effect of the transaction, we must assume that the trends in outcomes of these chain clinics would have been similar to the trends in outcomes of nonchain clinics in the absence of the transaction. The concern with this identification strategy is that the timing of the transaction may be correlated with other contemporaneous factors that impact the outcomes, such as changes in the patient population and the nonrandom selection of clinics. Additionally, recent literature in econometrics has shown the biases that can arise from DiD with staggered treatment timing because of comparisons not only between treated and control units but between already treated and eventually treated units (for reviews, see Baker et al. 2022, Roth et al. 2022). We conduct a series of diagnostic and robustness checks that help mitigate these concerns.
4.2. Main Effect on Clinic Volume and IVF Success Rates
Table 2, panel A, shows the estimates of the pooled regression from Equation (1) using both state × year (the preferred specification) and year fixed effects. After a clinic becomes part of a fertility chain, IVF cycles increase by 25.6%, and IVF transfers increase by 21.4%. Note that data reporting changes in 2017 may lead us to underestimate the true effect of chain ownership on transfers. We provide a discussion and additional analyses in Section 4.6 and Online Appendix F that suggest acquired clinics increase cycles and transfers by similar amounts.
|
Table 2. Effect of Chain Ownership on Fertility Clinic Outcomes
| Log(Cycles) | Log(Transfers) | Live birth rate | ||||
|---|---|---|---|---|---|---|
| (1) | (2) | (3) | (4) | (5) | (6) | |
| Panel A. Pooled | ||||||
| Post | 0.256*** | 0.281*** | 0.214*** | 0.238*** | 0.027** | 0.019* |
| (0.071) | (0.063) | (0.071) | (0.063) | (0.012) | (0.010) | |
| Panel B. Ownership structure | ||||||
| Post × Acquisition | 0.272*** | 0.296*** | 0.214** | 0.225*** | 0.051*** | 0.041*** |
| (0.093) | (0.084) | (0.093) | (0.085) | (0.015) | (0.014) | |
| Post × Affiliation | 0.240** | 0.268*** | 0.215** | 0.251*** | 0.006 | −0.001 |
| (0.104) | (0.091) | (0.103) | (0.090) | (0.017) | (0.014) | |
| Clinic FEs | X | X | X | X | X | X |
| State × year FEs | X | X | X | |||
| Year FEs | X | X | X | |||
| Dependent variable mean | 5.250 | 5.254 | 5.033 | 5.038 | 0.374 | 0.375 |
| Clinic-years | 5,676 | 5,818 | 5,676 | 5,818 | 5,676 | 5,818 |
| R2 | 0.896 | 0.881 | 0.895 | 0.880 | 0.623 | 0.574 |
Notes. Panel A shows the β estimates of Equation (1), and panel B shows the β1 and β2 estimates of Equation (2). The dependent variable mean captures the predicted mean for control clinics and treatment clinics before the transaction. Standard errors are clustered at the clinic level. Statistical interpretations are similar when using wild bootstrap standard errors to adjust for small sample sizes (Online Appendix D, Table D1). See Online Appendix D, Figure D1, for power calculations.
*p < 0.1; **p < 0.05; ***p < 0.01.
There are also significant changes to IVF treatment success: the live birth rate increases by 2.7 percentage points (7.2% of the mean). However, pooling together clinics masks the heterogeneity in outcomes by ownership type. Table 2, panel B, reveals that both acquired and affiliated clinics increase clinic volume, but only acquired clinics increase the live birth rate. After an acquisition, the live birth rate increases by 5.1 percentage points (13.6%), and we fail to find evidence of changes in the live birth rate of affiliated clinics. Table 2 also shows that effect sizes are similar when accounting for time-invariant differences across states rather than within states over time.
Do these improvements in IVF outcomes increase clinic profits? In Online Appendix D, Table D2, we show results of a back-of-the-envelope calculation for acquired clinics. Assuming a static profit margin of 37.5%, we estimate that the average clinic makes $2.4 million in profit per year before acquisition and $3.2 million after acquisition, representing a 33% increase in clinic profits.
4.3. Treatment Effect Timing
4.3.1. Goodman-Bacon Decomposition.
Using a DiD research design with multiple periods and treatment times could result in “bad” comparisons between clinics treated earlier and clinics treated later in the sample. The diagnostic test developed by Goodman-Bacon (2021) decomposes treatment effects into multiple, weighted, two-by-two DiD estimators.21 In Online Appendix D, Table D3, for acquired clinics, we show that approximately 91.5% of the weight is attributable to “good” comparisons of treated to never-treated clinics, and only 5% of the weight is attributed to comparisons between early and later treated clinics and 3.5% to within-clinic variation.
4.3.2. Event Study Analyses.
Next, we use an event study framework to evaluate whether the treatment and control clinics had differential trends before acquisition or affiliation. The event study is an extension of Equation (2), where instead of aggregating years before and after a transaction, indicators are included for each year relative to the transaction year. In addition to implementing “original” two-way fixed effects, in Figure 4, we include estimates from the interaction weighted estimator developed by Sun and Abraham (2021) and estimates from a stacked regression as in Cengiz et al. (2019).22 Together, these estimators further assuage concerns of bias arising from staggered adoption and treatment effect heterogeneity within the DiD framework.
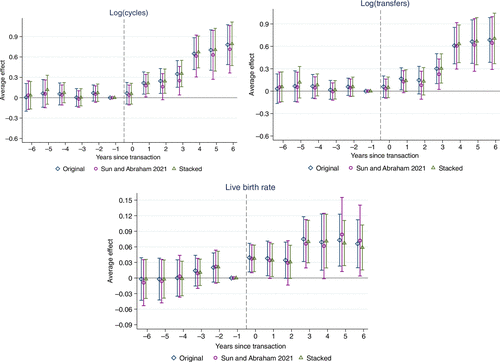
Notes. This figure shows the and estimates of Equation (2) interacted with indicators for the year relative to the transaction year. Bands indicate 95% confidence intervals constructed from clinic-level clustered standard errors. The p-value from an F-test of joint significance on the original two-way fixed effects (TWFE) pre-trend estimates are as follows: 0.533 for log(cycles), 0.780 for log(transfers), and 0.364 for the live birth rate.
Figure 4 shows event study estimates for the six years before and after acquisition for IVF cycles, IVF transfers, and the live birth rate (see Online Appendix D, Figure D2, for affiliated clinics). We observe no significant pretrends before the transaction for IVF cycles and transfers: F-tests of joint significance show that the pretransaction years are not statistically different from zero for all estimators. After transaction, the cycles and transfers start to increase steadily, achieving large volume increases six years posttransaction. Patterns are similar for affiliated clinics (Figure D2). This pattern is consistent with the time it would take for chains to influence both demand and supply-side channels. For example, volume-enhancing changes, such as investments in new office space and laboratories, hiring and training new staff, and attracting new patients through marketing campaigns will likely take time to implement. Demand for IVF also increased substantially during our sample period, with total cycles increasing by 139% between 2004 and 2018 in the United States. To the extent that chains are driving or capturing much of this growth, the large volume effects appear plausible.
With respect to the live birth rate, before acquisition, pretrends are relatively flat and not statistically different from zero. After acquisition, there is evidence that the live birth rate increases in the year of acquisition and remains above three percentage points in all postperiod years. The immediate change in the live birth rate could result from accessing chain-wide protocols, whereas the additional increases in the live birth rate observed after year 2 could result from continued efforts to standardize care and learning from peers. For affiliated clinics, the live birth rate remains close to zero before and after affiliation (Figure D2).
4.3.3. Aggregating Dynamic Effects.
In Online Appendix D, Figure D3, we plot the aggregate event study estimates in the six posttreatment years for all the main outcomes in this manuscript using alternative estimators. This figure further assuages concerns surrounding the bias in the size or direction of the coefficients because the estimators continue to show similarly sized increases in IVF cycles and the live birth rate.
4.4. The Role of Patient Selection
One way chains could influence performance outcomes is by changing the patient population treated by the clinic. Such patient selection could result from patients of higher or lower risk selecting certain clinics or from clinics potentially “cherry picking” patients that would have more successful IVF outcomes, such as younger patients. Below we provide evidence that changes in patient characteristics do not appear to drive changes in the live birth rate.
4.4.1. Similar Patient Age Distributions.
The homogenous patient population mitigates concerns about patient differences across clinics. IVF patients are predominantly white, high income, and highly educated (Chandra et al. 2014, Galic et al. 2021). Furthermore, the largest predictor of IVF success is a patient’s age (Society for Assisted Reproductive Technology 2021b). Predictive models based on pretreatment patient characteristics find that patient age explains 85% of the total variation in the live birth rate and that patient infertility diagnosis, race/ethnicity, and body mass index are not strongly predictive of IVF success (Xu et al. 2022). In Online Appendix E, Figure E1, we show that the distribution of the share of patients in younger and older age groups is similar before and after a clinic transaction.
4.4.2. No Systematic Patient Selection.
We also do not find evidence that clinics systematically treat patients that could be more or less likely to experience IVF success. Figure 5 presents changes in the share of patients in different age groups and patient infertility diagnosis as the outcome variable of Equation (2). For acquired clinics, there is a small reduction in the share of patients aged 35–37 but no statistically significant changes for other age groups, which suggests no clear pattern of patient selection based on age. For affiliated clinics, there is a small reduction in the share of patients under 35. However, in Figure 6 and Online Appendix F, Table F3, we show that (1) increases in clinic volume are similar across all age categories; (2) acquired clinics increase the live birth rate across all age categories, especially among patients over 38; and (3) affiliated clinics do not increase the live birth rate, even among patients under 35. These results further minimize concerns that outcomes are driven by selection on patient age.
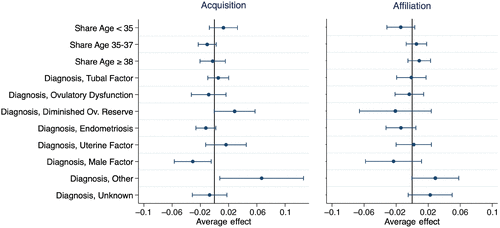
Notes. This figure displays and estimates of Equation (2) using patient characteristics as the outcome variables. Bars are 95% confidence bands. Standard errors are clustered at the clinic level.
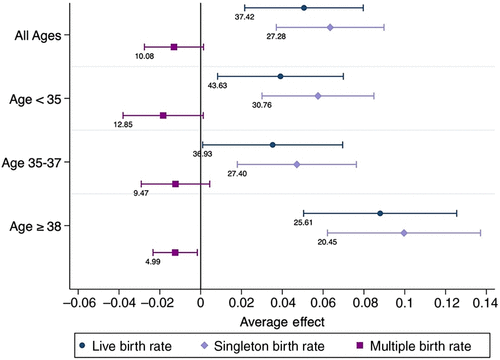
Notes. This figure displays estimates of Equation (2) by patient age category (i.e., only displays results for acquired clinics). The dependent variable mean based on the predicted mean for control clinics and treatment clinics before the transaction is displayed under each 95% confidence bar. Standard errors are clustered at the clinic level. See Online Appendix H, Table H1, for the full regression results.
Patient diagnosis patterns are largely similar in acquired and affiliated clinics, and the changes are unlikely to influence IVF success. For example, even though there are significantly lower rates of patients with male factor infertility, there is limited evidence that male factor infertility impacts IVF outcomes (Shamonki et al. 2004, Kebbon et al. 2017). One study found that among the diagnosis categories, a tubal factor diagnosis is associated with the lowest live birth rate, and ovulatory dysfunction is associated with the highest (Kebbon et al. 2017). Figure 5 shows limited evidence of posttransaction changes for these diagnosis categories.
4.4.3. Robust to Controls for Patient Characteristics.
We find quantitatively similar effects to our primary estimates on live birth rates when including patient diagnoses in Figure 5 as controls, confirming that patient infertility diagnoses have minimal influence on live birth rates (Online Appendix E, Table E1, panel A). We also find quantitatively similar results when including controls for market-level maternal characteristics such as a mother’s race, level of education, insurance status, and health factors, for patients who delivered a baby and reported using infertility treatment (Online Appendix E, Table E1, panel B).
4.5. The Role of Clinic Selection
Selection is an inherent feature of this setting: fertility chains select the clinics they want in their chain, and clinics select the chain they want to join. Because being part of a fertility chain is not randomly assigned, we cannot unambiguously conclude that chain ownership causes changes in clinic volume and IVF success. For example, chains may acquire clinics that they believe will achieve the best outcomes in the future. Below we provide additional discussion and analysis that helps mitigate but does not eliminate the role of clinic selection in explaining our results.
4.5.1. Robust to Alternative Fixed Effects.
The primary specification helps account for potential differences between the treatment and control groups by including clinic fixed effects, which adjust for time-invariant clinic characteristics such as location and reputation. Including state × year fixed effects accounts for time-varying factors common to all clinics in a state. For example, these fixed effects would account for increases in demand for IVF if changes in insurance coverage laws increase the affordability of care. However, results are quantitatively similar when only using year fixed effects (Table 2) and CBSA × year fixed effects which would account for market-level changes that could impact the demand for fertility services (Online Appendix E, Table E2).
4.5.2. Robust to Using Matched Control Groups.
A standard approach to address the endogeneity due to selection is to match treated units with similar characteristics in the pretransaction period to untreated units. In Online Appendix Table E3, panel A, we use 1–1 coarsened exact matching based on a clinic’s mean pretransaction IVF cycles, and in panel B, also match on a clinic’s live birth rate and the share of patients under 35. In both cases, we continue to find large and statistically significant increases in clinic volume and live birth rate for acquired clinics. For affiliated clinics, the point estimates on the volume outcomes are also positive and statistically significant in panel A, but in panel B, are no longer statistically significant. See Online Appendix E, Table E4, for matched sample summary statistics.
Matching on outcome variables within a DiD framework is susceptible to regression to the mean bias (Daw and Hatfield 2018). As an alternative strategy, we drop clinics in the bottom 25% of the distribution of cycles per year (Online Appendix E, Table E3, panel C). We continue to find a statistically significant increase in volume and live birth rates among acquired clinics. For affiliated clinics, point estimates are positive but not statistically significant. The matched sample and sample dropping lower-volume clinics suggest that effects for acquired clinics are not driven by differential selection of clinics based on size. For affiliated clinics, conclusions are less definitive because the volume point estimates become less precise.
4.5.3. Robust to Alternative Samples.
Several features of the data, sample, and context also warrant additional robustness checks. For example, results are robust to limiting the sample to clinics present in all 15 years of data and dropping all chain and nonchain clinics that were ever part of an AMC (Online Appendix E, Table E5). We discuss these and additional analyses in Online Appendix E, Table E5 and E6.
4.6. Data Limitations and Alternative Outcome Measures
A limitation of this study is that we can only consistently observe IVF success rates per transfer rather than per patient. This means that the same patient may undergo multiple transfers during the year. Still, this is a commonly used success rate in IVF research and provides the most granular level to estimate success (Abdalla et al. 2010, Wilkinson et al. 2016, Mizrachi and McQueen 2022). Specifically, the occurrence of a transfer requires the creation of a viable embryo and, therefore, precludes patients with failed cycles. This measure allows for a more “apples to apples” comparison of patients across clinics but provides a narrower view of a clinic’s performance over the course of a full IVF cycle. Below, we consider additional outcomes that can provide a broader view of IVF treatment.
One concern is that a chain clinic could be performing worse on the steps that occur before embryo transfer, leading a patient to undergo more egg retrieval cycles than needed. For example, clinics may cancel a cycle before eggs are retrieved if no or not enough eggs were produced, which could indicate that a clinic was performing worse on ovarian stimulation. However, as seen in Online Appendix F, Table F1, panel A, we find no change in cancelled cycles for acquired clinics. Starting in 2017, we also have data on the percent of cycles stopped after retrieval and before transfer, which often occurs because of failure to create a viable embryo. In a cross-sectional analysis, we find no evidence that chains had different stoppage rates than nonchain clinics (Online Appendix F, Table F1, panel B). These results suggest chain clinics are performing as well as nonchain clinics on IVF steps that occur before an embryo transfer.
Additionally, starting in 2017, the CDC began to report live birth rates for new patients with no prior ART treatment for their first retrieval and their cumulative retrievals (i.e., a per patient measure). In a cross-sectional analysis using 2017 and 2018 data, we show that acquired clinics have significantly higher live birth rates per patient than nonchain clinics and achieve comparable live birth rates between the first retrieval and the cumulative retrieval rate (Online Appendix F, Table F2). This result provides additional evidence that chains have higher live birth rates than nonchain clinics.
Another limitation of this study is the lack of data available on complications related to IVF. For example, ectopic pregnancy, miscarriage, preeclampsia, premature birth, and low birth weight are all significantly higher among IVF patients (American College of Obstetricians and Gynecologists 2016). In Figure 6, discussed in Section 5.2, we show chains increase live births by increasing singleton births rather than multiple births, which is a sign of quality improvement. Additionally, using data from 2016, we can show that chain clinics have comparable rates of singleton births and term, normal weight, singleton live births (Online Appendix F, Table F2). This provides suggestive evidence that clinics are increasing live birth rates without increasing some birth-related complications.
Last, in Table 2, we are likely underestimating the true effect of chain ownership on embryo transfers. This is because of a change in how transfers were reported in 2017 that differentially impacts chain clinics and is, therefore, not fully accounted for by year-fixed effects (Online Appendix F, Figure F1). In Online Appendix F, Table F3, we provide evidence that acquired clinics increase cycles and transfers by nearly the same amount. This is an important finding as it suggests that chains are not being inefficient in ways that would lead them to perform more cycles that do not proceed to a transfer.
4.7. The Role of Insurance Coverage
In the United States, some states mandate insurance coverage of infertility treatment in private insurance plans. These laws could influence demand for IVF services. Whereas our main specification includes state × year FEs to help account for these differences, in Online Appendix G, Table G1, we show whether outcomes differ between clinics located in states that did and did not have mandates. The point estimates on IVF volume are larger in mandate states, but they are not statistically different from nonmandate states. One possible reason for the lack of difference is that the mandates do not apply to self-insured employers, require patients to meet strict definitions of demonstrated infertility, and place limits on cycles and benefits (Weigel et al. 2020).
Another demand-side channel that could influence clinic volume is the increase in large employers providing fertility benefits (Dowling 2021). Although we cannot directly examine this possibility, our results are robust to the inclusion of CBSA × year FEs, which would account for market-specific secular demand shifts, such as Bay Area technology companies beginning to cover fertility services (Carrns 2017). Still, chain clinics may be more adept at capturing this demand through their management services, which often includes marketing to bring in new patients and negotiating agreements with insurers and fertility benefits managers to be in-network. Chain clinics may also have greater capacity to meet this growing IVF demand by building satellite office locations and hiring more administrative and clinical staff.
4.8. The Role of Market Concentration
By consolidating clinics, chains may impact the competitiveness of fertility markets and, therefore, the behavior of fertility clinics. In particular, more concentrated markets may have less incentive to invest in quality than less concentrated (i.e., more competitive) markets (Matsa 2011). We find that only three CBSAs became more concentrated because of chain ownership as measured by an increase in HHI, likely because most acquisitions or affiliations occur across markets. Accordingly, outcomes are quantitatively similar when excluding these markets (Online Appendix G, Table G2). We also find that clinics acquired by chains in more competitive markets increase live birth rates three times more than those acquired in less competitive markets (Online Appendix G, Table G3). These results emphasize the importance of competition for quality promotion in healthcare markets.
5. Mechanisms
The previous analyses find that chain ownership significantly increases clinic volume and IVF success rates and provide evidence that patient and clinic selection do not drive results. In this section, we provide suggestive evidence that the transfer of resources and knowledge following chain ownership most likely explains the changes in clinic volume and IVF success rates. Resource transfers include any transfer of financial resources (e.g., capital) or managerial capabilities (e.g., marketing) from the chain’s corporate parent to the target clinic. Knowledge transfers include the sharing of new clinical information. Chains can transfer knowledge through top-down clinical directives (i.e., protocols, monitoring, and mandatory trainings) and by facilitating knowledge sharing among clinics through the creation of research consortiums and case review meetings. The following analyses are collectively intended to show patterns consistent with resource and knowledge transfers leading to improvement in outcomes.
5.1. Only Acquired Clinics Increase IVF Success Rates
Whether a transaction is structured as an acquisition or an affiliation can influence a parent firm’s incentive and ability to improve the target firm’s performance. Greater ownership typically confers more control over the target firm’s operations and helps align incentives (Grossman and Hart 1986, Hart and Moore 1990). Because the chain owns the clinic’s assets and becomes the residual claimant in an acquisition, it may have more incentive to improve outcomes such as quality, which influence the reputation of the chain. Additionally, a chain may be reluctant to share clinical resources or knowledge with an affiliated clinic if they are “free to walk away at any time with the acquired knowledge” (Garicano and Rayo 2017, p. 2701).23
A chain and an affiliated clinic may also have more alignment over volume enhancing than quality-enhancing changes. Physicians typically enter an affiliation because they wish to retain clinical autonomy while still accessing financial resources and management services needed for growth. Investing in quality can be costly, and affiliated clinics may have less incentive to invest in quality if they believe they already have superior outcomes (as seen in Table 1). Affiliated clinics may also free ride on the reputation of the chain, reducing incentives to improve their own quality (Jin and Leslie 2009). Conversely, if an affiliated clinic is explicitly seeking a chain’s resources and managerial expertise, they may be more receptive to adopting practices that increase clinic capacity and have a more direct impact on their bottom line.
Altogether, a chain may have stronger incentives and ability to direct resources and knowledge toward quality improvement in an acquisition than an affiliation. The finding that only acquired clinics increase the live birth rate supports this argument (in Table 2). Bernstein and Sheen (2016) develop a similar framework when studying the impact of PE buyouts on restaurant chains. They find that quality improvements are concentrated among directly owned compared with franchised restaurants, whereas franchisees were just as likely to adopt initiatives that would have more direct effects on store profits. The latter result is consistent with our finding that affiliated clinics significantly increase volume and, therefore, may be more receptive to utilizing a chain’s resources and knowledge for expansion-related activities.
5.2. Evidence That Chains Change Procedures and Technology to Increase Quality
5.2.1. Acquired Clinics Increase Singleton Births and Reduce Multiple Births.
Improving IVF success rates is a major challenge for fertility clinics. The gold standard is to simultaneously decrease multiple births and increase singleton births by enough to have a net positive effect on the live birth rate. Reducing multiple births is quality enhancing because multiple births have a greater incidence of obstetric and neonatal complications (Kissin et al. 2016). However, transferring multiple embryos (30% probability of a multiple birth) is associated with a greater probability of IVF success than a single embryo transfer (less than 1% probability of a multiple birth). Because the live birth rate is the key metric published by the CDC, this may create an incentive to transfer multiple embryos at once to increase IVF success rates.24
Transferring multiple embryos allows more room for error in the embryos chosen for transfer, whereas a single embryo transfer requires more precision and expertise to identify the highest quality embryo to transfer (Reimundo et al. 2021). If the chain were sharing resources and knowledge to improve IVF processes and quality, we would expect increases in the live birth rate to be driven by increases in singleton births large enough to compensate for reductions in multiple births. In Figure 6, we graphically present results from Equation (2) by the overall live birth rate, multiple birth rate, and singleton birth rate for acquired clinics. For overall IVF success rates, singleton births increase by 6.3 percentage points, and multiple births decrease by 1.3 percentage points. A similar pattern is observed within each patient age group.
5.2.2. Acquired Clinics Increase Genetic Testing, Reduce Embryos Per Transfer, and Update Laboratories.
The increase in the live birth rate driven by singleton births is consistent with new resources or knowledge enabling greater success of single embryo transfers. For example, chains emphasize adopting new procedures that improve embryo selection, such as PGT and intracytoplasmic sperm injection (ICSI): “cutting edge technology enables embryologists and fertility specialists to assess the genetic and chromosomal makeup of an embryo prior to its transfer into a woman’s uterus.”25 As shown in Table 3, we find strong evidence that acquired clinics increase the use of PGT but find no changes in ICSI use (potentially because ICSI was introduced in 1991 and experienced rapid adoption). One chain also describes implementing the use of day 5 blastocyst embryos because “this advanced IVF lab technique allows the embryo to mature as far as it can outside the human body, again allowing embryologists and physicians an enhanced ability to select the best single embryo for transfer.” Although we are unable to measure this outcome, we find that, per transfer, acquired clinics reduce the average number of embryos transferred to the uterus (Table 3). In contrast, we find a small, marginally significant increase in the average number of embryos transferred in affiliated clinics, suggesting they are not adhering to the same clinical practices as the acquired clinics in the chain.
|
Table 3. The Effect of Chain Ownership on Procedure and Laboratory Changes
| (1) | (2) | (3) | (4) | (5) | |
|---|---|---|---|---|---|
| PGT rate | ICSI rate | Avg. # of embryos transferred | Prob. laboratory name change (any) | Prob. laboratory name change (single) | |
| Post × Acquisition | 0.069*** | −0.002 | −0.275*** | 0.399*** | 0.344*** |
| (0.025) | (0.026) | (0.053) | (0.079) | (0.102) | |
| Post × Affiliation | 0.015 | 0.004 | 0.076* | 0.233*** | 0.172* |
| (0.011) | (0.034) | (0.039) | (0.086) | (0.091) | |
| Dependent variable mean | 0.059 | 0.676 | 2.233 | 0.118 | 0.080 |
| Clinic-years | 3,868 | 4,897 | 4,902 | 5,676 | 5,250 |
| R2 | 0.699 | 0.765 | 0.844 | 0.729 | 0.680 |
Notes. This table shows the and estimates of Equation (2). The dependent variable mean captures the predicted mean for control clinics and treatment clinics before the transaction. The CDC ART data do not report PGT until 2007 and changes how the data on PGT, ICSI, and the number of embryos transferred are collected in 2017 and 2018. Therefore, PGT rate uses data from 2007–2016, and ICSI rate and number of embryos transferred use data from 2004–2016. Column (4) includes all clinics and column (5) limits the sample to clinics that only had a single change in the laboratory name during the sample period. Standard errors are clustered at the clinic level.
*p < 0.1; ***p < 0.01.
Fertility chains can also provide resources to help modernize a clinic’s laboratory and implement protocols to standardize laboratory processes. For example, one chain emphasizes that “continuous improvement in laboratory processes and patient care protocols have to lead to increased success rates.” Although we cannot directly measure whether a clinic changes or makes updates to its laboratory, the published CDC ART data include the name of the laboratory used by each clinic each year. A name change may indicate a significant overhaul or signal a rebranding with no meaningful changes to the laboratory. In Table 3, column (4), the outcome variable is zero for all clinics before a name change and one after the first time a clinic changes its laboratory name. In Table 3, column (5), we limit the sample to clinics that only experience one name change, as this may best capture a real change. We find that, posttransaction, the probability a laboratory changes for acquired clinics increases between 34.4 and 39.9 percentage points. These results provide evidence that fertility chains may update clinic laboratories and facilitate the use of new technology and techniques that enhance the quality of IVF.
5.2.3. Acquired Clinics Increase Live Birth Rates for Complex Patients.
As an additional strategy to explore the role of resource and knowledge transfer, we consider whether IVF success rates change for patients of different complexity (Stan and Vermeulen 2013). One of the most important predictors of IVF success is a patient’s age, with patients of older age representing more complex cases. If accessing new or superior knowledge contributes to improved techniques and processes, we would expect the largest improvements for older patients, as they have the most to benefit. Figure 6 provides empirical support for this argument: patients aged 38 and older experience increases in the live birth rate at almost double the rates of patients under 35 or patients ages 35–37. One potential reason for these improvements is the increased use of PGT (Table 3) because studies have found that PGT particularly increases the success of single embryo transfers among older women (Maxwell and Grifo 2018, American College of Obstetricians and Gynecologists 2020).
5.3. Evidence that Chains Facilitate Learning
5.3.1. Lower Performing Clinics Experience Larger Improvements.
If resources and knowledge are being shared within the chain, we may expect clinics with lower performance before joining the chain to benefit the most from accessing the resources and knowledge of the chain. Online Appendix H, Table H2, provides evidence that all acquired clinics experience improvements, but that the largest increases in clinic volume and live birth rates occur among initially lower-performing clinics relative to those that were higher performing. These results suggest that joining a fertility chain creates a “rising tide lifts all boats” effect, in which all clinics improve, but especially lower-performing clinics. Online Appendix H provides additional details on the empirical analysis in this section.
5.3.2. Clinics Acquired by High-Performing Chains Experience Larger Improvements.
If clinics are learning from their chain, we would expect clinics acquired by high-performing chains to experience larger increases in the live birth rate than those acquired by lower-performing chains. We provide evidence consistent with this argument in Online Appendix H, Table H3: live birth rates increase two and half times more in clinics acquired by high-performing chains than those acquired by low-performing chains. These findings suggest that fertility chains with preexisting superior knowledge can facilitate larger increases in live birth rates.
5.3.3. Improvements in the Live Birth Rate Are Not Driven by Volume Increases.
Rather than improving by accessing new resources and knowledge, physicians may improve their outcomes by performing more IVF cycles. A study by Wilkinson et al. (2021) did not find a significant association between a clinic’s volume and its live birth rates. Similarly, a review by Mizrachi and McQueen (2022) found no evidence of differences in IVF success rates based on physician experience: even among fellows, outcomes were stable throughout their training. The authors concluded that because embryo transfer is “performed by a single operator on their own, and thus, after initial training, there is limited opportunity for physicians to compare their technique to other colleagues and improve” (Mizrachi and McQueen 2022, p. 816). Therefore, rather than within-physician learning from increased volume, physicians may be more likely to improve from resource and knowledge sharing within the chain.
The event study results provide insights into the volume–outcome relationship (Figure 4). For example, we find immediate increases in live birth rates without a commensurate increase in volume. Additionally, affiliated clinics see increases in volume but no changes to the live birth rate. We also reestimate the terciles in Table 3, column (1), based on pretransaction IVF cycles but use live birth rate as the outcome (Online Appendix H, Table H4). The estimates of this regression show that acquired clinics in the top tercile of volume pretransaction (which saw no significant increases in volume) still significantly increase the live birth rate. Together, these results suggest the volume-outcome relationship does not appear to drive the increase in the live birth rate.
5.4. Chain Clinics Expand IVF Market
The marketing materials of fertility chains place a large emphasis on growth. For example, chains advertise providing clinics with financial resources to fund add-on locations and hire new clinical and administrative staff. Additionally, chains advertise providing clinics with managerial capabilities such as marketing services and patient engagement programs to attract and retain patients throughout their IVF journey. Clinic growth could help increase access to IVF given the unmet demand for fertility services driven by the scarcity of clinics and cost of IVF (Chambers et al. 2009, Greil et al. 2016).
However, rather than expand the market, chain clinics may instead be capturing the market share of nonchain clinics. We use an instrumental variable strategy to study market expansion versus business stealing (see Online Appendix H for empirical details). We instrument for the number of IVF cycles provided by chains in a market-year using the number of clinics in a chain in that market-year. To test for business stealing, we use IVF cycles performed by nonchain clinics as the outcome variable in the second stage. If for every one IVF cycle performed by a chain clinic, there is one less IVF cycle performed by nonchain clinics, then this would provide evidence of business stealing. To test for market expansion, we instead use the total number of IVF cycles performed by all clinics as the outcome variable in the second stage. If for every one IVF cycle performed by a chain clinic there is one additional IVF cycle in that market, then this would provide evidence of market expansion.
As seen in Table 4, we find no support for business stealing and strong evidence in support of market expansion. We observe no reduction in cycles for nonchain clinics (column (1)), and for every additional cycle performed by a chain clinic, there is one additional cycle at the market level (column (2)). These results are consistent with chains providing resources needed to ease clinic capacity constraints and expand the set of patients utilizing IVF. Given the large unmet demand for fertility services, chain clinics likely increase access to IVF.26 There are also similar patterns observed for the number of live births (columns (3) and (4)), providing evidence that the entry of chain clinics does not significantly impact the IVF outcomes of nonchain clinics.
|
Table 4. Market Expansion Analysis, IV Estimates
| Total market cycles | Total market live births | |||
|---|---|---|---|---|
| (1) | (2) | (3) | (4) | |
| Nonchain clinics | All clinics | Nonchain clinics | All clinics | |
| Total Chain Cycles | −0.005 | 0.995*** | ||
| (0.150) | (0.150) | |||
| Total Chain Live Births | −0.207 | 0.793*** | ||
| (0.132) | (0.132) | |||
| First-stage F-statistic | 79.450 | 79.450 | 63.622 | 63.622 |
| Market-years | 1,930 | 1,930 | 1,930 | 1,930 |
Notes. This table displays the estimates of the second stage Equation (4) (shown in Online Appendix H). The market is defined as the CBSA of the clinic. Total Chain Cycles and Total Chain Live Births represent the total number of IVF cycles and live births performed by chain clinics each year in a CBSA, instrumented using the number of chain clinics each year in a CBSA. The first-stage F-statistic shows the Kleibergen–Paap Wald rk F-statistics. We cannot reject that the estimates in columns (2) and (4) are statistically different from one (the p-values from F-tests are 0.892 and 0.134, respectively). The sample includes all clinics in a CBSA that ever had a nonchain clinic. Standard errors are clustered at the market level.
***p < 0.01.
5.5. Chain Clinics More Likely to Advertise IVF Financing Options
Fertility clinics often describe investing in quality improvements and marketing as strategies to bring new patients into the fertility market. However, the demand effects from quality increases could take time to manifest because of lags in the publication of CDC reports: data for a given year are typically published two to three years later because clinics need to wait 9–10 months to allow for births to occur before the CDC can compile and verify the data. A complementary and more immediate way to attract patients is through marketing, where one popular strategy is to advertise IVF financing options meant to signal the affordability of care (Yu et al. 2022).
Using the Internet Archive to collect advertising information in 2018, we find that clinics acquired by fertility chains are more than twice as likely to advertise money-back guarantees or multiple-cycle discount programs compared with the matched sample of nonchain clinics (Online Appendix H, Table H6). This cross-sectional analysis provides suggestive evidence that chains may attract patients to their clinics by marketing IVF discounts and financing options.
5.6. Private Equity Investment into Chains Increases Clinic Volume
PE firms can enable significant growth among acquired firms by alleviating financial constraints relative to other types of ownership. Therefore, we may expect that the financial resources provided by PE firms would have more salient effects on clinic growth and volume (Braun et al. 2021, Singh et al. 2022). As described in Section 2, eight fertility chains received PE funding during the sample period, creating variation in ownership and timing needed to decompose the effect of PE funding on outcomes.27
Online Appendix H, Table H7, shows the results of Equation (2) decomposing the effect between posttransaction years when a clinic was part of a chain with and without PE funding. We find almost all the volume effect for acquired clinics occurs because of PE funding (13.3% increase in cycles without PE and 30.4% increase with PE). Importantly, PE funding does not influence the live birth rate: live birth rates increase by 5.8 percentage points without PE funding and 5.0 percentage points with PE funding. This result suggests quality improvements occur because of the chain, not the PE funding, whereas clinic growth is more reliant on PE funding.
6. Conclusion
6.1. Summary of Results
This paper studies how chain ownership impacts firm performance in the fertility industry.
By 2018, over 20% of fertility clinics (performing 40% of IVF cycles) were part of a fertility chain. Our results show that both affiliated and acquired clinics increase the volume of IVF cycles by over 25%, whereas only acquired clinics significantly increase the live birth rate. The 5.1 percentage point increase observed after a clinic acquisition represents a statistically and economically meaningful increase of 13.6% in the live birth rate. We provide compelling qualitative and quantitative evidence that resource and knowledge transfers driven by chain ownership are the most likely explanation for the improvement in clinic performance.
Acquired clinics increase the quality of care by simultaneously reducing multiple births and increasing singleton births and achieve the greatest increase in live births among older patients. These improvements coincide with decreases in the number of embryos transferred and a significant increase in preimplantation genetic testing, which has been found to improve IVF success rates among older patients. These results are consistent with the marketing materials and press releases of fertility chains that argue that by facilitating resource and knowledge sharing, they can improve IVF success rates. We also find that chain clinics increase volume mainly through market expansion rather than business stealing and that PE investment into fertility chains largely drives increases in clinic volume. These results are consistent with access to new resources facilitating clinic growth. Last, we do not find evidence that results are driven by changes in patient characteristics that could influence IVF success, differences in the types of clinics selected for acquisition or affiliation, or market-level changes.
6.2. Discussion and Broader Implications
This paper provides evidence that chain organizations can improve healthcare outcomes. The “free market” features of the fertility sector may help explain why we observe positive outcomes compared with settings with regulated prices and larger information asymmetries between patients and providers (Arrow 1963, Dranove and Satterthwaite 1992, Gaynor 2006). For example, in settings such as dialysis and nursing homes where government “plays an outsize role in subsidizing care and in which patients may find it difficult to observe their facilities’ quality, competition may be unlikely to discipline providers’ behavior” (Eliason et al. 2020, p. 262). Reliance on Medicare and Medicaid payments can also lead chain owners to engage in cost-cutting measures that can negatively impact quality. Patients in these settings also have less choice and face higher switching and travel costs given the long-term nature of treatment.28
By contrast, the business model of fertility clinics better resembles that of the retail and service sectors, which emphasize price and quality transparency and rely on consumer choice and self-paying patients. Given that the CDC publishes clinic outcomes, the salience and transparency of the live birth rate may motivate chain operators to invest in quality to attract patients (Jin and Leslie 2003, Dranove and Jin 2010). In support of this argument, Bundorf et al. (2009) found that the introduction of fertility clinic report cards led consumers to alter their choice of clinics. The limited role of third-party payers may also lead chains to engage in more price competition to gain market share (Brown 2019, Sinaiko 2019). We provide evidence that chain clinics are twice as likely to advertise fertility discounts and money-back guarantees, which patients may interpret as a signal of affordability.
Studying fertility clinics also offers insights into other consumer-centric healthcare settings. For instance, the chain business model has become more prevalent in behavioral and mental health, dermatology, dental care, physical therapy, and urgent care following high-profile acquisitions by retail giants such as Walmart, Walgreens, and Amazon, as well as PE firms (Jain et al. 2018, Reed 2023). Like fertility clinics, these are office-based patient-facing settings that can rely more on self-paying patients and increasingly focus on convenience and the patient experience. Therefore, even if chain ownership is not quality enhancing, patients may be willing to pay for convenience and other service amenities (Leive et al. 2023).
However, government agencies and other stakeholders have raised several legitimate concerns surrounding the growth of healthcare chains, particularly those backed by PE firms (Cumming 2022). A key concern, as stated by deputy assistant attorney general Andrew Foreman (2022), is that rather than “function as a maverick or a disruptor in health care markets,” investors will “cause the target company to focus solely on short-term financial gain and not on advancing innovation or quality.” Though we focus on chains and not PE firms specifically, we find that fertility chains can facilitate knowledge and resource sharing needed to improve outcomes. Previously independent clinics had limited means and incentives to collaborate and learn from each other. Joining a fertility chain could help reduce barriers to collaboration, and a centralized management system allows for the distribution of information and standardization of care. We also find limited evidence that fertility clinic acquisitions or affiliations lead to changes in market concentration. However, the ongoing consolidation of fertility clinics could eventually generate anticompetitive effects.
Ultimately, the findings of this paper are societally important and shed light on the future of the fertility industry. The “the fertility sector is booming,” but at the same time, “IVF is failing most women,” which has generated increased scrutiny of fertility clinic performance (Walsh 2021, The Economist 2023a). Even though the live birth rate has increased considerably in the past two decades, most patients still have less than a 40% chance of delivering a baby, and rates vary considerably across clinics. New technologies are currently being developed that utilize artificial intelligence to standardize care and improve success rates, raising questions about which clinics and patients will receive access to these technologies (Kesari 2022). More broadly, the striking improvement in IVF success rates within fertility chains highlights the tension between clinical knowledge as a competitive advantage and a public good that could collectively improve fertility outcomes. Future research must consider implications for equity in access and outcomes.
The authors are grateful to Morten Bennedsen, Matt Backus, Zack Cooper, Mathijs De Vaan, Mert Demirer, Carola Frydman, Paul Gertler, Matt Grennan, Atul Gupta, Hans Christian Kongsted, Adam Leive, Sarah Moshary, Adam Sacarny, Brian Silverman, Toby Stuart, Ashley Swanson, Steve Tadelis, Maggie Zhou as well as numerous conference and seminar participants, and Stefan Scholtes, the associate editor, and three anonymous referees for their helpful comments and suggestions.
1 The FCSRCA of 1992 requires all U.S. clinics that perform IVF to report their outcomes to the CDC. Yearly reports are published with standardized information on IVF success rates and are widely used by patients (Bundorf et al. 2009, Kowitt 2020).
2 A transfer of multiple embryos at once has a higher initial success rate but has a greater chance of a multiple birth. A single embryo transfer has lower initial success rates but less than 1% probability of a multiple birth. Therefore, it is more difficult to increase the live birth rate via single embryo transfers.
3 Market expansion is likely possible because of the large unmet demand for fertility services (Chambers et al. 2009, Greil et al. 2016). However, fertility chains are a relatively recent phenomenon and may eventually drive out less productive or lower-quality clinics (Foster et al. 2006).
4 The impact of PE on volume is supported by several studies of PE ownership in the finance literature (see Boucly et al. 2011, Bernstein and Sheen 2016, Fracassi et al. 2022).
5 The corporatization phenomenon in healthcare refers to “corporate investors (e.g., public companies, venture capital/private equity firms, insurance companies, and health systems) acquiring a majority and/or controlling interest” in previously independent organizations (American Medical Association 2019, p. 1).
6 Andreyeva et al. (2024) document negative effects on hospital readmissions in chain-acquired hospitals. La Forgia (2023) finds reductions in quality after practices are acquired by physician management chains that focus on financial services. A systematic review of the literature on PE ownership (both chain and nonchain organizations) also found mixed to harmful impacts on patients (Borsa et al. 2023).
7 Even for the few clinics that are part of nonprofit academic medical centers (Patrizio et al. 2022), the fertility clinic itself may be organized as a for-profit subsidiary. See Section 3.1 for details.
8 Insurance coverage varies widely by state and employer. State coverage mandates do not apply to self-insured companies and often only cover some costs of care. Still, some coverage can considerably reduce the total out-of-pocket costs associated with IVF and influence treatment decisions (Hamilton et al. 2018). For this reason, our primary specification includes state × year fixed effects.
9 In general, healthcare providers are often reluctant to use business terms such as “chain” and use terms such as “network.” Similarly, instead of big box–style rebranding, clinics typically signal chain status through websites and marketing materials.
10 Like many office-based specialties, fertility clinics often have satellite office locations within a geographic area for patient convenience. The CDC ART data are at the clinic level and not the office level.
11 The quoted material in this section and the next is from the following websites: Prelude Fertility (Become a Partner, https://www.preludefertility.com/become-a-partner, accessed December 1, 2022), Prelude Fertility (Providers, https://web.archive.org/web/20170612045448/https://www.preludefertility.com/providers/, accessed December 1, 2022), Vivere Health (Press Release, https://www.fiercehealthcare.com/healthcare/vivere-health-llc-expands-network-fertility-centers-excellence-to-florida, accessed December 1, 2022), Vivere Health (About us, https://web.archive.org/web/20160530133347/http:/www.viverehealth.com/physicians/about-us/, accessed December 1, 2022), IntegraMed (AttainFertility Centers, https://web.archive.org/web/20110314151145/http:/attainfertilitycenters.com/success/index.html, accessed December 1, 2022), IntegraMed (Press Release, https://www.businesswire.com/news/home/20120210005124/en/IntegraMed?s-Attain-Fertility-Centers-to-Manage-Fertility-Operations-For-UNC-Health-Care, accessed December 1, 2022), Shady Grove Fertility (Financing Grants, https://www.shadygrovefertility.com/financing-grants/, accessed December 1, 2022), CCRM Fertility (Press Release, https://www.prnewswire.com/news-releases/ccrm-fertility-launches-new-ivf-refund-and-multi-cycle-programs-301078370.html, accessed December 1, 2022), Ovation Fertility (Press Release, https://www.prweb.com/releases/2016/04/prweb13372864.htm, accessed December 1, 2022), CCRM Fertility (News and Events, https://www.ccrmivf.com/news-events/14993/, accessed December 1, 2022), Boston IVF (Press Release, https://www.prweb.com/releases/2015/03/prweb12567470.htm, accessed December 1, 2022), Aspire Fertility (Our Process, https://web.archive.org/web/20160310091741/http:/www.aspirefertility.com/our-process/, accessed December 1, 2022), RMA Network (Company Profile, https://www.linkedin.com/company/thermanetwork/, accessed December 1, 2022), Prelude Fertility (About Us, https://www.preludefertility.com/about-us, accessed December 1, 2022), Boston IVF (Podcast, https://www.fertilitybridge.com/inside-reproductive-health/the-fertility-private-equity-playbook-the-players-and-the-payors-as-analyzed-by-david-stern-ceo-of-boston-ivf, accessed December 1, 2022), Ovation Fertility (Press Releases, https://www.ovationfertility.com/pressreleases/ovation-fertility-presenting-one-embryo-one-baby-success-advances-cryopreservation-annual-bioanalysts-conference/, accessed December 1, 2022). For additional details, see Online Appendix B, Table B2.
12 A multiple birth can cost up to 20 times more than a singleton birth. Therefore, self-insured employers have an incentive to reduce multiple births to reduce the birth costs they would incur from offering fertility benefits (Lemos et al. 2013). In fact, several fertility benefits management companies advertise only partnering with clinics with low multiple birth rates to attract employers (WINfertility 2022).
13 To ensure data quality, the medical director of a clinic must verify by signature that the success rates are accurate. Additionally, a random sample of clinics is audited each year.
14 A patient’s choice of fertility clinic is not typically related to distance in areas with multiple clinics. Patients are often “willing and able to travel long distances to use the provider of their choice regardless of distance, time, or expense” (Harris et al. 2017, p. 1026).
15 One fertility clinic in Alaska is not located in a CBSA and was assigned its county-level market characteristics. Clinics in Puerto Rico are excluded from analyses with market-level controls because several variables are unavailable during the sample period.
16 One chain was acquired by a PE firm in December 2018, the last month of our sample period. Therefore, we do not include it as PE-funded in descriptions or analyses.
17 An IVF cycle may result in only one or multiple embryos. With multiple viable embryos, one or more embryos may be transferred within a few days of creation, with the remainder frozen. If the fresh embryo transfer is unsuccessful, the frozen embryos can be thawed and transferred subsequently.
18 We also exclude 19 clinic-years when a clinic has fewer than 10 IVF cycles in their first or last year of data, as this signals a clinic opening or closure and may not accurately reflect a clinic’s fertility program.
19 Multiyear gaps can occur if a clinic pauses IVF cycles to restructure or fails to adhere to FCSRCA reporting requirements. Including these clinics yields slightly larger effect sizes than those in Table 2.
20 For the seven clinics in our analytic sample that merged, we combine their data to create a single clinic by taking the weighted average of their outcome variables in each year. We create an indicator variable equal to one after merger and include this as a control variable. Results are robust to dropping all clinics that merged (Online Appendix E, Table E6).
21 The Goodman-Bacon decomposition requires a balanced panel, which limits this analysis to clinics with 15 years of data (52% of clinics and 64% of observations). However, 82% of acquired clinics (85% of observations) have a balanced panel. In Online Appendix E, Table E5, we show results of our primary specification in Table 2 are quantitatively similar in the balanced panel.
22 We use the Stata command eventstudyinteract by Sun (2021) and stackedev by Bleiberg (2021).
23 For example, in an internal document from a chain, the chain says one affiliate planned to walk-away in 2021, prompting them to focus exclusively on majority-only acquisitions (e.g., acquire 51%+ of target entity) going forward.
24 Although some patients may prefer twins, research suggests they may not comprehend the associated risks. Patient education can be an effective strategy in reducing desire for twins and increasing the use of single embryo transfers (Shenoy et al. 2017, Mendoza et al. 2018, Sunderam et al. 2018).
25 The quoted material in this section is from the following websites: Austin IVF (AustinIVF Announcements, https://www.austinivf.com/austin-ivf-2014-lab-results-theyre-positive/, accessed December 1, 2022:) and RMA Network (RMA LinkedIn Homepage, https://www.linkedin.com/company/thermanetwork/, accessed December 1, 2022).
26 An increase in cycles may also be the result of supplier-induced demand: physicians pressure patients into IVF instead of alternative treatments. However, this does not necessarily make patients worse off. Alternative treatments, such as intrauterine insemination, have a higher incidence of multiple birth and can often take longer to achieve pregnancy than IVF.
27 Of these eight chains, three chains enter joint ventures or receive growth equity from PE firms and five chains are acquired via leveraged buyouts by PE firms (in some of these cases, the chain itself is created through the buyout of a flagship clinic with add-on acquisitions). Because we are interested in measuring access to additional financial resources, we treat both types of deals as receiving PE funding.
28 Through mergers and acquisitions, nursing home, dialysis clinics, and hospital markets have become increasingly more concentrated, further limiting incentives to invest in quality. By contrast, the fertility sector is still relatively fragmented. Additionally, the patients of nursing homes, dialysis clinics, and hospitals are substantially more diverse in age, risk factors, and demographics than those of fertility clinics.
References
- (2010) Is meaningful reporting of national IVF outcome data possible? Human Reproduction 25(1):9–13.Crossref, Google Scholar
American College of Obstetricians and Gynecologists (2016) Perinatal risks associated with assisted reproductive technology. Report, American College of Obstetricians and Gynecologists, Washington, DC.Google ScholarAmerican College of Obstetricians and Gynecologists (2020) Preimplantation genetic testing. Obstetrics Gynecology 135(3):e133–e137.Crossref, Google ScholarAmerican Medical Association (2019) Report 11 of the Council on Medical Service (A-19). Report, American Medical Association, Chicago.Google ScholarAmerican Society for Reproductive Medicine (2013) Criteria for number of embryos to transfer: A committee opinion. Fertility Sterility 99(1):44–46.Google ScholarAmerican Society for Reproductive Medicine (2017) Guidance on the limits to the number of embryos to transfer: A committee opinion. Fertility Sterility 107(4):901–903.Crossref, Google Scholar- Andreyeva E, Gupta A, Ishitani C, Sylwestrzak M, Ukert B (2024) The corporatization of independent hospitals. J. Political Econom. Microeconomics 2(3).Google Scholar
- (1963) Uncertainty and the welfare economics of medical care. Amer. Econom. Rev. 53(5):941–973.Google Scholar
- (2014) Vertical integration: Hospital ownership of physician practices is associated with higher prices and spending. Health Affairs 33(5):756–763.Crossref, Google Scholar
- (2022) How much should we trust staggered difference-in-differences estimates? J. Financial Econom. 144(2):370–395.Crossref, Google Scholar
- (2019) Factors associated with early in vitro fertilization treatment discontinuation. Fertility Sterility 112(1):105–111.Crossref, Google Scholar
- (2016) The operational consequences of private equity buyouts: Evidence from the restaurant industry. Rev. Financial Stud. 29(9):2387–2418.Crossref, Google Scholar
- (2012) Utilization of infertility treatments: The effects of insurance mandates. Demography 49(1):125–149.Crossref, Google Scholar
- Bleiberg J (2021) STACKEDEV: Stata module to implement stacked event study estimator. Statistical Software Components S459027, Boston College Department of Economics, Chestnut Hill, MA.Google Scholar
- (2012) Americans do it better: US multinationals and the productivity miracle. Amer. Econom. Rev. 102(1):167–201.Crossref, Google Scholar
- (2020) Healthy business? Managerial education and management in health care. Rev. Econom. Statist. 102(3):506–517.Crossref, Google Scholar
- (2022) Prevalence and performance of private equity-affiliated fertility practices in the United States. Fertility Sterility 117(1):124–130.Crossref, Google Scholar
- (2023) Evaluating trends in private equity ownership and impacts on health outcomes, costs, and quality: Systematic review. British Medical J. 382:e075244.Google Scholar
- (2011) Growth LBOs. J. Financial Econom. 102(2):432–453.Crossref, Google Scholar
- (2021) Association of private equity investment in US nursing homes with the quality and cost of care for long-stay residents. JAMA Health Forum 2:e213817.Crossref, Google Scholar
- (2019) Equilibrium effects of health care price information. Rev. Econom. Statist 101(4):699–712.Crossref, Google Scholar
- (2009) Do markets respond to quality information? The case of fertility clinics. J. Health Econom. 28(3):718–727.Crossref, Google Scholar
- (2017) Tech companies get high marks for covering infertility treatments. New York Times (November 15), https://www.nytimes.com/2017/11/15/your-money/infertility-treatment-coverage.html.Google Scholar
- Cengiz D, Dube A, Lindner A, Zipperer B (2019) The effect of minimum wages on low-wage jobs. Quart. J. Econom. 134(3):1405–1454.Google Scholar
Centers for Disease Control and Prevention (2023) Infertility FAQs. Accessed May 15, 2024, https://www.cdc.gov/reproductive-health/infertility-faq/?CDC_AAref_Val=https://www.cdc.gov/reproductivehealth/infertility/index.htm#.Google Scholar- (2009) The economic impact of assisted reproductive technology: A review of selected developed countries. Fertility Sterility 91(6):2281–2294.Crossref, Google Scholar
- (2014) Infertility service use in the United States: Data from the National Survey of Family Growth, 1982–2010. Natl. Health Statist. Rep. 73:1–21.Google Scholar
- (2022) Antitrust authorities take aim at private-equity healthcare deals. Wall Street Journal (June 14), https://www.wsj.com/articles/antitrust-authorities-take-aim-at-private-equity-healthcare-deals-11655243804.Google Scholar
- (2018) Matching and regression to the mean in difference-in-differences analysis. Health Services Res. 53(6):4138–4156.Crossref, Google Scholar
- (2024) Do mergers and acquisitions improve efficiency: Evidence from power plants. NBER Working Paper No. 32727, National Bureau of Economic Research, Cambridge, MA.Google Scholar
- (2023) Verlinvest picks up controlling stake in fertility chain Ferty9. Economic Times (April 19), https://economictimes.indiatimes.com/industry/healthcare/biotech/verlinvest-picks-up-controlling-stake-in-fertility-chain-ferty9/articleshow/99594398.cms?from=mdr.Google Scholar
- (2021) New survey finds employers adding fertility benefits to promote DEI. Mercer (May 6), https://www.mercer.us/our-thinking/healthcare/new-survey-finds-employers-adding-fertility-benefits-to-promote-dei.html.Google Scholar
- (2010) Quality disclosure and certification: Theory and practice. J. Econom. Lit. 48(4):935–963.Crossref, Google Scholar
- (1992) Monopolistic competition when price and quality are imperfectly observable. RAND J. Econom. 23(4):518–534.Crossref, Google Scholar
Dresner Partners (2018) The continuing consolidation of the fertility sector. Report, Dresner Partners, Chicago.Google Scholar- (2020) How acquisitions affect firm behavior and performance: Evidence from the dialysis industry. Quart. J. Econom. 135(1):221–267.Crossref, Google Scholar
- (2018) A demographic projection of the contribution of assisted reproductive technologies to world population growth. Reproductive Biomedicine Online 36(4):455–458.Crossref, Google Scholar
- (2022) IVF—In vitro fertilization: Costs of IVF. Accessed December 12, https://www.fertilityiq.com/ivf-in-vitro-fertilization/costs-of-ivf#what-is-the-total-cost-of-ivf.Google Scholar
- (2022) Deputy assistant attorney general Andrew Forman delivers keynote at the ABA’s antitrust in healthcare conference: The importance of vigorous antitrust enforcement in health care. (June 3), https://www.justice.gov/opa/speech/deputy-assistant-attorney-general-andrew-forman-delivers-keynote-abas-antitrust.Google Scholar
- (2006) Market selection, reallocation, and restructuring in the U.S. retail trade sector in the 1990s. Rev. Econom. Statist. 88(4):748–758.Crossref, Google Scholar
- (2022) Barbarians at the store? Private equity, products, and consumers. J. Finance 77(3):1439–1488.Crossref, Google Scholar
- (1996) High-tech pregnancies test hope’s limit. New York Times (January 7), https://www.nytimes.com/1996/01/07/us/high-tech-pregnancies-test-hope-s-limit.html.Google Scholar
- (2021) Disparities in access to fertility care: Who’s in and who’s out. Fertility Sterility Rep. 2(1):109–117.Google Scholar
- (2017) Relational knowledge transfers. Amer. Econom. Rev. 107(9):2695–2730.Crossref, Google Scholar
- (2006) Competition and quality in health care markets. Foundations Trends Microeconom. 2(6):441–508.Crossref, Google Scholar
- (2020) What to do about health-care markets? Policies to make health-care markets work. The Hamilton Project. Accessed December 20, 2022, https://www.hamiltonproject.org/wp-content/uploads/2023/01/Gaynor_PP_FINAL.pdf.Google Scholar
- (2015) The industrial organization of health-care markets. J. Econom. Lit. 53(2):235–284.Crossref, Google Scholar
- (2021) The power of time: The impact of free IVF on women’s human capital investments. Eur. Econom. Rev. 133:103645.Crossref, Google Scholar
- (2021) Difference-in-differences with variation in treatment timing. J. Econometrics 225(2):254–277.Crossref, Google Scholar
- (2016) A new way to estimate the potential unmet need for infertility services among women in the United States. J. Women’s Health 25(2):133–138.Crossref, Google Scholar
- (1986) The costs and benefits of ownership: A theory of vertical and lateral integration. J. Political Econom. 94(4):691–719.Crossref, Google Scholar
- (2024) Owner incentives and performance in healthcare: Private equity investment in nursing homes. Rev. Financial Stud. 37(4):1029–1077.Crossref, Google Scholar
- (2012) The effects of insurance mandates on choices and outcomes in infertility treatment markets. Health Econom. 21(8):994–1016.Crossref, Google Scholar
- (2018) Health care access, costs, and treatment dynamics: Evidence from in vitro fertilization. Amer. Econom. Rev. 108(12):3725–3777.Crossref, Google Scholar
- (2012) Nurse staffing and deficiencies in the largest for-profit nursing home chains and chains owned by private equity companies. Health Services Res. 47(1):106–128.Crossref, Google Scholar
- (2017) Geographic access to assisted reproductive technology health care in the United States: A population-based cross-sectional study. Fertility Sterility 107(4):1023–1027.Crossref, Google Scholar
- (1990) Property rights and the nature of the firm. J. Political Econom. 98(6):1119–1158.Crossref, Google Scholar
- (2008) Insurance mandates and trends in infertility treatments. Fertility Sterility 89(1):66–73.Crossref, Google Scholar
- (2009) The debt financing of parenthood. Law Contemporary Problems 72(3):147–175.Google Scholar
- (2018) What’s behind the surge in retail healthcare deals? Report, Bain & Company, New York.Google Scholar
- (2003) The effect of information on product quality: Evidence from restaurant hygiene grade cards. Quart. J. Econom. 118(2):409–451.Crossref, Google Scholar
- (2009) Reputational incentives for restaurant hygiene. Am. Econom. J. Microeconom. 1(1):237–267.Crossref, Google Scholar
- (2014) Association between hospital conversions to for-profit status and clinical and economic outcomes. JAMA 312(16):1644–1652.Crossref, Google Scholar
- Kebbon VK, Ghukasyan LT, Olovsson M, Berglund L, Brodin T, Holte J (2017) Which factors are most predictive for live birth after in vitro fertilization and intracytoplasmic sperm injection (IVF/ICSI) treatments? Analysis of 100 prospectively recorded variables in 8,400 IVF/ICSI single-embryo transfers. Fertility Sterility 107(3):641–648.e2.Google Scholar
- (2022) Here’s how AI is helping make babies by revolutionizing IVF. Forbes (July 30), https://www.forbes.com/sites/ganeskesari/2022/06/30/heres-how-ai-is-helping-make-babies-by-revolutionizing-ivf/.Google Scholar
- (2016) Fertility treatments in the United States. Obstetrics Gynecology 128(2):387–390.Crossref, Google Scholar
- (2012) Much ado about chains: A research agenda. Internat. J. Indust. Organ. 30(3):303–308.Crossref, Google Scholar
- (2020) Fertility Inc.: Inside the big business of babymaking. Fortune (January 21), https://fortune.com/longform/fertility-business-femtech-investing-ivf/.Google Scholar
- (2019) Industry voices—Fertility clinics offer big potential for investors and physician practices. Accessed December 8, 2022, https://www.fiercehealthcare.com/hospitals-health-systems/industry-voices-fertility-clinics-offer-big-potential-for-investors-and.Google Scholar
- (2009) Altruism and intermediation in the market for babies. Washington Lee Law Rev. 66:203–257.Google Scholar
- (2023) The impact of management on clinical performance: Evidence from physician practice management companies. Management Sci. 69(8):1–22.Google Scholar
- (2022) Fertility support startups banked $ 345M in 2021. Here’s why the business of family planning is booming. Accessed December 1, 2022, https://www.fiercehealthcare.com/health-tech/fertility-support-startups-banked-345m-funding-2021-heres-why-workplace-perk-becoming.Google Scholar
- (2023) On resource allocation in health care: The case of concierge medicine. J. Health Econom. 90:102776.Crossref, Google Scholar
- (2013) Healthcare expenses associated with multiple vs singleton pregnancies in the United States. Amer. J. Obstetrics Gynecology 209(6):586.e1–586.e11.Crossref, Google Scholar
- (2010) Can differences in IVF success rates between centres be explained by patient characteristics and sample size? Human Reproduction 25(1):110–117.Crossref, Google Scholar
- (2022) Does nonprofit ownership matter for firm performance? Financial distress and ownership conversion of nursing homes. Management Sci. 68(7):5127–5145.Link, Google Scholar
- (2011) Competition and product quality in the supermarket industry. Quart. J. Econom. 126(3):1539–1591.Crossref, Google Scholar
- (2018) Should every embryo undergo preimplantation genetic testing for aneuploidy? A review of the modern approach to in vitro fertilization. Best Practice Res. Clinical Obstetrics Gynaecology 53:38–47.Crossref, Google Scholar
- (2022) IVF—In vitro fertilization: What is IVF? Accessed January 5, 2023, https://www.fertilityiq.com/ivf-in-vitro-fertilization/summary-of-the-ivf-process#what-is-ivf.Google Scholar
- (2013) Management practices and the quality of care in cardiac units. JAMA Internat. Medicine 173(8):684–692.Crossref, Google Scholar
- (2019) Business models and provider satisfaction in in vitro fertilization centers in the USA. J. Assisted Reproduction Genetics 36(3):283–289.Crossref, Google Scholar
- (2019) Chinese demand for fertility treatment spurs IVF deals. Nikkei Asia (April 7), https://asia.nikkei.com/Business/Business-trends/Chinese-demand-for-fertility-treatment-spurs-IVF-deals#:∼:text=HONGKONG–Afterfour,seek more reliable%2C accessible care.Google Scholar
- (2018) Infertile couples prefer twins: Analysis of their reasons and clinical characteristics related to this preference. J. Reproduction Infertility 19(3):167–173.Google Scholar
- (2022) Embryo transfer success: It is in our hands. Fertility Sterility 118(5):815–819.Crossref, Google Scholar
- (2022) Why it matters which doctor performs your IVF transfer. Accessed September 12, 2022, https://www.fertilityiq.com/topics/ivf/why-it-matters-which-doctors-performs-your-ivf-transfer.Google Scholar
- (2003) Assisted reproductive technologies and the pitfalls of unregulated biomedical innovation. Florida. Law Rev. 55(2):603–665.Google Scholar
- (2022) The changing world of IVF: The pros and cons of new business models offering assisted reproductive technologies. J. Assisted Reproduction Genetics 39(2):305–313.Crossref, Google Scholar
- (2022) Cautious optimism from PE investors in fertility care. Axios (July 23), https://www.axios.com/2022/07/23/cautious-optimism-pe-investors-fertility-care.Google Scholar
- (2023) How major retailers are trying to change how America consumes health care. Axios (March 8), https://www.axios.com/2023/03/08/how-major-retailers-how-america-health-care.Google Scholar
- , Rodríguez Pérez T, Veiga E (2021) Single-embryo transfer: A key strategy to reduce the risk for multiple pregnancy in assisted human reproduction. Adv. Laboratory Medicine 2(2):179–188.Google Scholar
- (2017) Investors see big money in infertility. And they’re transforming the industry. STAT (December 4), https://www.statnews.com/2017/12/04/infertility-industry-investment/.Google Scholar
- (2018) World-leading fertility group acquires Danish clinic for millions. MedWatch (September 19), https://medwatch.dk/secure/Top_picks_in_english/article10873749.ece.Google Scholar
- (2022) What’s trending in difference-in-differences? A synthesis of the recent econometrics literature. J. Econometrics 235(2):2218–2244.Crossref, Google Scholar
- Saghafian S, Song L, Newhouse JP, Landrum MB, Hsu J (2023) The impact of vertical integration on physician behavior and healthcare delivery: Evidence from gastroenterology practices. Management Sci. 69(12):7158–7179.Google Scholar
- (2007) Effects of infertility insurance mandates on fertility. J. Health Econom. 26(3):431–446.Crossref, Google Scholar
- (2017) Paving the way for a gold standard of care for infertility treatment: Improving outcomes through standardization of laboratory procedures. Reproductive Biomedicine Online 35(4):391–399.Crossref, Google Scholar
- (2004) The influence of male factor infertility on the progression of day-3 embryos to blastocyst: A case-control study. Fertility Sterility 82(2):S172.Crossref, Google Scholar
- (2017) Impact of patient preference on rate of double embryo transfer and resultant twin gestation. Fertility Sterility 107(3):e47–e48.Crossref, Google Scholar
- (2019) What is the value of market-wide health care price transparency? JAMA 322(15):1449–1450.Crossref, Google Scholar
- (2022) Association of private equity acquisition of physician practices with changes in health care spending and utilization. JAMA Health Forum 3(9):e222886.Crossref, Google Scholar
Society for Assisted Reproductive Technology (2021a) What is SART? Accessed November 12, 2022, https://www.sart.org/patients/what-is-sart/.Google ScholarSociety for Assisted Reproductive Technology (2021b) Success rates. Accessed January 1, 2023, https://www.sart.org/patients/a-patients-guide-to-assisted-reproductive-technology/general-information/success-rates/.Google Scholar- (2013) Selection at the gate: Difficult cases, spillovers, and organizational learning. Organ. Sci. 24(3):796–812.Link, Google Scholar
- (2021) EVENTSTUDYINTERACT: Stata module to implement the interaction weighted estimator for an event study. Statistical Software Components S458978, Department of Economics, Boston College, Boston.Google Scholar
- (2021) Estimating dynamic treatment effects in event studies with heterogeneous treatment effects. J. Econometrics 225:175–199.Crossref, Google Scholar
- (2018) Effects of patient education on desire for twins and use of elective single embryo transfer procedures during ART treatment: A systematic review. Reproductive Biomedicine Soc. Online 6:102–119.Crossref, Google Scholar
The Economist (2023a) The fertility sector is booming (July 17), https://www.economist.com/technology-quarterly/2023/07/17/the-fertility-sector-is-booming.Google ScholarThe Economist (2023b) In vitro fertilisation is struggling to keep up with demand (July 17), https://www.economist.com/technology-quarterly/2023/07/17/in-vitro-fertilisation-is-struggling-to-keep-up-with-demand.Google Scholar- (2015) Hospital board and management practices are strongly related to hospital performance on clinical quality metrics. Health Affairs 34(8):1304–1311.Crossref, Google Scholar
- (2021) The uncertain future of human production. Accessed January 2, 2023, https://www.axios.com/2021/01/09/gene-editing-and-the-uncertain-future-of-human-reproduction.Google Scholar
- (2020) Coverage and use of fertility services in the U.S. Accessed December 9, 2022, https://www.kff.org/womens-health-policy/issue-brief/coverage-and-use-of-fertility-services-in-the-u-s/.Google Scholar
- (2016) No common denominator: A review of outcome measures in IVF RCTs. Human Reproduction 31(12):2714–2722.Crossref, Google Scholar
- (2021) The relationship between IVF clinic volume and success rates in SART reporting clinics. Fertility Sterility 116(3):E118.Crossref, Google Scholar
Winfertility (2022) We build and support families. Accessed December 9, 2022, https://www.winfertility.com.Google Scholar- (2022) Informative predictors of pregnancy after first IVF cycle using eIVF practice highway electronic health records. Sci. Rep. 12(1):839.Crossref, Google Scholar
- (2022) Money-back guarantees and service quality: The marketing of in vitro fertilization services. J. Marketing Res. 59(3):659–673.Crossref, Google Scholar