


Immigrants in Finance: Evidence from Hedge Funds
Abstract
We examine the value of skilled immigrants in finance by exploiting evidence from visa lotteries. We find that hedge fund management companies that secure more H-1B visas in random lotteries deliver higher alphas, Sharpe ratios, and information ratios. The superior performance of funds with high H-1B visa allocations can be attributed to well-paid and highly educated H-1B workers with quantitative skills. H-1B workers add value by helping hedge funds develop distinctive investment strategies, arbitrage prominent stock anomalies, and overcome capacity constraints. Hedge funds appear to exploit labor market frictions as alpha generation is greatest by workers from countries with the longest wait times for U.S. permanent residency.
This paper was accepted by Lukas Schmid, finance.
Supplemental Material: The online appendix and data files are available at https://doi.org/10.1287/mnsc.2024.07615.
1. Introduction
Do skilled immigrants add value in finance? Firms in the United States primarily hire skilled immigrant workers by securing H-1B visas.1 Prior studies on H-1B workers investigate their contributions to patenting activity in high-technology firms and find mixed results (Wu 2018, Chen et al. 2021, Dimmock et al. 2022, Doran et al. 2022). Despite the prevalence of immigrant workers in financial firms, such as hedge fund management companies; the importance of financial services to the U.S. economy; and the broader debate over the contribution of skilled immigrants, we know little about the value of immigrant workers in finance.2 Moreover, scant attention is devoted to understanding the mechanisms by which skilled immigrants add value if at all. Even if they do enhance performance, it is not clear why many firms choose to forgo skilled foreign labor. We fill these gaps by analyzing the causal implications of skilled immigrants on hedge fund investment performance via two natural experiments, one based on random H-1B lotteries and the other based on an exogenous regulatory shock to the supply of skilled foreign labor.
The hedge fund industry is an ideal laboratory for studying the value of skilled immigrants in finance. Hedge funds collectively manage a substantial US$5.22 trillion of assets on behalf of investors such as university endowments, pension funds, and charitable foundations.3 The sophisticated and unconstrained investment strategies that hedge funds employ could potentially benefit from the specialized skill sets that H-1B workers bring to the table. Many hedge funds operate systematic strategies and, therefore, are well placed to harness the quantitative abilities that H-1B workers, especially those trained in science, technology, engineering, and mathematics (STEM) subjects, possess. Anecdotal evidence suggests that quantitatively savvy hedge fund firms such as Citadel, Two Sigma Investments, AQR, D.E. Shaw, and Renaissance Technologies routinely apply for H-1B visas to hire highly paid quantitative researchers who develop trading algorithms for systematic strategies.4 In contrast, mutual funds tend to employ investment strategies that rely more on fundamental analysis, whereas banks typically hire employees for their communication, presentation, and financial analysis skills. Therefore, they should benefit less from the quantitative skills of H-1B workers than do hedge funds. Consistent with this view, Figure 1 indicates that, relative to mutual funds and banks, hedge funds rely more on H-1B workers for STEM roles. These foreign workers are precisely those who, according to Kerr (2014), add the most value relative to domestic workers. Finally, given the high level of secrecy and low transparency in the hedge fund industry, hedge funds may be better positioned to exploit and hold up immigrant workers from countries that encounter greater frictions when obtaining U.S. permanent residency (Shen 2021, Gupta 2023), which makes analyzing H-1B workers in hedge funds particularly interesting.
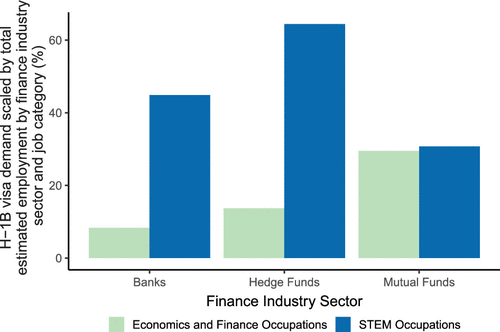
Notes. The numerator for the green (blue) bar is the total number of economics/finance (STEM) H-1B workers demanded by companies annually in the specific financial sector across all labor condition applications. Using Standard Occupational Classification codes, which allow us to decompose H-1B worker demand by job function, we determine the denominator for each green (blue) bar, that is, the total employment of economics/finance (STEM) workers in the specific financial sector annually estimated by the U.S. Bureau of Labor Statistics’ Occupational Employment and Wage Statistics program. The fraction of H-1B workers demanded by finance industry sector and job category is then averaged across the years in the sample period. The sample period is from 2010 to 2016.
To understand the implications of H-1B visa issuance on hedge fund performance, we first analyze the relation between the number of H-1B workers employed and fund performance in a multivariate regression setting. After accounting for the explanatory power of fund characteristics, we find that hedge funds that hire at least one H-1B worker outperform those that eschew H-1B workers by a risk-adjusted 2.16% per annum (t-statistic = 2.86). Moreover, funds that hire more H-1B workers outpace those that hire fewer H-1B workers.
Next, to cater for the endogeneity of a hedge fund management company’s decision to hire H-1B workers, we turn to our first natural experiment, which exploits random variation in a hedge fund firm’s probability of winning H-1B visa lotteries. The U.S. Citizenship and Immigration Services (USCIS) uses random large-scale lotteries to distribute H-1B visas to petitioners, that is, the companies that request visas, whenever the annual demand for H-1B visas exceeds the annual visa cap.5 The random variation in the likelihood that hedge fund firms secure H-1B visas, generated via the lotteries, allows us to shed light on the causal effect of visa issuance on fund performance. If highly skilled foreign workers add value to hedge funds, we should observe that hedge funds operated by firms that secure a greater proportion of their visas demanded via lotteries outperform hedge funds operated by firms that secure a smaller proportion of their visas demanded via lotteries.
This is precisely what we find. Within the sample of hedge fund firms that apply for H-1B visas, a one standard deviation or 42.7 percentage point increase in the likelihood of winning an H-1B visa lottery is associated with 1.46% per annum (t-statistic = 2.16) and 2.09% per annum (t-statistic = 2.48) increases in fund return and alpha, respectively.6 Furthermore, funds operated by fund management companies that secure a greater proportion of their H-1B visas demanded exhibit higher Sharpe ratios, information ratios, Goetzmann et al. (2007) manipulation proof performance measures (MPPMs), and Berk and van Binsbergen (2015) value-added skill.
To provide further insights into the economic significance of our findings, we sort hedge funds into five portfolios based on their visa lottery win rates during lottery years. We find that the equal-weighted portfolio of hedge funds with the highest lottery win rates outperforms the equal-weighted portfolio of hedge funds with the lowest lottery win rates by 3.28% per annum (t-statistic = 2.13) after adjusting for risk. Moreover, hedge funds with the highest lottery win rates in the prior year earn a risk-adjusted return of 4.37% per annum (t-statistic = 2.26). The results are qualitatively similar when we consider value-weighted hedge fund portfolios. In addition, hedge funds that were allocated more H-1B visas via lotteries display superior stock-selection skill. Relative to hedge funds with the lowest lottery win rates, those with the highest lottery win rates purchase stocks that deliver raw returns; Daniel, Grinblatt, Titman, and Wermers (DGTW)–adjusted returns (Daniel et al. 1997); and Carhart (1997) four-factor alphas that exceed those of the stocks that they sell by 2.65%, 2.05%, and 2.63% per annum, respectively.
To complement the results from the first natural experiment, we leverage a second natural experiment that exploits the reduction in the annual H-1B visa quota beginning in 2004. Prior to 2004, the yearly demand for H-1B visas did not exceed the annual visa quota. Moreover, the upward trend in the quota cap over the years led many experts in early 2003 to believe that Congress “will either keep the cap high or eliminate it altogether” (Overby 2003, p. 90). Nevertheless, the U.S. Congress and President George W. Bush reduced the annual visa cap by two thirds from 195,000 in 2003 to 65,000 in 2004. We posit that the sharp reduction in H-1B visa quota undermines the performance of hedge funds that were reliant on skilled foreign workers more than it impairs the performance of hedge funds that relied exclusively on domestic workers.
To test, we categorize a hedge fund as H-1B dependent if it employed H-1B workers prior to 2004 and as non–H-1B dependent otherwise and estimate a difference-in-differences model. We find that, relative to comparable non-H-1B dependent funds, H-1B dependent funds experienced 3.00% and 5.46% per annum decreases in fund return and alpha, respectively, following the 2004 H-1B visa quota cut. Compared with similar non-H-1B dependent funds, H-1B dependent funds also generated lower Sharpe ratios, information ratios, MPPMs, and Berk and van Binsbergen (2015) value-added skill measures following the quota cut. These results corroborate the evidence from our first natural experiment. An advantage of the second natural experiment is that, unlike the first natural experiment, which only focuses on the sample of funds whose firms apply for H-1B visas, the second experiment allows us to compare funds whose firms apply for visas with funds whose firms do not apply for visas.7
What drives the superior performance of hedge funds that successfully hire H-1B workers? We shed light on the underlying mechanisms by investigating the nature of the valuable skills that they possess. Motivated by anecdotal evidence that suggests hedge funds often offer high salaries to foreigners who attended mathematically intensive U.S. postgraduate programs, we posit that H-1B workers enhance investment performance by leveraging their exceptional, specialized, and quantitative skills (Ma 2024).8 Consonant with this view, our results are driven by H-1B workers who draw high salaries and hold postgraduate qualifications. Moreover, we trace our results to H-1B workers employed in STEM positions or at systematic funds, and this suggests that H-1B workers are prized for their quantitative skills.
To further illuminate the underlying mechanisms, we explore how these workers are deployed at hedge funds. First, insofar as H-1B workers possess specialized skills, we hypothesize that they should be well placed to develop distinctive strategies, which according to Titman and Tiu (2011) and Sun et al. (2012), tend to outperform. We find that, consistent with the notion that H-1B workers help hedge funds craft distinctive strategies relative to comparable funds that secure none of their visas requested and to the prelottery period, funds that secure at least one of their visas requested increase the distinctiveness of their strategies by 0.15 to 0.24 standard deviations postlottery.
Second, we posit that the specialized skills of H-1B workers allow hedge funds to exploit new investment opportunities and alleviate fund-level capacity constraints (Berk and Green 2004, Getmansky 2012). In line with this view, relative to comparable funds that secure none of their visas demanded and to the prelottery period, funds that secure at least one of their visas demanded arbitrage 40%–55% more prominent stock anomalies (Stambaugh et al. 2012). In addition, they enhance the scalability of their returns and alphas in the postlottery period by 0.24 and 0.13 standard deviations, respectively, thereby allowing them to overcome capacity constraints.
Third, we postulate that hedge funds enhance alpha production via H-1B workers by exploiting labor market frictions. Consistent with this view, H-1B workers enhance fund alpha more when they are employed by funds with immigrant managers who originate from the same region. Such managers should be better positioned to identify, attract, and retain high-quality immigrant workers, possibly through cultural proximity, shared social networks, and homophily (McPherson et al. 2001, Cohen et al. 2008). Consistent with the findings of Shen (2021) and Gupta (2023) and the view that hedge funds can exploit and hold up workers who face greater labor market frictions, H-1B workers from countries that face longer waiting times for U.S. Green Cards also generate more value for hedge funds as they are less mobile than other H-1B workers.
Despite the investment benefits of the specialized skills possessed by foreign workers, during our sample period, only 13.5% of hedge funds that manage 28.4% of hedge fund assets hire H-1B workers in any given year. We find that fund management teams that are racially or ethnically homogenous are less likely to hire H-1B workers, who typically originate from Asia. One standard deviation decreases in racial diversity and country-of-origin diversity are associated with meaningful 1.14% and 1.84% reductions in the probability of hiring H-1B workers, respectively. Additionally, fund management teams that are predominantly white or that originate from North America hire fewer H-1B workers. These results suggest that some hedge fund firms shun H-1B workers because of racial and ethnic homophily, which may not be entirely irrational given our aforementioned findings on how immigrant managers can identify, attract, and retain high-quality immigrant workers.
The public discourse on and backlash against immigration in the United States tend to be predicated on a simple zero-sum or us-versus-them view.9 Our results provide a more nuanced and potentially win–win interpretation. They indicate that, whereas hedge funds that secure more H-1B workers make fewer job postings for domestic STEM workers, they also make more job postings for domestic workers with complementary skills in areas other than economics, finance, and STEM as the entry of immigrant workers presumably allows hedge funds to scale up their operations across the board. Indeed, we find that the aggregate demand for H-1B workers is strongly and negatively correlated with the U.S. unemployment rate, which indicates that skilled foreign labor may be less harmful to domestic labor than what public discourse suggests.
Finally, to gauge external validity, we rerun our baseline tests on all actively managed U.S. equity mutual funds. We expect to find directionally similar but weaker results given mutual funds’ lower reliance on STEM H-1B workers, whom we show drive more of the alpha creation at hedge funds than do other H-1B workers. Consistent with this view, an increase in the likelihood of winning the H-1B lottery at mutual funds precipitates a statistically significant increase in Fama and French (1993) three-factor alpha and a positive but statistically insignificant change in Carhart (1997) four-factor alpha. In line with the findings on STEM H-1B workers at hedge funds, we obtain stronger results when the majority of H-1B visas demanded by the mutual fund firm are slated for STEM positions.
This study resonates with the nascent but growing literature that examines the implications of skilled foreigners for firm performance but finds mixed results. On one hand, Wu (2018) and Doran et al. (2022) show, using small-scale H-1B visa lotteries, that skilled foreign labor crowds out local workers and has insignificant implications for firm patenting activity. On the other hand, Chen et al. (2021) find, via large-scale H-1B visa lotteries and the 2004 reduction in visa quota, that foreign labor improves financial performance and innovation at venture capital–backed start-up firms. Similarly, Dimmock et al. (2022) show, using large-scale H-1B visa lotteries, that, for start-up firms at least, skilled foreign workers drive better financial outcomes and greater innovation. Our study complements Chen et al. (2021) and Dimmock et al. (2022) by showing that the benefits of skilled foreign labor extend beyond companies in the technology arena.10 Our results indicate that skilled immigrants can also bolster the risk-adjusted returns of established investment management firms. Unlike these papers, our work sheds considerable light on the mechanisms through which skilled immigrant workers add value as well as the underlying reasons why many firms shun such workers.
Other recent and notable work on skilled immigrant workers include Shen (2021), who shows that firms are better able to extract rents from immobile H-1B workers, and Xu (2025), who finds that firms invest more following the resolution of the uncertainty induced by H-1B visa lotteries. Unlike Xu (2025), who focuses on the second moment effects, we shed light on the first moment implications of H-1B workers on firm performance. Shen (2021) investigates the implications of H-1B workers on firm performance conditional on the presence of significant labor market frictions. Unlike Shen (2021), we primarily explore the unconditional effects of H-1B workers on firm performance although we also find that labor market frictions enhance value extraction. Additionally, our study adds to the broader literature on how labor market conditions affect firm decisions and performance. See Nishesh et al. (2024) for a survey.
Our findings also contribute to the literature on how hedge funds generate alpha. Research shows that hedge funds deliver alpha by leveraging on information acquired from the syndicated loan market (Massoud et al. 2011), connections to lobbyists (Gao and Huang 2016), publicly available information disclosures such as form 10-K/Q and form 4 (Crane et al. 2023), and satellite imagery (Katona et al. 2025).11 We add to these perspectives by showing that hedge funds also enhance alpha by exploiting the specialized quantitative skills of H-1B workers, and this can, in turn, help hedge funds overcome capacity constraints and engage in more distinctive investment strategies.
The findings in this paper have clear implications for U.S. labor and immigration policy. They suggest that increasing the supply of H-1B visas, especially advanced-degree visas, engenders value creation in finance. However, financial firms do not benefit equally from that value creation. Those that rely more on quantitative skills, contend with capacity issues, or exploit labor market frictions stand to gain more from an increased supply of skilled immigrants.
2. Data and Methodology
2.1. Background on the H-1B Visa Program and H-1B Data
The Immigration Act of 1990, a reform of the Immigration and Nationality Act of 1965, created the H-1B skilled worker visa program. The H-1B program allows U.S. employers to temporarily hire foreign workers in occupations that require specialized knowledge and a bachelor’s degree or higher. The program has been the primary conduit through which U.S. employers access skilled foreign workers.
An H-1B visa is valid for three years, extendable to six years. The H-1B visa holder must remain employed by the visa holder’s employer to stay in H-1B status. If the employment ends for any reason, the visa holder must leave the United States unless the visa holder finds another employer compatible with the H-1B status or is granted a change of status (e.g., a permanent residency status).
The Immigration Act of 1990 set an annual quota of 65,000 H-1B visas. The quota was increased to 115,000 for 1999 and 2000 under the American Competitiveness and Workforce Improvement Act of 1998 and further to 195,000 for 2001–2003 under the American Competitiveness in the 21st Century Act of 2000. Both acts were signed by President Bill Clinton. However, the quota was dialed back to 65,000 under the H-1B Visa Reform Act of 2004 by President George W. Bush. The quota cut was partially offset in 2006 by the creation of the 20,000 “advanced degree exemption” H-1B visas, which are reserved for foreign workers with a master’s degree or higher from a U.S. institution. The quota—65,000 regular visas and 20,000 advanced degrees visas—has not changed since 2006.
The application process for an H-1B visa begins when an employer decides to sponsor a foreign worker. Before submitting the actual H-1B petition, the employer must first obtain certification of a Labor Condition Application (LCA) from the U.S. Department of Labor. The employer can file one LCA for multiple foreign workers as long as they perform the same job function (e.g., software engineer). The LCA ensures that the employment terms, including wages and working conditions, comply with regulations and do not adversely affect U.S. workers. It must be approved before the employer can proceed with the H-1B petition.
Once the LCA is approved, the employer files form I-129 with USCIS. If the number of H-1B petitions exceeds the annual cap—65,000 for regular applicants and 20,000 for those with U.S. advanced degrees—USCIS conducts large-scale random lotteries to determine which petitions are processed. Selected applications move forward, whereas unselected ones are returned. Prior to policy changes implemented during the first Trump administration, the filing period began on the first business day of April and remained open for at least five business days. If a petition was approved, the earliest employment start date was October 1 of that year.
During our sample period, if the annual quota is reached within the first five business days in April, the USCIS conducted two sequential lotteries that year. The first lottery allocates the 20,000 advanced degrees H-1B visas to advanced degrees petitioners in the lottery pool. The second lottery assigns the 65,000 regular H-1B visas to the remaining petitioners in the lottery pool (including the advanced degrees petitioners who lost the first lottery). The annual H-1B quota was reached within five days for fiscal years 2008, 2009, and 2014–2016. For example, the USCIS received more than 150,000 I-129 petitions on April 1, 2008, the first day it started accepting petitions for fiscal year 2009. Considering the strong demand, the USCIS announced on April 8 that it would process only petitions submitted between April 1 and April 7 (inclusive). The USCIS conducted lotteries on April 14 to allocate the 85,000 H-1B visas to these petitions.
We obtained about 5.5 million processed I-129 petitions over the 1999–2016 period through a Freedom of Information Act request on June 30, 2016. Unprocessed petitions, which are returned to the employer, are not in the data set.12 The I-129 petition data include the receipt date, employer name and address, job code, job definition, and limited information on the petitioning foreign worker (the beneficiary), including the worker’s country of birth and current visa class.
Our empirical analysis also requires the LCA data over the 2001–2016 period, which we retrieve from the websites of the Foreign Labor Certification Data Center and the Department of Labor. LCA data are unavailable before 2001. We do not use LCAs after 2016 because our sample of I-129 petitions ends in 2016.
Throughout the paper, we measure variables by U.S. government fiscal year instead of calendar year to align the empirical analysis with the LCA and USCIS data and refer to the fiscal year as “year.” The U.S. fiscal year starts on October 1 and ends on September 30. For example, fiscal year 2016 runs from October 1, 2015, to September 30, 2016.
We note that a valid H-1B visa is not the only way for a foreign worker to be employed in the United States. Alternative options, such as optional practical training (OPT) and curricular practical training (CPT), are available to certain immigrants. OPT is a work authorization granted to F-1 students, allowing them to work in their field of study for up to 12 months with an additional 24-month extension for those with qualifying STEM degrees. Students may use OPT before or after graduation but must apply for and receive an employment authorization document from the USCIS before beginning work. CPT, on the other hand, is a work authorization for F-1 students that enables them to gain practical experience related to their field of study when enrolled in their academic program (e.g., internships). Unlike OPT, CPT must be an integral part of the student’s curriculum and requires formal authorization from the designated school official along with an employment offer before approval. CPT can be full or part time, but students who engage in full-time CPT for 12 months or more become ineligible for OPT. Whereas OPT and CPT provide temporary work authorization, they do not serve as long-term employment visas such as the H-1B.
2.2. Hedge Fund Data
We study the relation between H-1B visa issuance and hedge fund performance using monthly net-of-fee returns and assets under management (AUM) data of live and dead hedge funds that report returns in U.S. dollars to the Lipper TASS, Morningstar, and Hedge Fund Research (HFR) commercial databases from October 2000 to September 2016.13 We focus on data from October 2000 to September 2016 because the data on LCAs start in fiscal year 2001 and the I-129 data on H-1B visa issuance end in fiscal year 2016.
In our fund universe, we have a total of 13,953 hedge funds comprising 3,085 live funds and 10,868 dead funds. In view of concerns that funds with multiple share classes could cloud the analysis, we exclude duplicate share classes from the sample. This leaves a total of 13,353 hedge funds, of which 2,923 are live funds and 10,430 are dead funds. Whereas 1,265 funds appear in multiple databases, many funds belong to only one database. Specifically, there are 2,808, 2,006, and 7,274 funds that appear only in the Lipper TASS, Morningstar, and HFR databases, respectively, highlighting the advantage of collecting hedge fund data from multiple databases.14
Following Agarwal et al. (2009), we classify funds into four broad investment styles: security selection, multiprocess, directional trader, and relative value. Security selection funds take long and short positions in undervalued and overvalued securities, respectively. They typically take positions in equity markets. Multiprocess funds engage in multiple strategies that take advantage of significant events, such as spin-offs, mergers and acquisitions, bankruptcy reorganizations, recapitalizations, and share buybacks. Directional trader funds bet on the direction of market prices of currencies, commodities, equities, and bonds in the futures and cash markets. Relative value funds exploit opportunities embedded in spread relations between prices of financial assets, minimizing market exposure.
Because hedge funds are not required to list on commercial databases, hedge fund data are susceptible to self-selection biases. For example, hedge funds often include returns prior to fund listing dates onto the databases. Because funds that have good track records are more likely to list on databases so as to attract investment capital, the backfilled returns tend to be higher than nonbackfilled returns, and this leads to a backfill bias (Liang 2000, Fung and Hsieh 2009, Bhardwaj et al. 2014). To alleviate backfill bias, throughout this paper, we study hedge fund returns reported post fund database listing date. For funds from databases that do not provide listing date information, we rely on the Jorion and Schwarz (2019) algorithm to infer fund database listing dates.
We estimate hedge fund performance relative to the Fung and Hsieh (2004) seven factors. These factors are S&P 500 return minus the risk-free rate (SNPMRF), Russell 2000 return minus the S&P 500 return (SCMLC), change in the constant maturity yield of the 10-year U.S. Treasury bond appropriately adjusted for the duration (BD10RET), change in the spread of Moody’s BAA bond over 10-year Treasury bond appropriately adjusted for duration (BAAMTSY), bond primitive trend following strategy (PTFS) (PTFSBD), currency PTFS (PTFSFX), and commodity PTFS (PTFSCOM). Fung and Hsieh (2004) show that their model captures a significant 84% of the variation in hedge fund index returns.
We match the hedge funds in our sample to the H-1B visa application data via fund management company name. Of the 6,959 hedge fund firms managing 13,353 hedge funds in our sample, 1,563 hedge fund firms operating 3,865 hedge funds received H-1B visas (both capped and noncapped) during our sample period. Table 1 presents fund- and firm-level summary statistics from the two natural experiments: (a) large-scale H-1B visa lotteries and (b) the 2004 reduction in H-1B visa cap.
|

Table 1. Summary Statistics
| Panel A: Fund-level summary statistics from the first natural experiment (H-1B visa lotteries) | ||||||||
|---|---|---|---|---|---|---|---|---|
| Fund attributes | Number of fund-month observations | Mean | Standard deviation | 5th percentile | 25th percentile | 50th percentile | 75th percentile | 95th percentile |
| Number of H-1B visas granted | 15,707 | 4.044 | 11.381 | 0.000 | 0.000 | 1.000 | 2.000 | 27.000 |
| Number of H-1B visas demanded | 15,707 | 7.272 | 15.273 | 1.000 | 1.000 | 1.000 | 3.000 | 61.000 |
| Percentage of H-1B demand met | 15,707 | 0.568 | 0.427 | 0.000 | 0.000 | 0.667 | 1.000 | 1.000 |
| AUM, US$billion | 15,707 | 0.554 | 1.202 | 0.006 | 0.044 | 0.148 | 0.462 | 2.568 |
| Age, years | 15,707 | 8.339 | 5.113 | 2.500 | 4.417 | 7.000 | 11.000 | 19.417 |
| Monthly return, % | 15,707 | 0.041 | 3.948 | −6.377 | −1.310 | 0.270 | 1.570 | 5.630 |
| Monthly alpha, % | 15,707 | 0.004 | 4.224 | −5.910 | −1.517 | 0.100 | 1.457 | 6.036 |
| Panel B: Firm-level summary statistics from the first natural experiment (H-1B visa lotteries) | |||||
|---|---|---|---|---|---|
| Year | Number of firms demanding H-1B visas | Number of funds managed | Number of H-1B visas demanded | Number of H-1B visas granted | Percentage of H-1B demand met |
| 2008 | 168 | 1.89 | 9.10 | 4.95 | 0.55 |
| 2009 | 161 | 2.27 | 7.52 | 2.51 | 0.57 |
| 2014 | 126 | 2.30 | 8.79 | 2.58 | 0.66 |
| 2015 | 137 | 2.15 | 6.06 | 2.59 | 0.64 |
| 2016 | 121 | 2.00 | 7.50 | 2.99 | 0.44 |
| Average | 142.60 | 2.12 | 7.79 | 3.12 | 0.57 |
| Panel C: Firm-level summary statistics on job types from the first natural experiment (H-1B visa lotteries) | ||||||||
|---|---|---|---|---|---|---|---|---|
| Proportion of H-1B visas granted by job classification | Number of firm-year observations | Mean | Standard deviation | 5th percentile | 25th percentile | 50th percentile | 75th percentile | 95th percentile |
| H-1B visas granted for STEM jobs | 603 | 0.287 | 0.365 | 0.000 | 0.000 | 0.000 | 0.500 | 1.000 |
| H-1B visas granted for econ/finance jobs | 603 | 0.278 | 0.386 | 0.000 | 0.000 | 0.000 | 0.500 | 1.000 |
| H-1B visas granted for administrative jobs | 603 | 0.316 | 0.399 | 0.000 | 0.000 | 0.045 | 0.571 | 1.000 |
| H-1B visas granted for other jobs | 603 | 0.119 | 0.276 | 0.000 | 0.000 | 0.000 | 0.000 | 1.000 |
| Panel D: Fund-level summary statistics from the second natural experiment (2004 reduction in H-1B visa cap) | ||||||||
|---|---|---|---|---|---|---|---|---|
| Fund attributes | Number of fund-month observations | Mean | Standard deviation | 5th percentile | 25th percentile | 50th percentile | 75th percentile | 95th percentile |
| Hired H-1B workers before 2004 | 126,698 | 0.174 | 0.379 | 0.000 | 0.000 | 0.000 | 0.000 | 1.000 |
| Year equals to or exceeds 2004 | 126,698 | 0.624 | 0.484 | 0.000 | 0.000 | 1.000 | 1.000 | 1.000 |
| AUM, US$billion | 126,698 | 0.148 | 0.408 | 0.002 | 0.013 | 0.041 | 0.126 | 0.627 |
| Age, years | 126,698 | 6.784 | 4.070 | 2.250 | 3.583 | 5.750 | 9.000 | 14.917 |
| Monthly return, % | 126,698 | 0.537 | 3.693 | −5.050 | −0.684 | 0.560 | 1.780 | 5.970 |
| Monthly alpha, % | 126,698 | 0.199 | 4.045 | −5.272 | −1.067 | 0.218 | 1.449 | 5.564 |
Notes. This table reports summary statistics from two natural experiments. The first natural experiment exploits random variation in hedge fund firm’s probability of winning H-1B visa lotteries. The USCIS has used random lotteries to distribute H-1B visas to petitioners, that is, the companies that request for visas, whenever the annual demand for H-1B visas exceeds the annual visa cap. During our sample period, all cap-subject H-1B visas were allocated via lotteries in 2008, 2009, and 2014–2016. The second natural experiment exploits the reduction in the annual H-1B visa quota beginning in 2004 and its implications on hedge fund firms that were dependent on H-1B workers. Prior to 2004, the yearly demand for H-1B visas did not exceed the annual visa quota. However in 2003, the annual visa cap was reduced by two thirds from 195,000 in 2003 to 65,000 in 2004. AUM is fund assets under management. Alpha is Fung and Hsieh (2004) alpha in which factor loadings are estimated over the prior 24 months. Note that H-1B visa demand is specific to the hedge fund firm. Panel A reports statistics that are averaged across funds on the visas demanded by the firms that operate the funds in the sample. The sample period for the first natural experiment comprises the following fiscal years 2008, 2009, and 2014–2016. The sample period for the second natural experiment is from 2001 to 2006.
We measure a hedge fund’s demand for and supply of cap-subject H-1B visas using its fund management company’s LCA filings and approved I-129 petitions, respectively, and compute the fraction of its H-1B visa demand met as the ratio of cap-subject H-1B visas approved relative to cap-subject H-1B visas demanded. Panel A of Table 1 indicates that, during the five H-1B visa lottery years within our sample period, that is, 2008, 2009, and 2014–2016, the average hedge fund demanded via its fund management company 7.27 cap-subject visas, of which 4.04 visas were approved. On average, only 56.8% of H-1B visa demand was met. Note that, because many hedge funds get a fraction of their visas approved and the mean of fractions differs from the fraction of means, the average H-1B visa demand met does not necessarily equal the ratio of the average number of visas approved over the average number of visas demanded.
There is significant variation across funds in the proportion of H-1B visa demand met. The standard deviation of the proportion of H-1B visa demand met is 0.427. For the average lottery year, 41.31% of funds are operated by firms that had all of their visa applications approved, whereas 29.52% of funds are associated with firms that had all of their visa applications rejected. The remaining 29.17% of funds are managed by firms that had a fraction of their visa applications approved. The average hedge fund in our lottery sample managed US$554 million, was conceived 8.34 years ago, and generated a monthly return and Fung and Hsieh (2004) alpha of 4.1 basis points and 0.4 basis points, respectively. Panel B shows that, for the average lottery year, 142.6 hedge fund management companies applied for H-1B cap-subject visas. Each firm operated, on average, 2.12 hedge funds and applied for 7.79 visas, of which 3.12 visas were approved. Panel C indicates that 28.7% of visas were granted for STEM jobs, 27.8% of visas were allocated for econ/finance jobs, and 31.6% of visas were awarded for administrative jobs.
Panel D reveals that, on average, 17.4% of the hedge funds in our visa cap reduction sample were dependent on H-1B workers before 2004. The visa cap reduction sample includes funds operated by firms that did not apply for H-1B visas as well as funds managed by firms that applied for H-1B visas during the nonlottery years. Therefore, it is substantially larger than the visa lottery sample. It includes smaller and younger hedge funds managing, on average, US$148 million and that were launched on average 6.78 years ago. In line with the view that hedge funds are affected by capacity constraints (Berk and Green 2004, Getmansky 2012), these smaller funds deliver higher monthly returns and alphas of 53.7 basis points and 19.9 basis points, respectively. The higher AUM of the funds in the visa lottery sample suggests that larger funds are more likely to apply for H-1B visas.
To test whether the fraction of H-1B visa demand met via the visa lotteries is indeed random, we regress the fraction of the hedge fund firm’s H-1B visa demand met on firm characteristics such as past firm performance, past firm strategy performance, the fraction of H-1B workers that the firm wants to hire that have postgraduate degrees, firm age, the natural logarithm of firm AUM, number of funds managed, and number of distinct strategies employed. We include firm strategy performance as one of the independent variables to address concerns that lottery outcomes could be correlated with strategy-specific macroeconomic condition–driven alphas. The statistically insignificant coefficient estimates on these firm characteristics reported in Online Table IA2 suggest that the probability of securing H-1B visas is not biased toward any particular firm characteristic (Wooldridge 2010).
3. Empirical Results
3.1. Performance of Hedge Funds That Employ H-1B Workers
First, we assess the performance differences between hedge funds managed by firms that employ H-1B workers and hedge funds managed by firms that forgo H-1B workers by estimating the following multivariate ordinary least squares regression:
Columns (1) and (2) of Table 2 indicate that hedge funds that hire H-1B workers outperform hedge funds that do not hire H-1B workers by 1.94% per annum (t-statistic = 3.06) before adjusting for risk and by 2.16% per annum (t-statistic = 2.86) after adjusting for risk. When we replace HIRED_H1B with the percentile rank for the number of H-1B workers hired in the previous year (NUMBER_H1B_RANK) in the regression, we obtain qualitatively similar results. Columns (3) and (4) of Table 2 suggest that hedge funds managed by firms that hire more H-1B workers outpace hedge funds managed by firms that hire fewer H-1B workers.
|
Table 2. Regressions on Hedge Fund Performance
| RETURN | ALPHA | RETURN | ALPHA | RETURN | ALPHA | |
|---|---|---|---|---|---|---|
| Independent variable | (1) | (2) | (3) | (4) | (5) | (6) |
| HIRED_H1B | 0.162*** | 0.180*** | 0.161*** | 0.179*** | ||
| (0.053) | (0.063) | (0.053) | (0.063) | |||
| NUMBER_H1B_RANK | 0.170*** | 0.185*** | ||||
| (0.056) | (0.067) | |||||
| UNSUCCESSFUL_H1B | −0.034 | −0.068 | ||||
| (0.056) | (0.068) | |||||
| DEMAND_H1B_RANK | −0.093* | −0.101 | −0.093* | −0.099 | −0.091* | −0.097 |
| (0.053) | (0.062) | (0.053) | (0.062) | (0.053) | (0.061) | |
| log(SIZE) | −0.437*** | −0.385*** | −0.437*** | −0.385*** | −0.437*** | −0.385*** |
| (0.017) | (0.019) | (0.017) | (0.019) | (0.017) | (0.019) | |
| AGE | 0.142 | 0.222 | 0.142 | 0.222 | 0.143 | 0.224 |
| (0.343) | (0.302) | (0.343) | (0.302) | (0.343) | (0.302) | |
| F-test: HIRED_H1B − UNSUCCESSFUL_H1B = 0 | 5.79** | 5.89** | ||||
| Fund fixed effects | Yes | Yes | Yes | Yes | Yes | Yes |
| Year-month fixed effects | Yes | Yes | Yes | Yes | Yes | Yes |
| Adjusted R2 | 0.211 | 0.079 | 0.211 | 0.079 | 0.211 | 0.079 |
| Observations | 443,103 | 443,103 | 443,103 | 443,103 | 443,103 | 443,103 |
Notes. This table reports multivariate OLS regressions on hedge fund performance. The dependent variables include hedge fund monthly return (RETURN) and monthly alpha (ALPHA), for which monthly alpha is the Fung and Hsieh (2004) seven-factor monthly alpha with factor loadings estimated over the last 24 months. The primary independent variables of interest are (a) an indicator variable for whether the fund management company hired at least one H-1B worker in the previous year (HIRED_H1B), (b) the percentile rank for the number of H-1B workers hired in the previous year (NUMBER_H1B_RANK), and (c) an indicator variable for whether the fund management company applied but did not successfully hire any H-1B worker in the previous year (UNSUCCESSFUL_H1B). The other independent variables include the percentile rank for the number of H-1B visa applications submitted by the fund management company DEMAND_H1B_RANK, the natural logarithm of last month’s fund AUM in US$m (log(SIZE)), and fund age in decades (AGE) as well as fixed effects for fund and year-month. Detailed variable definitions can also be found in Online Table IA1. Standard errors in parentheses are clustered by firm. The sample period is from January 2001 to December 2016.
***, **, and * denote statistical significance at the 1%, 5%, and 10% levels, respectively.
The aforementioned findings are susceptible to concerns that there may be unobservable factors that simultaneously explain both hedge fund firms’ decision to hire H-1B workers and the investment performance of the hedge funds that they manage. For example, a hedge fund that is anticipating superior future performance can more easily justify the hiring of H-1B workers to satisfy its fund founder’s nonpecuniary preference for hiring foreigners.
As a first step toward distinguishing between selection and treatment effects, we include UNSUCCESSFUL_H1B, an indicator variable that takes a value of one if the firm applied for but was not successful in getting visas to hire H-1B workers as an additional independent variable in the regression. The coefficient estimates reported in columns (5) and (6) of Table 2 suggest that hedge funds managed by firms that tried to but were unsuccessful in obtaining H-1B visas did not outperform other hedge funds. Therefore, it is the treatment effect stemming from the actual hiring of H-1B workers and not the selection effect associated with visa applications that drives the improvement in fund performance.
3.2. The First Natural Experiment: H-1B Visa Lotteries
To further cater to the endogeneity of hedge fund firms’ decision to hire (or not hire) H-1B workers, we turn to our first natural experiment. If H-1B workers engender better investment performance, we expect that hedge funds managed by firms that were randomly allocated, via the lotteries, a greater proportion of their H-1B visas demanded generate superior returns. To test, we estimate the following multivariate ordinary least squares regression:
The coefficient estimates on H1B reported in columns (1) and (2) of Table 3 indicate that hedge funds managed by fund management companies that are allocated a greater proportion of their H-1B visa demand outperform those managed by fund management companies that are allocated a smaller proportion of their H-1B visa demand. A one standard deviation (or 42.7 percentage point) increase in the proportion of H-1B visas issued via lotteries engender 1.46% per annum (t-statistic = 2.15) and 2.09% per annum (t-statistic = 2.48) increases in fund return and alpha, respectively.
|
Table 3. The First Natural Experiment: H-1B Visa Lotteries
| RETURN | ALPHA | SHARPE | INFORMATION | MPPM | VALUEADD | |
|---|---|---|---|---|---|---|
| Independent variable | (1) | (2) | (3) | (4) | (5) | (6) |
| H1B | 0.285** | 0.407** | 0.494** | 0.593*** | 3.705** | 5.203** |
| (0.132) | (0.164) | (0.192) | (0.198) | (1.874) | (2.543) | |
| log(SIZE) | −0.891*** | −0.559*** | −0.576*** | 0.179 | −7.408*** | −2.812 |
| (0.110) | (0.092) | (0.105) | (0.225) | (1.285) | (3.066) | |
| AGE | −0.728 | 1.616 | 4.993*** | 1.158 | 25.961 | 13.257 |
| (4.863) | (5.529) | (1.385) | (1.461) | (22.741) | (28.487) | |
| Fund fixed effects | Yes | Yes | Yes | Yes | Yes | Yes |
| Year-month fixed effects | Yes | Yes | No | No | No | Yes |
| Year fixed effects | No | No | Yes | Yes | Yes | No |
| Adjusted R2 | 0.267 | 0.138 | 0.409 | 0.247 | 0.430 | 0.250 |
| Observations | 15,707 | 15,707 | 1,485 | 1,485 | 1,485 | 3,289 |
Notes. This table reports multivariate OLS regressions on hedge fund performance. The dependent variables include hedge fund monthly return (RETURN), monthly alpha (ALPHA), annualized Sharpe ratio (SHARPE), annualized information ratio (INFORMATION), manipulation-proof performance measure (MPPM), and value-added skill (VALUEADD). ALPHA is the Fung and Hsieh (2004) seven-factor monthly alpha with factor loadings estimated over the last 24 months. SHARPE, INFORMATION, and MPPM are estimated each fiscal year. SHARPE is the average monthly return minus the risk-free rate divided by the standard deviation of the monthly returns during that fiscal year. INFORMATION is the average of the monthly Fung and Hsieh (2004) residuals divided by the standard deviation of the monthly residuals during that fiscal year. MPPM is computed as per Goetzmann et al. (2007) with risk-aversion parameter . VALUEADD is the monthly gross fund excess return multiplied by the prior month’s fund assets under management as per Berk and van Binsbergen (2015). The primary independent variable of interest is the fraction of the fund management company’s demand for cap-subject H-1B visas that is met (H1B). The other independent variables include the natural logarithm of last month’s fund AUM in US$m (log(SIZE)) and fund age in decades (AGE) as well as fixed effects for fund. Detailed variable definitions can also be found in Online Table IA1. The regressions on fund return, alpha, and skill include year-month fixed effects, whereas the regressions on Sharpe ratio, information ratio, and MPPM include year fixed effects. Standard errors in parentheses are clustered by firm. The sample period comprises the following fiscal years: 2008, 2009, and 2014–2016.
***, **, and * denote statistical significance at the 1%, 5%, and 10% levels, respectively.
To test whether our findings are robust to alternative performance metrics, we estimate analogous regressions on fund Sharpe ratio (SHARPE), information ratio (INFORMATION), Goetzmann et al. (2007) manipulation-proof performance measure (MPPM), and Berk and van Binsbergen (2015) value-added skill measure (VALUEADD). SHARPE is the average monthly return minus the risk-free rate divided by the standard deviation of the monthly returns during that fiscal year. INFORMATION is the average of the monthly abnormal returns divided by the standard deviation of the abnormal returns during that fiscal year. The MPPM addresses concerns that some hedge funds employ strategies such as writing deep out-of-the-money options to inflate their Sharpe ratios.17 The Berk and van Binsbergen (2015) measure assesses the value add of hedge funds and is defined as the gross monthly fund return multiplied by fund AUM last month. Table 3 shows that our findings are robust to employing these alternative performance measures.
The coefficient estimate on the Berk and van Binsbergen (2015) measure indicates that a one standard deviation (or 42.7 percentage point) increase in the proportion of H-1B demand met via the lottery is associated with a US$2.22 million per month increase in value-added for the fund. Because the average number of H-1B visas demanded each year by a hedge fund management company in the lottery sample is 7.28 and each fund management company operates, on average, 2.13 hedge funds (see panels A and B in Table 1), each additional H-1B worker translates into a total value-added of US$1.52 million per month, which exceeds the average base salary of US$140,234 per annum for H-1B workers in the top 10 percentile of the salary distribution.18 These results are consistent with the view that failing to hire H-1B workers results in a shortage of critical personnel at the fund (e.g., quantitative developers), thereby constraining the productivity of the investment team.19
3.2.1. Robustness.
To gauge robustness, we first estimate Fama and MacBeth (1973) regressions that help address cross-correlation in residuals across funds within each month. Next, we reestimate the regressions with style-adjusted alpha, incubation bias-adjusted alpha, unsmoothed alpha, and alpha from prefee returns. Style-adjusted alpha is the alpha of the difference between fund return and the average return of the funds that belong to the same investment style as the focal fund. Incubation-adjusted alpha is alpha generated after dropping the first 24 months of returns for each fund. To ensure that our findings are not driven by illiquidity-induced serial correlation in fund returns, we generate unsmoothed alpha using the algorithm of Getmansky et al. (2004). To determine prefee returns, we calculate high-watermark and performance fee by matching each capital outflow to the relevant capital inflow, assuming as per Agarwal et al. (2009) that capital leaves the fund on a first-in, first-out basis. To capture nonlinearities in the effects of fund size on fund performance, we include fund decile fixed effects in lieu of the natural logarithm of fund size in the alpha regression. To ensure that our findings are not driven by funds that demand only one H-1B visa, we drop such funds from the sample and reestimate the baseline fund alpha regression. Panel A of Online Table IA3 indicates that our results are robust to these adjustments. In results available on request, we find that the baseline regression results are robust to excluding data from any one of the five lottery years or to excluding CTA/managed futures funds from the sample.
Next, we redo the Equation (2) regressions with fund alphas estimated relative to Fung and Hsieh (2004) models augmented with myriad possible omitted risk factors, including (a) the Fama and French (1993) value factor (HML) and the Carhart (1997) momentum factor (UMD), (b) the Fama and French (2015) profitability and investment factors (RMW and CMA), (c) the Pástor and Stambaugh (2003) traded liquidity factor (PS), (d) the Frazzini and Pedersen (2014) betting against beta factor (BAB), (e) the Bali et al. (2014) macroeconomic uncertainty factor (MACRO), (f) the Agarwal and Naik (2004) out-of-the-money call and put option–based factors (CALL and PUT), and (g) an emerging markets factor derived from the MSCI Emerging Markets index (EM). Panel B of Online Table IA3 indicates that our findings remain robust with these adjustments.
3.2.2. Economic Significance.
To further gauge the economic significance of the H-1B effect, every October 1, we sort hedge funds into five equal-weighted portfolios based on the percentage of H-1B demand met. Portfolios 1 and 5 are the portfolios of hedge funds managed by fund management companies that were allocated all and none of their H-1B visas demanded in the previous fiscal year, respectively. The remaining funds are sorted into the other three portfolios based on their fund management company’s H-1B demand met the previous fiscal year. The H-1B lottery win rates for portfolios 1–5 are 1.00, 0.73, 0.63, 0.38, and 0.00, respectively. The postformation returns on the five portfolios over the next 12 months are linked across the five years (2008, 2009, and 2014–2016) to form a single return series for each portfolio. Next, we evaluate performance relative to the Fung and Hsieh (2004) model and base statistical inferences on White (1980) heteroscedasticity-consistent standard errors.
Panel A of Table 4 indicates that the equal-weighted portfolio of hedge funds that are allocated all of their H-1B visas requested outperforms the equal-weighted portfolio of hedge funds that are allocated none of their H-1B visas requested by 3.28% per annum (t-statistic = 2.13) after adjusting for covariation with the Fung and Hsieh (2004) factors. Moreover, hedge funds that are granted all of their H-1B visas requested earn an economically meaningful return of 4.37% per annum (t-statistic = 2.26) after adjusting for risk. In addition, the portfolio alphas are monotonically decreasing as we go from portfolio 1 to portfolio 5. Panel B of Table 4 reveals that our results are robust to value weighting the portfolios.20
|
Table 4. Portfolio Sorts on Fund Management Company H-1B Visa Lottery Allocations
| Portfolio | Excess return, percent/ month | Alpha, percent/ month | SNPMRF | SCMLC | BD10RET | BAAMTSY | PTFSBD | PTFSFX | PTFSCOM | Adjusted R2 |
|---|---|---|---|---|---|---|---|---|---|---|
| Panel A: Equal-weighted portfolios | ||||||||||
| Portfolio 1 (high H-1B allocation) | 0.340 | 0.364** | 0.188*** | −0.067 | 0.275 | −3.273*** | −0.010 | 0.013 | −0.012 | 0.682 |
| (0.274) | (0.161) | (0.047) | (0.068) | (0.879) | (0.986) | (0.017) | (0.011) | (0.009) | ||
| Portfolio 2 | 0.187 | 0.275 | 0.172*** | −0.018 | 0.888 | −3.570*** | 0.003 | 0.008 | −0.019 | 0.58 |
| (0.316) | (0.206) | (0.055) | (0.099) | (1.077) | (1.103) | (0.021) | (0.012) | (0.017) | ||
| Portfolio 3 | 0.231 | 0.241 | 0.174*** | −0.052 | 0.163 | −2.049*** | −0.004 | −0.002 | 0.003 | 0.572 |
| (0.230) | (0.170) | (0.036) | (0.069) | (0.755) | (0.629) | (0.017) | (0.008) | (0.011) | ||
| Portfolio 4 | 0.122 | 0.131 | 0.182*** | −0.086 | 0.108 | −2.520*** | −0.008 | 0.007 | −0.006 | 0.659 |
| (0.237) | (0.155) | (0.031) | (0.064) | (0.759) | (0.759) | (0.015) | (0.009) | (0.010) | ||
| Portfolio 5 (low H-1B allocation) | 0.060 | 0.092 | 0.161*** | −0.120** | 0.378 | −2.916*** | −0.005 | 0.009 | −0.006 | 0.672 |
| (0.236) | (0.138) | (0.026) | (0.057) | (0.674) | (0.574) | (0.015) | (0.009) | (0.011) | ||
| Spread (1 − 5) | 0.280** | 0.273** | 0.027 | 0.054 | −0.102 | −0.357 | −0.005 | 0.004 | −0.006 | −0.018 |
| (0.128) | (0.128) | (0.047) | (0.044) | (0.668) | (0.782) | (0.013) | (0.007) | (0.008) | ||
| Panel B: Value-weighted portfolios | ||||||||||
| Portfolio 1 (high H-1B allocation) | 0.327 | 0.366*** | 0.135*** | −0.060 | 0.190 | −3.786*** | −0.008 | 0.005 | −0.014 | 0.718 |
| (0.273) | (0.142) | (0.041) | (0.061) | (0.767) | (0.766) | (0.016) | (0.009) | (0.010) | ||
| Portfolio 2 | 0.163 | 0.235 | 0.178*** | 0.000 | 0.784 | −3.261*** | 0.000 | 0.007 | −0.017 | 0.579 |
| (0.308) | (0.200) | (0.050) | (0.095) | (0.971) | (0.915) | (0.020) | (0.011) | (0.018) | ||
| Portfolio 3 | 0.108 | 0.118 | 0.192*** | −0.059 | 0.460 | −1.677*** | −0.007 | −0.007 | 0.005 | 0.518 |
| (0.251) | (0.203) | (0.036) | (0.084) | (0.908) | (0.644) | (0.022) | (0.010) | (0.013) | ||
| Portfolio 4 | 0.100 | 0.111 | 0.149*** | −0.107* | 0.066 | −2.524*** | −0.008 | 0.009 | −0.009 | 0.583 |
| (0.224) | (0.163) | (0.029) | (0.062) | (0.841) | (0.820) | (0.015) | (0.008) | (0.010) | ||
| Portfolio 5 (low H-1B allocation) | 0.011 | 0.011 | 0.169*** | −0.153*** | −0.074 | −2.971*** | −0.010 | 0.008 | −0.004 | 0.692 |
| (0.237) | (0.136) | (0.027) | (0.056) | (0.697) | (0.602) | (0.014) | (0.007) | (0.011) | ||
| Spread (1 − 5) | 0.317** | 0.355*** | −0.033 | 0.093** | 0.264 | −0.815 | 0.002 | −0.003 | −0.011 | 0.108 |
| (0.127) | (0.113) | (0.042) | (0.040) | (0.568) | (0.693) | (0.012) | (0.007) | (0.007) | ||
Notes. Every October 1, hedge funds are sorted into five portfolios based on the percentage of H-1B demand met for their fund management companies. The postformation returns on the five portfolios over the next 12 months are linked across months to form a single return series for each portfolio. Portfolios 1 and 5 are the portfolios of hedge funds managed by fund management companies that were allocated all and none of their H-1B visas demanded in the previous year, respectively. The other funds are sorted into the remaining three portfolios based on their fund management company’s H-1B visa demand met in the previous year. The Fung and Hsieh (2004) factors are Standard & Poor’s (S&P) 500 return minus risk-free rate (SNPMRF), Russell 2000 return minus S&P 500 return (SCMLC), change in the constant maturity yield of the U.S. 10-year Treasury bond appropriately adjusted for the duration of the 10-year bond (BD10RET), change in the spread of Moody’s BAA bond over 10-year Treasury bond appropriately adjusted for duration (BAAMTSY), bond PTFS (PTFSBD), currency PTFS (PTFSFX), and commodities PTFS (PTFSCOM), where PTFS is primitive trend following strategy. White (1980) standard errors are in parentheses. Panel A reports the performance measures for equal-weighted portfolios. Panel B reports the performance measures for value-weighted portfolios. The sample period comprises the following fiscal years: 2008, 2009, and 2014–2016.
***, **, and * denote statistical significance at the 1%, 5%, and 10% levels, respectively.
To test whether the superior performance of hedge funds with high H-1B visa allocations relates to stock selection ability, we adopt a standard calendar time portfolio approach as per Cohen et al. (2008). Specifically, we compare changes in stock holdings of high H-1B allocation hedge funds that secure all their H-1B visas demanded versus those of low H-1B allocation hedge funds that secure none of their H-1B visas demanded. Online Table IA4 indicates that, relative to stocks transacted by low H-1B allocation funds, stocks purchased by high H-1B allocation funds deliver returns, Daniel et al. (1997) DGTW-adjusted returns, and Carhart (1997) four-factor alphas that exceed those of stocks sold by high H-1B allocation funds by 2.65%, 2.05%, and 2.63% per annum, respectively.
3.2.3. Duration and Dynamics of the Treatment Effect.
Next, to understand the duration of the value-enhancing benefits of H-1B workers, we first estimate the following difference-in-differences model:
|
Table 5. Difference-in-Differences Model Based on H-1B Visa Lotteries
| Matching on fund performance | Matching on fund residuals | Matching on propensity score | Matching on firm AUM | |||||
|---|---|---|---|---|---|---|---|---|
| RETURN | ALPHA | RETURN | ALPHA | RETURN | ALPHA | RETURN | ALPHA | |
| Independent variable | (1) | (2) | (3) | (4) | (5) | (6) | (7) | (8) |
| TREATMENT × POST_LOTTERY | 0.128** | 0.121** | 0.137** | 0.117** | 0.162** | 0.185** | 0.123* | 0.153** |
| (0.059) | (0.057) | (0.063) | (0.058) | (0.077) | (0.090) | (0.070) | (0.070) | |
| log(SIZE) | −0.330*** | −0.271*** | −0.343*** | −0.294*** | −0.403*** | −0.351*** | −0.422*** | −0.286*** |
| (0.036) | (0.035) | (0.034) | (0.034) | (0.049) | (0.053) | (0.049) | (0.042) | |
| AGE | −0.408 | −1.350 | −0.791* | −2.727*** | 0.827 | 0.129 | 0.173 | −0.947 |
| (0.474) | (1.058) | (0.422) | (0.696) | (0.695) | (0.433) | (1.033) | (0.911) | |
| Event fixed effects | Yes | Yes | Yes | Yes | Yes | Yes | Yes | Yes |
| Event-month fixed effects | Yes | Yes | Yes | Yes | Yes | Yes | Yes | Yes |
| Adjusted R2 | 0.353 | 0.208 | 0.354 | 0.210 | 0.290 | 0.161 | 0.272 | 0.164 |
| Observations | 40,519 | 39,907 | 37,744 | 37,270 | 43,554 | 42,942 | 41,921 | 41,347 |
Notes. This table reports multivariate OLS regressions on fund performance. The dependent variables include hedge fund monthly return (RETURN) and monthly alpha (ALPHA). ALPHA is the Fung and Hsieh (2004) seven-factor monthly alpha with factor loadings estimated over the last 24 months. The primary independent variable of interest is the interaction between the treatment indicator variable (TREATMENT) and an indicator variable for whether the month equals or exceeds the first month of the lottery year (POST_LOTTERY). TREATMENT takes a value of one if the fund management company was allocated at least one of its H-1B visas demanded during that lottery year. Control funds are funds that were allocated none of their H-1B visas demanded during the lottery year. The other independent variables include the natural logarithm of last month’s fund AUM in US$m (log(SIZE)), and fund age in decades (AGE) as well as fixed effects for fund-event and event-month. Standard errors in parentheses are clustered by firm. Treatment funds are matched to control funds by minimizing the sum of the absolute difference in monthly fund performance (columns (1) and (2)) or fund residuals (columns (3) and (4)) over the prior 36-month period or based on propensity score for which the covariates include the natural logarithm of fund size, fund age, and fund performance over the past 36 months (columns (5) and (6)) or based on firm AUM (columns (7) and (8)). Detailed variable definitions can also be found in Online Table IA1. The lottery years comprise the following fiscal years: 2008, 2009, and 2014–2016.
***, **, and * denote statistical significance at the 1%, 5%, and 10% levels, respectively.
To understand the time series variation in the monthly performance of the treatment funds relative to that of the control funds, we match treatment to control funds by minimizing the sum of the absolute differences in monthly fund abnormal returns and report the cumulative fund abnormal returns in Figure 2. Fund abnormal returns are the monthly fund residuals from the regression of fund monthly alpha on the fund covariates from Equation (3). The advantage of analyzing the fund residuals from the alpha regression is that they reveal the incremental impact of visa issuance on fund performance after adjusting for both risk and fund characteristics. The results suggest that treatment funds start to outperform control funds in the first postlottery year and continue to outpace control funds in the second year, albeit at a slower rate relative to the first year.
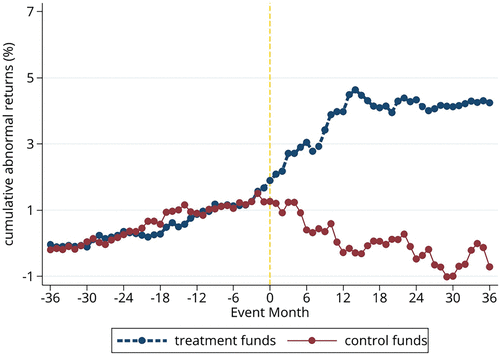
Notes. The event study exploits random variation in H-1B visa allocations to hedge fund firms because of H-1B visa lotteries. Treatment funds are funds that are operated by fund management companies that were allocated at least one of their H-1B visas demanded in the lottery year. Control funds are funds that are operated by fund management companies that were allocated none of their H-1B visas demanded in the lottery year. Treatment funds are matched to control funds by minimizing the sum of the absolute differences in monthly fund abnormal returns over the 36-month period before the lottery year, in which fund abnormal returns are the fund residuals from the regression of monthly Fung and Hsieh (2004) alpha on the fund covariates from Equation (3). Event month zero is the first month of the lottery year. The lottery years comprise the following fiscal years: 2008, 2009, and 2014–2016.
3.2.4. Discussion.
Note that the true economic magnitude of the outperformance may be larger than what we document for three reasons. First, after losing the H-1B lottery, a foreign worker can continue to work for the hedge fund if the worker is still in the OPT period. Second, some hedge fund management companies may temporarily transfer the foreign worker to an international branch after the worker loses the H-1B lottery. Third, after losing the lottery, hedge funds may outsource some of the functions to be performed by the H-1B worker to non-U.S. companies. It is comforting to note that, despite these issues, we still observe that H-1B lottery outcomes materially affect hedge fund performance.22
Our lottery analysis covers fresh H-1B visas that are valid for three years and renewable for six years. Some H-1B workers do become permanent residents by securing Green Cards after working in the United States for a number of years. However, the conversion to Green Card holders by some H-1B workers does not affect the results from our first natural experiment because it merely reduces the likelihood that a hedge fund firm demands H-1B visas in the future and not the value of any new H-1B workers that the firm wants to hire.
One concern is that visa overpetitioning may also obscure the true effect of H-1B visa lottery outcomes on fund performance. Overpetitioning would incur petition costs (e.g., filing fees, attorney fees, etc.) and overstaffing costs (i.e., there would be redundant H-1B workers if the firm secures more visas than it needs). The direct legal and application fees are nontrivial and can be as high as US$50,000 per H-1B worker. These costs should prevent firms from aggressively overpetitioning. Moreover, in results that are available upon request, we find that our findings are qualitatively unchanged when we control for hedge fund firm visa demand scaled by the natural logarithm of firm AUM (a rough proxy for overpetitioning) in our baseline regressions, suggesting that overpetitioning likely has a negligible impact on our findings.
H-1B petitioners with advanced degrees (master’s degrees or higher) have a higher likelihood of winning visa lotteries because they can enter the lotteries for regular H-1B visas after losing the lotteries for advanced degree visas. This raises the possibility that companies with certain characteristics may pursue proportionally more H-1B workers with advanced degrees and, thus, have more of their visa demand met. We address this issue in two ways. First, the randomness test results in columns (3) and (4) of Online Table IA2 indicate that the lottery win rate is not significantly correlated with the fraction of H-1B workers with postgraduate degrees that the firm wants to hire after adjusting for covariates, alleviating the concern of nonrandom lottery outcomes.23 Second, Online Table IA6 indicates that our baseline results are qualitatively unchanged when we control for H-1B workers’ educational degrees in the subsample with education information.
3.2.5. Generalizability.
Another concern is that our estimates may not be relevant for hedge fund firms that do not apply for H-1B visas because of selective participation. To determine the generalizability of our estimates to the overall population of hedge funds, we follow Stuart et al. (2011) and first estimate each fund’s likelihood of participating in the H-1B lottery via a logit model. Next, we estimate weighted least squares regressions analogous to Equation (2) using the inverse probability of participation as the weights. For robustness, we also employ the overlap weights proposed by Li et al. (2018) and the stratification weights proposed by Stuart et al. (2011). Online Table IA7 reveals that our results from the lottery sample are largely generalizable to the population.
3.3. The Second Natural Experiment: Reduction in H-1B Visa Cap
To further understand the impact of visa allocations on hedge fund investment performance, we exploit a second natural experiment. Specifically, we take advantage of the sharp drop in the H-1B visa cap in 2004 (Kato and Sparber 2013).
Prior to the 2004 reduction in the visa cap, Congress had temporarily raised the visa cap to 115,000 in 1999 and further raised the visa cap to 195,000 in 2001, largely in response to lobbying by high-tech companies. The upward trend led many experts in early 2003 to believe that Congress “will either keep the cap high or eliminate it altogether” (Overby 2003, p. 90). Some, such as computer scientist Norm Matloff, predicted that lobbyists would push for either a higher cap or a new visa category without quotas (Quan 2003, p. 23). Moreover, at a Senate hearing on September 16, 2003, three out of four expert witnesses argued that the cap was too low.24
In October 2003, Congress, to the surprise of some observers, announced that the annual cap would drop by two thirds from 195,000 in 2003 to 65,000 in 2004. Whereas the quota reduction does not imply that firms have to let go of staff with existing H-1B visas because only new H-1B visas are affected by the quota, the sharp reduction in the H-1B visa cap still implies that firms face difficulties hiring more H-1B workers or replacing H-1B workers whose visas are expiring.
We note that the visa quota cut was not entirely unexpected as the high U.S. unemployment rate in 2003 meant that there was little political opposition to the cut. Moreover, the main proponents of the visa cap increase, that is, high-tech companies, were unlikely to have strongly lobbied against the visa quota cut given that their own demand for H-1B visas had fallen during that time.25 Nonetheless, the fact that the visa quota cut was not entirely unexpected does not invalidate the second natural experiment because, if some hedge fund firms were indeed adjusting their operations in anticipation of the quota cut, it would make it harder for us to find any statistically significant results.
We argue that, if foreign labor provides valuable skills for hedge funds, the sharp drop in the H-1B visa cap should hurt the investment performance of hedge funds that were reliant on skilled foreign labor. To test, we estimate the following difference-in-differences model:
where TREATMENT1 is an indicator variable that takes a value of one if a fund is operated by a firm that hired H-1B workers before 2004, POST_QUOTACUT is an indicator variable that takes a value of one for years that equal or exceed 2004, and the other variables are as per Equation (1). Because TREATMENT1 and POST_QUOTACUT are subsumed by the fund and year-month fixed effects, respectively, we omit them as stand-alone independent variables. Our sample starts in 2001 as LCAs are unavailable before 2001 and ends in 2006 to accommodate a window of three years before and after the first treatment year, that is, 2004.
Panel A of Table 6 indicates that H-1B–reliant hedge funds saw their returns and alphas deteriorate by 4.74% and 2.64% per annum, respectively, following the 2004 visa quota cut. Panel A also suggests that H-1B–reliant funds delivered lower fund Sharpe ratios, information ratios, MPPMs, and Berk and van Binsbergen (2015) value-added skill post 2003.
|
Table 6. The Second Natural Experiment: 2004 Reduction in H-1B Visa Cap
| RETURN | ALPHA | SHARPE | INFORMATION | MPPM | VALUEADD | |
|---|---|---|---|---|---|---|
| Independent variable | (1) | (2) | (3) | (4) | (5) | (6) |
| Panel A: Treatment funds not matched to control funds | ||||||
| TREATMENT1 × POST_QUOTACUT | −0.395*** | −0.220** | −0.270** | −0.189* | −5.311*** | −0.715** |
| (0.109) | (0.106) | (0.116) | (0.106) | (1.448) | (0.355) | |
| log(SIZE) | −0.729*** | −0.593*** | −0.542*** | −0.258*** | −8.931*** | 0.713*** |
| (0.049) | (0.042) | (0.047) | (0.038) | (0.803) | (0.179) | |
| AGE | 0.956*** | 0.597* | 0.517* | −0.189 | 13.133*** | 4.173*** |
| (0.273) | (0.351) | (0.276) | (0.336) | (3.459) | (1.442) | |
| Fund fixed effects | Yes | Yes | Yes | Yes | Yes | Yes |
| Year-month fixed effects | Yes | Yes | No | No | No | Yes |
| Year fixed effects | No | No | Yes | Yes | Yes | No |
| Adjusted R2 | 0.180 | 0.073 | 0.579 | 0.370 | 0.228 | 0.216 |
| Observations | 126,698 | 126,698 | 11,163 | 11,163 | 11,163 | 61,349 |
| Panel B: Treatment funds matched to control funds based on fund performance | ||||||
| TREATMENT1 × POST_QUOTACUT | −0.250** | −0.455*** | −0.440*** | −0.300** | −6.087*** | −0.514* |
| (0.114) | (0.119) | (0.166) | (0.147) | (1.848) | (0.302) | |
| log(SIZE) | −0.465*** | −0.347*** | −0.424*** | −0.161*** | −5.072*** | 1.442*** |
| (0.080) | (0.074) | (0.098) | (0.058) | (1.031) | (0.175) | |
| AGE | 5.022*** | 2.792 | 2.239** | −1.326 | 30.958** | −33.216 |
| (0.568) | (3.322) | (1.043) | (1.370) | (14.081) | (42.629) | |
| Fund fixed effects | Yes | Yes | Yes | Yes | Yes | Yes |
| Year-month fixed effects | Yes | Yes | No | No | No | Yes |
| Year fixed effects | No | No | Yes | Yes | Yes | No |
| Adjusted R2 | 0.146 | 0.047 | 0.518 | 0.411 | 0.217 | 0.421 |
| Observations | 31,887 | 27,625 | 2,714 | 2,714 | 2,714 | 16,776 |
Notes. This table reports multivariate OLS regressions on hedge fund performance that exploits the sharp reduction of the H-1B visa cap in 2004. The dependent variables include hedge fund monthly return (RETURN), monthly alpha (ALPHA), annualized Sharpe ratio (SHARPE), annualized information ratio (INFORMATION), and value-added skill (VALUEADD). ALPHA is the Fung and Hsieh (2004) seven-factor monthly alpha with factor loadings estimated over the last 24 months. SHARPE, INFORMATION, and MPPM are estimated each fiscal year. SHARPE is the average monthly return minus the risk-free rate divided by the standard deviation of the monthly returns during that fiscal year. INFORMATION is the average of the monthly Fung and Hsieh (2004) residuals divided by the standard deviation of the monthly residuals during that fiscal year. MPPM is computed as per Goetzmann et al. (2007) with risk-aversion parameter . VALUEADD is the monthly gross fund excess return multiplied by prior month’s fund assets under management as per Berk and van Binsbergen (2015). The primary independent variable of interest is the interaction between the treatment indicator variable (TREATMENT1) and an indicator variable for whether the year equals to or exceeds 2004 (POST_QUOTACUT). TREATMENT1 takes a value of one if the fund management company that operates the fund hired H-1B workers prior to 2004. The other independent variables include the natural logarithm of last month’s fund AUM in US$m (log(SIZE)) and fund age in decades (AGE) as well as fixed effects for fund. The regressions on RETURN, ALPHA, and VALUEADD include year-month fixed effects, whereas the regressions on SHARPE, INFORMATION, and MPPM include year fixed effects. Detailed variable definitions can also be found in Online Table IA1. Standard errors in parentheses are clustered by firm. In panel A, treatment funds are not matched to control funds. In panel B, treatment funds are matched to control funds by minimizing the sum of the absolute difference in monthly fund performance over the 36-month period prior to 2004. For example, for the regression on fund return, treatment funds are matched to control funds based on fund return in 2003. Similarly, for the regression on fund alpha, treatment funds are matched to control funds based on fund alpha in 2003. The sample period is from 2001 to 2006.
***, **, and * denote statistical significance at the 1%, 5%, and 10% levels, respectively.
Next, to ensure comparability, we match each H-1B–reliant fund with a non-H-1B–reliant fund by minimizing the sum of the absolute difference in fund performance in the 36-month period prior to 2004. Panel B of Table 6 shows that, relative to comparable non-H-1B–reliant funds, H-1B–reliant funds experienced a 3.00% and 5.46% per annum reduction in fund return and alpha, respectively, following the 2004 H-1B visa quota cut. Online Table IA8 indicates that our findings are robust to alternative specifications.
Figure 3 plots the cumulative monthly abnormal returns of treatment versus control funds, in which treatment funds are matched to control funds by minimizing the sum of the absolute difference in monthly abnormal returns. It reveals that the negative effect of the 2004 visa quota cut on H-1B–reliant funds lasted for about two years. Figure 3 also indicates that treatment funds start to underperform control funds about six months prior to the start of the 2004 fiscal year (i.e., October 2003). One interpretation is that, following the logic of Xu (2025), H-1B–reliant firms may start to preemptively reduce their reliance on H-1B workers in response to the uncertainty created by the visa quota cut. The reduced reliance on H-1B workers, in turn, translates into underperformance.
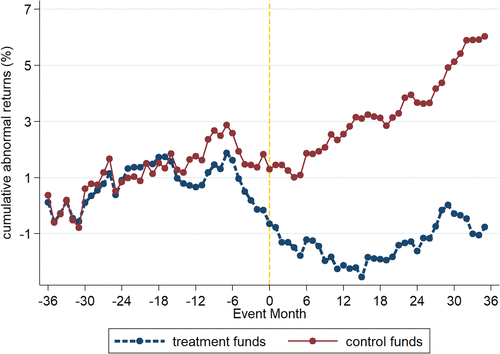
Notes. The difference-in-differences analysis exploits the sharp reduction of the H-1B visa cap in 2004. Treatment funds are funds that are operated by fund management companies that hired H-1B workers prior to 2004. Control funds are funds that are operated by fund management companies that did not hire H-1B workers prior to 2004. Treatment funds are matched to control funds by minimizing the sum of the absolute differences in monthly fund abnormal returns over the 36-month period before 2004, in which fund abnormal returns are the fund residuals from the regression of monthly Fung and Hsieh (2004) alpha on the fund covariates from Equation (4). Event month zero is the first month of fiscal year 2004, that is, October 2003. The sample period is from 2001 to 2006.
Online Table IA9 reveals that hedge funds adjust the composition of their domestic labor force after the uncertainty induced by the H-1B visa lotteries is resolved. Specifically, hedge funds that secure more H-1B workers make fewer job postings for domestic STEM workers and more job postings for domestic workers with complementary skills in areas other than economics, finance, and STEM. These results echo those of Xu (2025) on firm capital investment following H-1B visa lotteries and suggest that uncertainty also has an impact on firm human capital decisions. They also indicate that skilled foreign labor may be more complementary to domestic labor than what popular discourse tends to suggest.
Indeed, we find that, when the domestic labor market is tight, aggregate H-1B demand tends to be high. The correlation between the annual U.S. unemployment rate and H-1B labor demand (between 2007 and 2021 inclusive) is an economically meaningful and is statistically distinguishable from zero at the 1% level, which suggests that the hiring of H-1B workers allows U.S. firms to grow even after exhausting existing domestic labor supply.
3.3.1. Falsification Tests.
To determine whether our difference-in-differences model is properly specified, we conduct a series of falsification tests. First, we pretend that there were H-1B visa quota cuts in 2006–2008. The pseudotreatment years are chosen so that they are relatively close to but maintaining a gap of at least two years from the actual 2004 visa quota cut. Next, for each pseudotreatment year, we construct the pseudoequivalents of TREATMENT1 and POST_QUOTACUT, namely, PSEUDO_TREATMENT1 and POST_PSEUDO_QUOTACUT, respectively. Finally, we reestimate the analogous Equation (4) regression over the symmetric window that spans three years before and three years after the pseudotreatment year. Online Table IA10 reveals that the coefficient estimates on the interaction between PSEUDO_TREATMENT1 and POST_PSEUDO_QUOTACUT are always statistically insignificant at the 10% level. These results suggest that Equation (4) is well specified.
3.4. Underlying Mechanisms
Next, we shed light on the underlying mechanisms by which H-1B workers add value by investigating (a) the nature of their skills, (b) the way they are deployed at hedge funds, and (c) the role of labor market frictions.
Broadly, we postulate that H-1B workers generate alpha by leveraging their exceptional, specialized, and quantitative skills. Therefore, the results should be stronger for workers that garner higher salaries, receive specialized education, and are employed in STEM roles. Moreover, the niche skills that these workers possess should allow hedge funds to develop more distinctive investment strategies, thereby enabling them to better circumvent capacity constraints. Lastly, labor market frictions play a role in hedge funds’ ability to access and motivate immigrant talent. Hedge funds need to overcome search frictions in the hiring process and may exploit the labor market frictions that immobile immigrant workers face.
3.4.1. H-1B Worker Skills.
First, motivated by anecdotal evidence that indicates successful hedge funds often offer high salaries to foreigners who attended mathematically intensive U.S. postgraduate programs, we posit that H-1B workers add value by leveraging their exceptional, specialized, and quantitative skills. If so, the effect should be stronger at funds that hire highly skilled or specialized H-1B workers who possess quantitative abilities. Following the labor literature (Card 1999, Lemieux 2006, Acemoglu and Autor 2011), we proxy for these attributes using pay rank, education level, and whether they are employed in STEM roles.
To test whether H-1B workers add value through their exceptional and specialized skills, we reestimate the baseline performance regressions after including, as additional independent variables, the interactions between H1B and indicator variables for the salary and educational qualifications of the positions linked to the H-1B visas demanded by the fund that year, namely, TOPSALARY, POSTGRADUATE, and PHD. TOPSALARY takes a value of one if the prevailing wage paid to the H-1B workers by the fund management company that year based on LCA data is in the top 10 percentile. During the lottery sample period, the top 10 percentile of H-1B workers draw base salaries that average US$140,234 per year. POSTGRADUATE takes a value of one if the proportion of the H-1B workers hired by the fund management company that year with postgraduate degrees (either master’s or PhD degrees) exceeds the sample median. PHD takes a value of one if the fund management company hired an H-1B worker with a PhD. Education information is only available for the last three years of the lottery sample (i.e., 2014–2016).
Table 7 indicates that our findings can be traced to H-1B workers that garner high salaries and possess postgraduate qualifications. A one standard deviation increase in H-1B visas granted to funds employing highly paid workers with postgraduate degrees precipitates a 2.27%–5.86% per annum increase in Fung and Hsieh (2004) alphas relative to a similar increase in visas granted to funds employing nonhighly paid workers with basic degrees.26
|
Table 7. H-1B Visa Lotteries and Worker Salary/Education
| RETURN | ALPHA | RETURN | ALPHA | RETURN | ALPHA | |
|---|---|---|---|---|---|---|
| Independent variable | (1) | (2) | (3) | (4) | (5) | (6) |
| H1B | 0.215 | 0.332* | −0.041 | 0.175 | 0.042 | 0.212** |
| (0.150) | (0.175) | (0.115) | (0.161) | (0.094) | (0.102) | |
| TOPSALARY | −0.587 | −0.664 | ||||
| (0.464) | (0.559) | |||||
| H1B × TOPSALARY | 0.995** | 1.144** | ||||
| (0.500) | (0.579) | |||||
| POSTGRADUATE | −0.297*** | −0.155 | ||||
| (0.106) | (0.121) | |||||
| H1B × POSTGRADUATE | 0.577*** | 0.443** | ||||
| (0.189) | (0.200) | |||||
| PHD | −0.795*** | −1.049*** | ||||
| (0.167) | (0.227) | |||||
| H1B × PHD | 0.945*** | 0.787** | ||||
| (0.316) | (0.370) | |||||
| log(SIZE) | −0.892*** | −0.533*** | −0.600*** | −0.455*** | −0.603*** | −0.475*** |
| (0.109) | (0.080) | (0.097) | (0.090) | (0.101) | (0.093) | |
| AGE | −0.976 | 1.076 | −7.056** | −5.656 | −6.162** | −4.599 |
| (4.999) | (5.428) | (3.077) | (7.310) | (3.124) | (7.103) | |
| Fund fixed effects | Yes | Yes | Yes | Yes | Yes | Yes |
| Year-month fixed effects | Yes | Yes | Yes | Yes | Yes | Yes |
| Adjusted R2 | 0.268 | 0.146 | 0.138 | 0.058 | 0.138 | 0.060 |
| Observations | 15,688 | 15,688 | 8,929 | 8,929 | 8,929 | 8,929 |
Notes. This table reports multivariate OLS regressions on hedge fund performance. The dependent variables include hedge fund monthly return (RETURN) and monthly alpha (ALPHA). ALPHA is the Fung and Hsieh (2004) seven-factor monthly alpha with factor loadings estimated over the last 24 months. The primary independent variables of interest are the fraction of the fund management company’s demand for cap-subject H-1B visas that is met (H1B), indicator variables for worker salary and education (TOPSALARY, POSTGRADUATE, and PHD)) and their interactions. TOPSALARY takes a value of one if the prevailing wage paid to the H-1B workers by the fund management company that year based on LCA data is in the top 10 percentile. POSTGRADUATE takes a value of one if the proportion of the H-1B workers hired by the fund management company that year with postgraduate degrees (either master’s or PhD degrees) exceeds the sample median. PHD takes a value of one if the fund management company hired an H-1B worker with PhD degree that year. The other independent variables include the natural logarithm of last month’s fund AUM in US$m (log(SIZE)) and fund age in decades (AGE) as well as fixed effects for fund and year-month. Detailed variable definitions can also be found in Online Table IA1. Standard errors in parentheses are clustered by firm. The sample period comprises the following fiscal years: 2008, 2009, and 2014–2016.
***, **, and * denote statistical significance at the 1%, 5%, and 10% levels, respectively.
To test whether H-1B workers add value by leveraging their quantitative abilities, we first reestimate the baseline performance regressions after including, as additional independent variables, the interactions between H1B and indicator variables for the positions that correspond to the H-1B visas sought, namely, STEM, ECON_FIN, and ADMIN, which take values of one if the majority of the H-1B visas a fund applies for relate to STEM, economics/finance, and administrative functions, respectively. If H-1B workers generate alpha via their quantitative skills, our findings should be stronger for H-1B workers in STEM roles.
Anecdotal evidence suggests that STEM workers can contribute to hedge fund performance in two ways. First, they help hedge funds develop innovative and complex trading algorithms. Quantitative hedge funds such as Two Sigma and Renaissance Technologies rely heavily on sophisticated algorithms to analyze large amounts of financial data and identify profitable trading opportunities. These algorithms are developed and maintained by teams of computer scientists, mathematicians, and data analysts. Second, they help hedge funds process reams of data efficiently. The data requirements for quantitative strategies have become increasingly onerous, and programming skills are critical for processing such data efficiently (Cohen et al. 2015).27
Panel A of Table 8 reveals that hedge funds that are allocated more STEM-related H-1B visas outperform. For hedge funds that demand H-1B visas to fill predominantly STEM positions, a one standard deviation increase in visa allocations increases fund return by 1.75% per annum and bolsters fund alpha by 3.29% per annum. In contrast, for hedge funds that apply for H-1B visas to fill predominantly economics/finance positions or administrative roles, we do not observe a meaningful increase in fund performance when these funds are allocated a greater proportion of their H-1B visas requested.28
|
Table 8. H-1B Visa Lotteries and Worker Skills
| RETURN | ALPHA | RETURN | ALPHA | RETURN | ALPHA | |
|---|---|---|---|---|---|---|
| Independent variable | (1) | (2) | (3) | (4) | (5) | (6) |
| Panel A: Regressions featuring interactions between fund H-1B visa allocation and visa job types | ||||||
| H1B | 0.080 | 0.061 | 0.454** | 0.444** | 0.149 | 0.586** |
| (0.141) | (0.144) | (0.192) | (0.213) | (0.211) | (0.257) | |
| STEM | −0.036 | −0.041 | ||||
| (0.160) | (0.161) | |||||
| H1B × STEM | 0.341* | 0.642*** | ||||
| (0.197) | (0.214) | |||||
| ECON_FIN | −0.130 | −0.079 | ||||
| (0.210) | (0.254) | |||||
| H1B × ECON_FIN | −0.310 | −0.059 | ||||
| (0.271) | (0.263) | |||||
| ADMIN | −0.411* | 0.124 | ||||
| (0.214) | (0.215) | |||||
| H1B × ADMIN | 0.237 | −0.383 | ||||
| (0.255) | (0.262) | |||||
| log(SIZE) | −0.970*** | −0.531*** | −0.907*** | −0.552*** | −0.898*** | −0.543*** |
| (0.112) | (0.100) | (0.116) | (0.099) | (0.120) | (0.098) | |
| AGE | 4.301 | 4.711 | 3.328 | 3.578 | 3.343 | 4.850 |
| (8.066) | (3.832) | (7.256) | (3.895) | (8.839) | (4.557) | |
| Fund fixed effects | Yes | Yes | Yes | Yes | Yes | Yes |
| Year-month fixed effects | Yes | Yes | Yes | Yes | Yes | Yes |
| Adjusted R2 | 0.238 | 0.127 | 0.240 | 0.127 | 0.240 | 0.127 |
| Observations | 13,600 | 13,600 | 13,600 | 13,600 | 13,600 | 13,600 |
| Panel B: Regressions featuring interactions between fund H-1B visa allocation and fund investment strategy | ||||||
| H1B | −0.084 | −0.283 | −0.175 | −0.390 | 0.355** | 0.466** |
| (0.434) | (0.331) | (0.502) | (0.354) | (0.174) | (0.208) | |
| H1B × SYSTEMATIC1 | 0.375 | 0.665** | ||||
| (0.443) | (0.336) | |||||
| H1B × SYSTEMATIC2 | 0.517 | 0.807** | ||||
| (0.577) | (0.401) | |||||
| H1B × SYSTEMATIC3 | 0.423** | 0.995*** | ||||
| (0.172) | (0.244) | |||||
| log(SIZE) | −0.479*** | −0.312*** | −0.476*** | −0.308*** | −0.647*** | −0.360* |
| (0.084) | (0.075) | (0.085) | (0.075) | (0.192) | (0.186) | |
| AGE | 4.973 | −0.916 | 5.086 | −0.758 | 5.231 | 0.524 |
| (5.884) | (8.121) | (5.798) | (8.052) | (6.381) | (5.433) | |
| Fund fixed effects | Yes | Yes | Yes | Yes | Yes | Yes |
| Year-month fixed effects | Yes | Yes | Yes | Yes | Yes | Yes |
| Adjusted R2 | 0.221 | 0.150 | 0.221 | 0.150 | 0.353 | 0.188 |
| Observations | 9,231 | 9,231 | 9,231 | 9,231 | 4,071 | 4,071 |
Notes. This table reports multivariate OLS regressions on hedge fund performance. The dependent variables include hedge fund monthly return (RETURN) and monthly alpha (ALPHA). ALPHA is the Fung and Hsieh (2004) seven-factor monthly alpha with factor loadings estimated over the last 24 months. In panel A, the primary independent variables of interest are the fraction of the fund management company’s demand for cap-subject H-1B visas that is met (H1B), indicator variables for H-1B visa job types (STEM, ECON_FIN, and ADMIN), and their interactions. STEM, ECON_FIN, and ADMIN take values of one if the majority of the H-1B visas demanded are for STEM, economics and finance, and administrative positions, respectively. In panel B, the primary independent variables of interest are H1B, indicator variables for fund strategy (SYSTEMATIC1, SYSTEMATIC2, and SYSTEMATIC3), and their interactions. SYSTEMATIC1 takes a value of one if a fund employs a systematic strategy as defined by Harvey et al. (2017). SYSTEMATIC2 takes a value of one if a fund employs a quantitative strategy as defined by Chincarini (2014). SYSTEMATIC3 takes a value of one if any of the hedge fund managers of the fund holds a PhD degree. The other independent variables include the natural logarithm of last month’s fund AUM in US$m (log(SIZE)) and fund age in decades (AGE) as well as fixed effects for fund and year-month. Because SYSTEMATIC1, SYSTEMATIC2, and SYSTEMATIC3 are defined at the fund level, they are subsumed by the fund fixed effects and are, therefore, omitted as stand-alone independent variables from the regressions. Detailed variable definitions can also be found in Online Table IA1. Standard errors in parentheses are clustered by firm. The sample period comprises the following fiscal years: 2008, 2009, and 2014–2016.
***, **, and * denote statistical significance at the 1%, 5%, and 10% levels, respectively.
Next, if H-1B workers add value through their quantitative skills, our results should be stronger for funds that employ systematic as opposed to discretionary investment strategies. To verify, we reestimate the baseline performance regressions after including, as additional independent variables, the interactions between H1B and indicator variables for whether a hedge fund engages in systematic strategies, namely, SYSTEMATIC1, SYSTEMATIC2, and SYSTEMATIC3. SYSTEMATIC1 and SYSTEMATIC2 take values of one if a fund is categorized as a systematic fund based on the Harvey et al. (2017) and Chincarini (2014) classifications, respectively. SYSTEMATIC3 takes a value of one if any of the fund managers at the fund holds a PhD.29 We omit SYSTEMATIC1, SYSTEMATIC2, and SYSTEMATIC3 as stand-alone independent variables from the regressions as they are subsumed by the fund fixed effects. Panel B of Table 8 indicates that a one standard deviation increase in H-1B visa allotment for systematic funds elicits a 3.41%–5.10% per annum increase in risk-adjusted returns relative to a similar increase in visa allotment for discretionary funds.
3.4.2. H-1B Worker Deployment.
Next, we shed light on how hedge funds deploy H-1B workers. Given the specialized skills that H-1B workers possess, they should be well placed to develop distinctive investment strategies, which should outperform (Titman and Tiu 2011, Sun et al. 2012). To test, we construct four measures of strategy distinctiveness: one minus the correlation of fund returns with the equal-weighted or value-weighted returns of the fund’s investment style peers (DISTINCTIVE1 and DISTINCTIVE2) as well as one minus the R2 or adjusted R2 from the regression of fund excess returns on the Fung and Hsieh (2004) seven factors (DISTINCTIVE3 and DISTINCTIVE4). The first two measures follow Sun et al. (2012), whereas the last two measures follow Titman and Tiu (2011). We then estimate a difference-in-differences model analogous to Equation (3) with fund strategy distinctiveness as the dependent variable.
The results reported in Table 9 support the view that H-1B workers help develop distinctive strategies for hedge funds. The coefficient estimates on the interaction variable indicate that, relative to comparable hedge funds that are granted none of their visas demanded and to the prelottery period, hedge funds that are granted at least one of their visas demanded enhance strategy distinctiveness by 0.15 to 0.24 standard deviations in the postlottery period.
|
Table 9. H-1B Visa Lotteries and Fund Strategy Distinctiveness
| DISTINCTIVE1 | DISTINCTIVE2 | DISTINCTIVE3 | DISTINCTIVE4 | |
|---|---|---|---|---|
| Independent variable | (1) | (2) | (3) | (4) |
| Panel A: Treatment funds not matched to control funds | ||||
| TREATMENT × POST_LOTTERY | 0.041* | 0.037* | 0.013 | 0.014 |
| (0.024) | (0.021) | (0.015) | (0.020) | |
| log(SIZE) | 0.004 | −0.009 | 0.002 | −0.012* |
| (0.007) | (0.006) | (0.006) | (0.007) | |
| AGE | −0.013 | 0.170 | −0.359** | −0.504*** |
| (0.132) | (0.147) | (0.155) | (0.191) | |
| Fund-event fixed effects | Yes | Yes | Yes | Yes |
| Event-month fixed effects | Yes | Yes | Yes | Yes |
| Adjusted R2 | 0.833 | 0.825 | 0.709 | 0.706 |
| Observations | 45,257 | 45,257 | 53,473 | 53,473 |
| Panel B: Treatment funds matched to control funds based on fund strategy distinctiveness | ||||
| TREATMENT × POST_LOTTERY | 0.049* | 0.060** | 0.049** | 0.047* |
| (0.027) | (0.026) | (0.020) | (0.026) | |
| log(SIZE) | −0.002 | −0.003 | 0.000 | −0.023** |
| (0.009) | (0.009) | (0.008) | (0.011) | |
| AGE | −0.013 | 0.038 | −0.493*** | −0.664*** |
| (0.111) | (0.260) | (0.174) | (0.207) | |
| Fund-event fixed effects | Yes | Yes | Yes | Yes |
| Event-month fixed effects | Yes | Yes | Yes | Yes |
| Adjusted R2 | 0.821 | 0.810 | 0.736 | 0.721 |
| Observations | 39,438 | 39,315 | 45,621 | 45,840 |
Notes. This table reports multivariate OLS regressions on measures of fund strategy distinctiveness. The dependent variables include one minus the correlation of fund returns with the equal-weighted return of the fund’s investment style peers (DISTINCTIVE1), one minus the correlation of fund returns with the value-weighted return of the fund’s investment style peers (DISTINCTIVE2), one minus the R2 from the regression of fund excess returns on the Fung and Hsieh (2004) seven factors (DISTINCTIVE3), and one minus the adjusted R2 from the regression of fund excess returns on the Fung and Hsieh (2004) seven factors (DISTINCTIVE4). The first two measures follow Sun et al. (2012), and the last two measures follow Titman and Tiu (2011). The strategy distinctiveness measures are estimated over the last 36 months. Alpha is the Fung and Hsieh (2004) seven-factor monthly alpha with factor loadings are estimated over the last 24 months. The primary independent variable of interest is the interaction between the treatment indicator variable (TREATMENT) and an indicator variable for whether the month equals to or exceeds the first month of the lottery year (POST_LOTTERY). TREATMENT takes a value of one if the fund management company was allocated at least one of its H-1B visas demanded during that lottery year. The other independent variables include the natural logarithm of last month’s fund AUM in US$m (log(SIZE)) and fund age in decades (AGE) as well as fixed effects for fund-event and event-month. Detailed variable definitions can also be found in Online Table IA1. Standard errors in parentheses are clustered by firm. In panel A, treatment funds are not matched to control funds. In panel B, treatment funds are matched to control funds based on fund strategy distinctiveness. The lottery sample period comprises the following fiscal years: 2008, 2009, and 2014–2016.
***, **, and * denote statistical significance at the 1%, 5%, and 10% levels, respectively.
Next, the specialized skills that H-1B workers possess should also increase the variety of investment opportunities that hedge funds exploit. To test, we study via a difference-in-differences model analogous to Equation (3) whether funds that are allocated more H-1B visas arbitrage a greater variety of the prominent stock market anomalies identified by Stambaugh et al. (2012). The dependent variables ANOMALY1 and ANOMALY2 are the numbers of stock anomalies on which a fund loads positively and significantly at the 5% level and at the 10% level, respectively, over the last 36 months.
Table 10 reports results when we do not match control funds to treatment funds (panel A) and when we match control funds to treatment funds based on fund scalability in the prelottery period (panel B). Columns (1) and (2) in panel B reveal that, relative to comparable hedge funds that secure none of their visas demanded and to the prelottery period, hedge funds that secure at least one of their visas demanded arbitrage 0.265 to 0.273 (or 40%–55%) more anomalies in the postlottery period.30 In results available on request, we find that the number of stock anomalies arbitraged by a fund positively relates to fund scalability.
|
Table 10. H-1B Visa Lotteries and Fund Capacity Constraints
| ANOMALY1 | ANOMALY2 | SCALABILITY1 | SCALABILITY2 | |
|---|---|---|---|---|
| Independent variable | (1) | (2) | (3) | (4) |
| Panel A: Treatment funds not matched to control funds | ||||
| TREATMENT × POST_LOTTERY | 0.239* | 0.298** | 1.005** | 0.583* |
| (0.132) | (0.138) | (0.415) | (0.327) | |
| log(SIZE) | 0.164*** | 0.196*** | −0.379** | −0.156 |
| (0.043) | (0.049) | (0.149) | (0.141) | |
| AGE | −1.150 | −1.615* | −16.167 | −10.052 |
| (0.713) | (0.847) | (13.269) | (13.251) | |
| Fund-event fixed effects | Yes | Yes | Yes | Yes |
| Event-month fixed effects | Yes | Yes | Yes | Yes |
| Adjusted R2 | 0.458 | 0.474 | 0.345 | 0.309 |
| Observations | 53,750 | 53,750 | 51,289 | 48,133 |
| Panel B: Treatment funds matched to control funds based on fund scalability or number of anomaly factors | ||||
| TREATMENT × POST_LOTTERY | 0.265** | 0.273** | 1.056** | 0.600** |
| (0.115) | (0.134) | (0.497) | (0.263) | |
| log(SIZE) | 0.108*** | 0.119*** | −0.229* | −0.088 |
| (0.037) | (0.042) | (0.135) | (0.106) | |
| AGE | −1.343** | −1.768** | −13.704 | −8.256 |
| (0.560) | (0.763) | (10.614) | (8.413) | |
| Fund-event fixed effects | Yes | Yes | Yes | Yes |
| Event-month fixed effects | Yes | Yes | Yes | Yes |
| Adjusted R2 | 0.429 | 0.453 | 0.378 | 0.291 |
| Observations | 44,847 | 44,847 | 41,486 | 39,510 |
Notes. This table reports multivariate OLS regressions on measures of fund capacity constraints. The dependent variables include the number of stock anomaly factors that the fund loads positively and significantly at the 5% level on (ANOMALY1), the number of stock anomaly factors that the fund loads positively and significantly at the 10% level on (ANOMALY2), the scalability of hedge fund returns (SCALABILITY1), and the scalability of hedge fund alpha (SCALABILITY2). Scalability is the beta on the natural logarithm of last month’s fund AUM in the rolling regression, estimated over the last 36 months, of monthly fund return or fund alpha on the natural logarithm of last month’s fund AUM. Alpha is the Fung and Hsieh (2004) seven-factor monthly alpha with factor loadings estimated over the last 24 months. The primary independent variable of interest is the interaction between the treatment indicator variable (TREATMENT) and an indicator variable for whether the month equals to or is after the first month of the lottery year (POST_LOTTERY). TREATMENT takes a value of one if the fund management company was allocated at least one of its H-1B visas demanded during that lottery year. The other independent variables include the natural logarithm of last month’s fund AUM in US$m (log(SIZE)) and fund age in decades (AGE) as well as fixed effects for fund-event and event-month. Detailed variable definitions can also be found in Online Table IA1. Standard errors in parentheses are clustered by firm. In panel A, treatment funds are not matched to control funds. In panel B, treatment funds are matched to control funds based on fund scalability or the number of anomaly factors. The lottery sample period comprises the following fiscal years: 2008, 2009, and 2014–2016.
***, **, and * denote statistical significance at the 1%, 5%, and 10% levels, respectively.
By exploiting a greater variety of investment opportunities, hedge funds can more easily deploy additional capital in productive ways. Therefore, a corollary of the results from Table 10 is that H-1B workers can help funds to overcome capacity constraints (Berk and Green 2004, Getmansky 2012). This may explain why we find in Table 1 that larger hedge funds are more likely to employ H-1B workers.
To test whether H-1B workers help hedge funds sidestep fund-level capacity constraints, we estimate a difference-in-differences model analogous to Equation (3) with fund scalability as the dependent variable. We consider two measures of scalability: the scalability of fund return (SCALABILITY1) and the scalability of fund alpha (SCALABILITY2), in which the scalability of fund return (alpha) is the beta on the natural logarithm of last month’s fund size in the return (alpha) regression estimated over the last 36 months. The coefficient estimates on the interaction variable reported in columns (3) and (4) of panel B reveal that, relative to comparable hedge funds that are allocated none of their visas demanded and to the prelottery period, hedge funds that are allocated at least one of their visas demanded enhance the scalability of their returns by 0.24 standard deviations and the scalability of their alphas by 0.13 standard deviations in the postlottery period.
3.4.3. Labor Market Frictions.
Finally, labor market frictions may affect the ability of funds to extract rents from skilled immigrant workers. Specifically, the frictions faced by hedge funds in their efforts to identify, attract, and retain immigrant talent could affect alpha generation. We argue that immigrant managers and managers that originate from the same region should be better able to identify, attract, and retain high-quality immigrant workers, possibly through cultural proximity, shared social networks (Du et al. 2017, Bai et al. 2022), and homophily (McPherson et al. 2001, Cohen et al. 2008).31
Therefore, to proxy for funds’ ability to hire and retain high-quality H-1B workers, we use the indicator variables IMMIGRANTMGR and SAMEREGIONMGR. IMMIGRANTMGR is the proportion of the fund managers at the fund that are classified as immigrants. Immigrants are managers whose names, according to ChatGPT, suggest that they originate from outside the United States. SAMEREGIONMGR is an indicator variable that takes a value of one if the manager likely originates from the same region as the H-1B worker based on ChatGPT and a cosine similarity test. Next, we reestimate the baseline performance regressions after including, as additional independent variables, the interactions between H1B and these variables.
The results showcased in columns (1)–(4) of Table 11 align with the view that funds’ ability to identify, attract, and retain immigrant talent affects alpha generation. A one standard deviation increase in H-1B visas granted to immigrant-led funds precipitates a 5.94%–6.86% per annum increase in Fung and Hsieh (2004) alphas relative to a similar increase in visas granted to nonimmigrant-led funds.32
|
Table 11. H-1B Visa Lotteries and Labor Market Frictions
| RETURN | ALPHA | RETURN | ALPHA | RETURN | ALPHA | |
|---|---|---|---|---|---|---|
| Independent variable | (1) | (2) | (3) | (4) | (5) | (6) |
| H1B | −0.133 | 0.066 | −0.938* | −0.624 | −0.194 | 0.013 |
| (0.189) | (0.220) | (0.522) | (0.540) | (0.285) | (0.284) | |
| H1B × IMMIGRANTMGR | 0.983** | 1.159** | ||||
| (0.462) | (0.583) | |||||
| SAMEREGIONMGR | −0.744* | −0.456 | ||||
| (0.378) | (0.388) | |||||
| H1B × SAMEREGIONMGR | 1.256** | 1.338** | ||||
| (0.608) | (0.594) | |||||
| CHINESE_INDIAN | −0.714 | −0.165 | ||||
| (0.440) | (0.507) | |||||
| H1B × CHINESE_INDIAN | 0.982** | 0.837* | ||||
| (0.464) | (0.489) | |||||
| log(SIZE) | −0.828*** | −0.517*** | −0.812*** | −0.690*** | −0.881*** | −0.555*** |
| (0.108) | (0.106) | (0.156) | (0.216) | (0.111) | (0.091) | |
| AGE | −7.604*** | −2.747 | 16.255 | 11.440 | 0.000 | 2.545 |
| (1.813) | (5.068) | (13.026) | (7.366) | (4.774) | (5.527) | |
| Fund fixed effects | Yes | Yes | Yes | Yes | Yes | Yes |
| Year-month fixed effects | Yes | Yes | Yes | Yes | Yes | Yes |
| Adjusted R2 | 0.273 | 0.136 | 0.301 | 0.164 | 0.267 | 0.138 |
| Observations | 11,931 | 11,931 | 5,060 | 5,060 | 15,707 | 15,707 |
Notes. This table reports multivariate OLS regressions on hedge fund performance. The dependent variables include hedge fund monthly return (RETURN) and monthly alpha (ALPHA). ALPHA is the Fung and Hsieh (2004) seven-factor monthly alpha with factor loadings estimated over the last 24 months. The primary independent variables of interest are the fraction of the fund management company’s demand for cap-subject H-1B visas that is met (H1B); indicator variables for funds’ ability to identify, attract, and retain high-quality immigrant workers (IMMIGRANTMGR and SAMEREGIONMGR); a proxy for worker mobility (CHINESE_INDIAN); and their interactions. IMMIGRANTMGR is the proportion of the fund managers at the fund that are classified as immigrants. Immigrants are managers whose names, according to ChatGPT, suggest that they originate outside the United States. SAMEREGIONMGR is an indicator variable that takes a value of one if the manager likely originates from the same region as the H-1B worker. CHINESE_INDIAN is the percentage of Chinese or Indian workers for whom the fund management company issued H-1B visa petitions that year. We focus on workers originating from these countries as they face unusually long waiting times to secure Green Cards (Shen 2021, Gupta 2023). The other independent variables include the natural logarithm of last month’s fund AUM in US$m (log(SIZE)) and fund age in decades (AGE) as well as fixed effects for fund and year-month. Because IMMIGRANTMGR is defined at the fund level, it is subsumed by the fund fixed effects and is, therefore, omitted as a stand-alone independent variable from the regressions. Detailed variable definitions can also be found in Online Table IA1. Standard errors in parentheses are clustered by firm. The sample period comprises the following fiscal years: 2008, 2009, and 2014–2016.
***, **, and * denote statistical significance at the 1%, 5%, and 10% levels, respectively.
Next, we argue as per Shen (2021) and Gupta (2023) that funds are better able to exploit and hold up immobile workers that face greater labor market frictions. To proxy for worker mobility, we construct a variable CHINESE_INDIAN, which is the percentage of Chinese or Indian workers for whom the fund management company issued H-1B visa petitions that year. We focus on workers originating from these countries as they face unusually long waiting times to secure Green Cards. As a result, this allows H-1B sponsoring firms to tie down these workers and extract more value from them (Mailath and Postlewaite 1990, Morrison and Wilhelm 2008).
To test this view, we reestimate the baseline performance regressions after including, as additional independent variables, the interactions between H1B and CHINESE_INDIAN. The results reported in columns (5) and (6) of Table 11 are consistent with the notion that hedge fund firms are better able to extract rents from immobile H-1B workers. A one standard deviation increase in H-1B visas granted to funds employing immobile H-1B workers is associated with a 4.29% per annum increase in risk-adjusted returns relative to a similar increase in visas granted to funds employing mobile H-1B workers.
3.5. Homophily and H-1B Workers
Despite the valuable skills possessed by H-1B workers, only 13.5% of hedge funds that manage 28.4% of hedge fund assets hire H-1B workers in any given year. Hedge fund managers are predominantly white and American (Lu et al. 2024), whereas H-1B workers tend to originate from Asia.33 Therefore, we posit that racial and ethnic homophily may induce some fund managers to favor domestic workers. Indeed, the results in Table 11 suggest that H-1B workers generate more value when led by immigrant managers who originate from the same region. Therefore, any homophily concerns may not be entirely irrational.
To test, we estimate probit regressions on HIRED_H1B and ordinary least squares (OLS) regressions on log(1+NUMBER_H1B). The independent variables of interest include the racial diversity of the fund management team (RACIAL_DIVERSITY) as well as the fraction of the fund management team that is white (WHITE), black (BLACK), Latino (LATINO), and Asian (ASIAN). The other independent variables include management fee, performance fee, redemption period, notice period, lockup period, minimum investment, the natural logarithm of last year’s fund AUM, and fund age as well as fixed effects for year and investment style. Using manager name and the methodology of Imai and Khanna (2016), we classify managers as white (77.2%), black (7.9%), Hispanic (5.8%), and Asian (6.7%). RACIAL_DIVERSITY is one minus the number of shared connections in a team based on race scaled by the total number of possible shared connections as per Lu et al. (2024).
Panels A and B of Table 12 indicate that racially diverse (i.e., less homophilous) funds hire more H-1B workers. A one standard deviation (or 0.161 unit) increase in RACIAL_DIVERSITY is associated with a statistically significant 1.14% increase in HIRED_H1B. Moreover, consistent with the homophily view, both the propensity to hire H-1B workers and the number of H-1B workers hired negatively relate to the fraction of whites and positively relate to the fraction of Asians on the fund management team.34
|
Table 12. Fund Manager Race, Country of Origin, and the Propensity to Hire H-1B Workers
| Independent variable | ||||
|---|---|---|---|---|
| RACIAL_DIVERSITY | WHITE | BLACK | LATINO | ASIAN |
| (1) | (2) | (3) | (4) | (5) |
| Panel A: Regressions on HIRED_H1B with race variables | ||||
| 0.333*** | −0.443*** | −0.492* | 0.308 | 0.591*** |
| (0.100) | (0.119) | (0.278) | (0.236) | (0.126) |
| [0.071] | [−0.087] | [−0.097] | [0.061] | [0.116] |
| Panel B: Regressions on log(1+NUMBER_H1B) with race variables | ||||
| 0.070*** | −0.096*** | −0.077 | 0.063 | 0.140*** |
| (0.023) | (0.031) | (0.056) | (0.061) | (0.039) |
| Independent variable | |||||
|---|---|---|---|---|---|
| CTRY_DIVERSITY | AMERICA | EUROPE | EASTASIA | SOUTHASIA | MIDDLEEAST |
| (1) | (2) | (3) | (4) | (5) | (6) |
| Panel C: Regressions on HIRED_H1B with country of origin variables | |||||
| 0.379*** | −0.171** | −0.075 | 0.601*** | 0.516*** | 0.533** |
| (0.089) | (0.065) | (0.070) | (0.134) | (0.161) | (0.212) |
| [0.079] | [−0.033] | [−0.015] | [0.117] | [0.101] | [0.104] |
| Panel D: Regressions on log(1+NUMBER_H1B) with country of origin variables | |||||
| 0.072*** | −0.035** | −0.009 | 0.145*** | 0.133** | 0.109 |
| (0.025) | (0.016) | (0.015) | (0.046) | (0.051) | (0.068) |
Notes. This table reports multivariate probit and OLS regressions on hedge fund propensity to hire H-1B workers. The dependent variables include an indicator variable for whether the hedge fund management company hired an H-1B worker this year (HIRED_H1B) as well as the natural logarithm of one plus the number of H-1B workers hired this year (log(1+NUMBER_H1B)). Probit regressions are estimated for HIRED_H1B, and OLS regressions are estimated for log(1+NUMBER_H1B). The independent variables of interest that relate to race include the racial diversity of the hedge fund management team (RACIAL_DIVERSITY) as well as the fraction of the hedge fund management team that is white (WHITE), black (BLACK), Latino (LATINO), and Asian (ASIAN). The independent variables of interest that relate to country of origin include the country of origin diversity of the hedge fund management team (CTRY_DIVERSITY) as well as the fraction of the hedge fund management team that is from North America (AMERICA), Europe (EUROPE), East and Southeast Asia (EASTASIA), South and Central Asia (SOUTHASIA), and West Asia and North Africa (MIDDLEEAST). The other independent variables include management fee (MGTFEE), performance fee (PERFFEE), redemption period (REDEMPTION), notice period (NOTICE), lockup period (LOCKUP), minimum investment in US$m (MININV), the natural logarithm of last year’s fund AUM in US$m (log(SIZE)), and fund age in decades (AGE) as well as fixed effects for year and investment style. Detailed variable definitions can also be found in Online Table IA1. The coefficient estimates on the fund controls are omitted for brevity. Standard errors in parentheses are clustered by firm. Marginal effects are in brackets. Panels A and B present results from regressions with race variables. Panels C and D present results from regressions with country of origin variables. Panels A and C report results from probit regressions on HIRED_H1B. Panels B and D report results from OLS regressions on log(1+NUMBER_H1B). The sample period is from January 2001 to December 2016.
***, **, and * denote statistical significance at the 1%, 5%, and 10% levels, respectively.
To further test the homophily view, we estimate analogous regressions on HIRED_H1B and log(1+NUMBER_H1B) with independent variables derived from fund manager country of origin estimates. These independent variables include the country of origin diversity of the fund management team (CTRY_DIVERSITY) as well as the fraction of the fund managers from North America (AMERICA), Europe (EUROPE), East and Southeast Asia (EASTASIA), South and Central Asia (SOUTHASIA), and Western Asia and Africa (MIDDLEEAST). Country of origin is determined using manager name and ChatGPT. Using the country of origin estimates, we classify fund managers into those from North America (56.74%), Europe (32.50%), East and Southeast Asia (4.32%), South and Central Asia (3.40%), and Western Asia and North Africa (2.33%).35 Country of origin diversity is one minus the number of shared connections in a team based on country of origin scaled by the total number of possible shared connections.
Panels C and D of Table 12 reveal that a one standard deviation (or 0.234 unit) increase in CTRY_DIVERSITY is associated with a statistically significant 1.84% increase in HIRED_H1B. Moreover, as one would expect based on homophily, the likelihood of hiring a H-1B worker and the number of H-1B workers hired negatively relate to the fraction of fund managers from North America and positively relate to the fraction of fund managers from East and South Asia.
3.6. Mutual Funds
To gauge external validity, we rerun our baseline tests on all actively managed U.S. equity mutual funds. We assemble a comprehensive sample of U.S. equity mutual funds from the Center for Research in Security Prices (CRSP) Survivor-Bias-Free Mutual Fund Database and Morningstar Direct and merge and clean the data following the data appendix of Berk and van Binsbergen (2015) and Pástor et al. (2015). We identify active equity mutual funds and combine multiple fund share classes into one following the procedure of Bessembinder et al. (2026). In addition, we carefully clean historical mutual fund management company names in the CRSP Mutual Fund Database as per Dannhauser and Spilker (2023). Lastly, we merge the sample mutual funds to the LCA and H-1B lottery databases via fund company name based on the same matching algorithm for hedge funds. This leaves us with a total of 1,682 mutual funds in our lottery sample.
We expect to find directionally similar but economically weaker results given mutual funds’ lower reliance on STEM H-1B workers (see Figure 1), whom we show drive most of the alpha creation at hedge funds. Online Table IA11 reveals that, consistent with this view, an increase in the likelihood of winning the H-1B lottery is associated with a statistically significant increase in mutual fund Fama and French (1993) three-factor alpha and a positive but statistically insignificant change in mutual fund Carhart (1997) four-factor alpha. Specifically, a one standard deviation increase in H1B engenders a modest 23 basis point (t-statistic = 1.96) increase in annualized mutual fund three-factor alpha the next year. In line with the findings on STEM H-1B workers at hedge funds, Online Table IA11 also indicates that we obtain stronger results when the majority of H-1B visas demanded by the mutual fund firm are designated for STEM positions. An increase in the probability of securing H-1B visas via the lottery precipitates a statistically significant increase in both three- and four-factor mutual fund alphas when those visas are allocated to STEM positions within the mutual fund firm.
4. Conclusion
Despite the prevalence of skilled immigrants in finance and concerns about whether foreign labor is simply a cheaper but inferior alternative to domestic labor, we still know little about whether skilled immigrants add value in finance and how they do so. We shed light on these issues by studying, via two natural experiments, the implications of changes to the supply of H-1B workers on hedge fund investment performance.
We establish three main results. First, we find that hedge funds that secure more H-1B visas via random lotteries deliver higher returns, alphas, Sharpe ratios, information ratios, MPPMs, and value-added skill than do hedge funds that secure fewer H-1B visas via the same lotteries. The equal-weighted portfolio of funds with the highest lottery win rates outperforms the equal-weighted portfolio of funds with the lowest lottery win rates after adjusting for risk. These results cannot be explained by fund characteristics, omitted risk factors, visa overpetitioning, or the different lottery win rates for advanced degree visas versus basic degree visas.
Second, we show that, following the sharp reduction in the annual H-1B visa quota from 195,000 to 65,000 imposed in 2004, hedge funds that were reliant on H-1B workers experienced a 5.46% per annum reduction in fund alpha relative to other comparable hedge funds that were not reliant on H-1B workers.
Third, we shed light on the underlying mechanisms by which skilled immigrants contribute to the alpha generation process at hedge funds. We show that immigrants add value by leveraging their exceptional, specialized, and quantitative skills. Moreover, skilled immigrants increase the distinctiveness and variety of the investment strategies that their funds operate, thereby helping hedge funds overcome capacity constraints. Further, funds led by immigrant managers who are better placed to identify, attract, and retain high-quality immigrant workers via cultural proximity, shared social networks, and homophily, extract more alpha from H-1B workers. Finally, fund management companies are also better able to extract rents from immobile workers who face greater labor market frictions. H-1B workers from countries that experience significant difficulties in obtaining Green Cards drive more of the alpha creation.
The authors are especially grateful to Lukas Schmid (the department editor), an anonymous associate editor, and two anonymous referees, whose constructive comments and suggestions significantly improved the paper. They also thank Vikas Agarwal, John Bai (discussant), Hendrik Bessembinder, Alon Brav, Stephen Brown (discussant), Stephen Dimmock, Amar Gande, Jiekun Huang, Chotibhak Jotikasthira, Byoung Uk Kang (discussant), Olga Kolokolova, Will Liu, James O’Donovan, Clemens Otto, Yaxuan Qi, Antoinette Schoar, Tao Shu (discussant), Clemens Sialm, Sara Ain Tommar (discussant), Kumar Venkataraman, Florian Weigert (discussant), Xueping Wu, Zhengyang Xu, and Alan Zhang (discussant) as well as seminar participants at the City University of Hong Kong, Singapore Management University, Southern Methodist University, the 2022 Financial Management Association Meetings in Atlanta, the 14th Annual Hedge Fund Conference in Paris, the 2023 Finance Down Under Conference in Melbourne, the 2023 Midwest Finance Association Meetings in Chicago, the 2023 Swiss Society for Financial Market Research Conference in Zurich, the 2023 Financial Intermediation Research Society Conference in Vancouver, and the 2023 China International Conference in Finance in Shanghai for helpful conversations and commentary. An early draft of the paper was titled “Immigrants in Finance.”
1 The H-1B program allows companies and other employers in the United States to temporarily employ foreign workers in occupations that require the theoretical and practical application of a body of highly specialized knowledge and a bachelor’s degree or higher in the specific specialty or its equivalent. H-1B specialty occupations may include fields such as architecture, engineering, mathematics, physical sciences, social sciences, medicine and health, education, business specialties, accounting, law, theology, and the arts. See https://www.uscis.gov/working-in-the-united-states/temporary-workers/h-1b-specialty-occupations-and-fashion-models/h-1b-cap-season.
2 The finance and insurance sector accounted for US$1,557.7 billion or 5.34% of U.S. gross domestic product in 2024. See https://www.bea.gov/data/gdp/gdp-industry. For evidence of the intense debate over the H-1B program, see “Should the U.S. expand the H-1B visa program?” The Wall Street Journal, November 7, 2022, and “Fired Americans say Indian firm gave their jobs to H-1B visa holders,” The Wall Street Journal, March 28, 2024.
3 See https://www.barclayhedge.com/solutions/assets-under-management/hedge-fund-assets-under-management/.
4 In 2020, top quantitative talent, employed in roles such as quantitative researcher, quantitative developer, and machine learning scientist, under the H-1B visa program earn base salaries of between US$200,000 and US$300,000 per annum at hedge funds. See https://www.efinancialcareers.sg/news/2020/09/technology-salaries-hedge-funds.
5 During our sample period (2001–2016), all cap-subject H-1B visas were distributed through random lotteries in fiscal years 2008, 2009, and 2014–2016. Our first natural experiment exploits the random visa lotteries in those years.
6 This is equivalent to a 0.107 standard deviation increase in annualized fund return and a 0.143 standard deviation increase in annualized fund alpha, respectively, in the fund lottery sample.
7 We focus on H-1B–reliant hedge funds in the first experiment because only those hedge funds are subject to the effects of random H-1B visa lotteries. Hedge funds that do not apply for H-1B visas do not show up in the H-1B visa lottery pool. Note that the second experiment still focuses on H-1B–reliant hedge funds although it employs other hedge funds as a control group to draw causal inferences.
8 See “School of Quant: At $29,000, a Public NYC College Outclasses Princeton,” Bloomberg, December 15, 2022.
9 For example, according to The Wall Street Journal, the notion that “H-1B visa holders represent ‘cheap labor’ displacing U.S. workers” was a popular (but false) one. See “The Wal-Mart 300,” The Wall Street Journal, October 24, 2003.
10 The advantage of our setup as well as those of Chen et al. (2021) and Dimmock et al. (2022) is that we analyze large-scale H-1B visa lotteries. Relative to the small-scale last-day H-1B visa lotteries studied by Wu (2018) and Doran et al. (2022), large-scale H-1B visa lotteries feature significantly more observations and are much less susceptible to sample selection concerns. See the discussion in Brinatti et al. (2023).
11 In the mutual fund literature, research shows that fund managers outperform by exploiting their alumni connections (Cohen et al. 2008) and relying on their prior experience outside the financial sector (Cici et al. 2018).
12 An H-1B visa application may be denied if the USCIS deems the applicant to be not qualified for the job. Such denials serve to prevent H-1B visa fraud, which often involves information technology consulting firms faking nonexisting jobs or contracts with third parties. Hedge fund management companies are not the usual suspects for visa fraud. In addition, an H-1B visa application may be denied if the role outlined in the LCA for which the firm applies could be fulfilled by a U.S. person. However, because hedge fund jobs tend to be specialized and applicants for hedge fund jobs typically have special skills or advanced degrees, it is unlikely that hedge fund management companies are denied visas for this reason. For example, Blackrock Financial Management had an average H-1B petition denial rate of 0.84% over the 2014–2016 period (https://h1bgrader.com/h1b-sponsors/blackrock-_nancial-management-inc-vk483n1p0w). Thus, it is unlikely that H-1B petition denials affect the randomness of the H-1B lottery win rate in our sample.
13 To ameliorate the effect of outliers, we winsorize the fund return data at the 0.05 and 99.95 percentiles and the fund AUM data at the 99.95 percentile. Our baseline results are qualitatively unchanged with the raw, unwinsorized data.
14 In our study, we focus only on U.S. based funds, that is, those managed by fund management firms with headquarters located in the United States.
15 Inferences do not change when we use factor loadings estimated over the past 36 months instead.
16 Our model specification follows the recommendation of Petersen (2009). According to Petersen (2009), to control for time effects in fund returns, researchers should either employ time fixed effects or cluster standard errors by time, but not both. Our results are robust to omitting the year-month fixed effects and clustering by firm and year-month instead.
17 We compute MPPM with a risk-aversion parameter equal to three. Our results are robust when we compute MPPM with equal to two or four.
18 These numbers likely overstate the marginal benefit and understate the marginal cost to the fund of each worker. The US$1.52 million per month increase in value added only translates into a US$2.74 million per year increase in fee revenue, assuming that the fund is operating at or above its high watermark and that the fund charges a performance fee of 15%. The average base salary of US$140,234 does not take into account the substantial performance bonuses, which can be multiple times base salaries, that investment professionals at hedge funds can receive if they perform well (Light 2001).
19 The results also suggest that hedge funds face difficulties replacing skilled foreigners with local workers when fund management companies are not allocated visas via the H-1B lotteries. There are three possible reasons. First, local workers and H-1B workers often possess different skills (Kerr 2014). Second, foreigners account for a substantial fraction of STEM students in U.S. institutions of higher education. For example, in school year 2016–2017, 22% of all collegiate degrees, 54% of all master’s degrees, and 44% of all doctorate degrees issued in STEM fields in the United States were earned by foreign students (https://crsreports.congress.gov/product/pdf/IF/IF11347). Third, had domestic labor sufficed, hedge funds would unlikely spend the time and effort going through the H-1B application process and dealing with the uncertainty created by the H-1B lotteries.
20 There are concerns that our portfolio sort results could be driven by hedge fund firms that demand only one H-1B visa in a year because these firms are placed into either one of the extreme portfolios in Table 4. It is comforting to note that our portfolio sort results are robust to excluding such firms from the sample.
21 The events refer to the years 2008, 2009, and 2014–2016, for which visa lotteries were conducted. The event months refer to the months starting 36 months before and ending 36 months after the start of the lottery year corresponding to the event.
22 Note that it is unlikely that hedge fund firms use the H-1B visa to bring top talent from their foreign subsidiaries to the United States. This is because the L-1 visa is much more suitable for this purpose. The L-1 visa is for intracompany transferees who are managers and executives (L-1A) or have specialized knowledge (L-1B). L-1 visas have several advantages over H-1B visas for internal employee transfer. First, there is no annual cap for L-1 visas, and thus, the firm does not face the uncertainty created by the H-1B visa lottery. Second, L-1 visas do not impose any kind of educational requirement on the foreign employee. H-1B visas mandate that the foreign worker has a bachelor’s degree or higher. Third, L-1 visas are more affordable than H-1B visas as the firm does not have to file an LCA before filing the I-129 form.
23 Because the regressions in Online Table IA2 control for firm fixed effects, the statistically insignificant coefficient estimates on the postgraduate demand variable suggest that, after controlling for the time-invariant propensity of the firm to hire H-1B workers with postgraduate degrees, the time-varying propensity to hire such workers is unrelated to lottery outcomes. Given that all our regressions include fund fixed effects, which subsume the firm fixed effects, our results are, therefore, not affected by the differential lottery win rate between advanced and basic degree visas.
25 See “Foreign workers will soon get fewer U.S. visas,” The Wall Street Journal, October 1, 2003.
26 Note that the negative coefficient estimates on PHD does not imply that firms that tend to hire workers with PhDs underperform as the fund fixed effects account for the time-invariant propensity to hire PhDs. Rather they imply that, when firms want to hire more H-1B workers with PhDs but are not allocated any H-1B visas via the lottery, they subsequently underperform.
27 For example, Renaissance Technologies maintains a “research database that grows by more than 40 terabytes a day.” See https://www.rentec.com/Home.action?about=true.
28 We caution that this does not imply that economics/finance skills are not valuable for hedge funds; rather, it may be the case that H-1B workers do not provide incremental capabilities in economics/finance relative to those possessed by domestic workers. Examples from our LCA data of H-1B worker STEM positions include applications developer, software engineer, and management analyst.
29 Anecdotally, funds with managers that hold PhDs (e.g., Two Sigma, AQR, Renaissance Technologies, etc.) are more likely to engage in systematic investment strategies. For example, David Siegel, who holds a PhD from the Massachusetts Institute of Technology, runs Two Sigma; Cliff Asness, who holds a PhD from the University of Chicago, helms AQR; and Jim Simons, who holds a PhD from the University of California, Berkeley, founded Renaissance Technologies. Examples from our LCA data of H-1B worker positions at systematic funds include analyst, associate, and vice president.
30 In the matched sample, the average ANOMALY1 and ANOMALY2 for the control funds are 0.486 and 0.685, respectively.
31 In results available on request, we find that hedge funds with emerging markets exposure do not benefit more from greater H-1B visa allocations via lotteries. Therefore, there is no evidence to suggest that H-1B workers, who tend to originate from emerging markets, such as India and China, create value by helping hedge funds pick securities traded in their home countries.
32 We thank Antoinette Schoar for suggesting that we investigate immigrant-led funds.
33 The H-1B workers in our sample are mainly from India (42%) and China (13%). The other notable countries from which H-1B workers originate include Canada (6.4%), and the United Kingdom (3.3%). All other countries each account for less than 2% of the total number of H-1B workers.
34 These results do not imply that the value that H-1B workers generate for hedge funds can be explained by fund management team diversity (Lu et al. 2024). Unlike Lu et al. (2024), we include in the baseline regressions fund fixed effects, which account for the explanatory power of all time-invariant fund characteristics, including fund management team diversity (to the extent that the fund management team does not vary over time). Moreover, even if the compositions of fund management teams change over time, and anecdotally they rarely do, it is not clear why increases in team diversity should coincide with greater allocations of H-1B visas via lotteries given the randomness of the lotteries.
35 We exclude managers from Latin America (0.57%), Sub-Saharan Africa (0.11%), and Australia and New Zealand (0.02%) as managers from each of these regions make up less than 1% of our sample.
References
- (2011) Skills, tasks and technologies: Implications for employment and earnings. Ashenfelter OC, Card D, eds. Handbook of Labor Economics (Elsevier, Amsterdam), 1043–1171.Crossref, Google Scholar
- (2004) Risk and portfolio decisions involving hedge funds. Rev. Financial Stud. 17(1):63–98.Crossref, Google Scholar
- (2009) Role of managerial incentives and discretion in hedge fund performance. J. Finance 64(5):2221–2256.Crossref, Google Scholar
- (2007) Share restrictions and asset pricing: Evidence from the hedge fund industry. J. Financial Econom. 83(1):33–58.Crossref, Google Scholar
- (2014) Macroeconomic risk and hedge fund returns. J. Financial Econom. 114(1):1–19.Crossref, Google Scholar
- (2022) Fund manager skill in an era of globalization: Offshore concentration and fund performance. J. Financial Econom. 145(2):18–40.Crossref, Google Scholar
- (2004) Mutual fund flows and performance in rational markets. J. Political Econom. 112(6):1269–1295.Crossref, Google Scholar
- (2015) Measuring skill in the mutual fund industry. J. Financial Econom. 118(1):1–20.Crossref, Google Scholar
- (2026) Mutual fund flows at long horizons. Rev. Financial Stud. Forthcoming.Google Scholar
- (2014) Fooling some of the people all of the time: The inefficient performance and persistence of commodity trading advisors. Rev. Financial Stud. 27(11):3099–3132.Crossref, Google Scholar
- (2023) The impact of immigration on firms and workers: Insights from the H-1B lottery. Working paper, University of Michigan, Ann Arbor.Google Scholar
- (1999) The causal effect of education on earnings. Ashenfelter OC, Card D, eds. Handbook of Labor Economics (Elsevier, Amsterdam), 1801–1863.Crossref, Google Scholar
- (1997) On persistence in mutual fund performance. J. Finance 52(1):57–82.Crossref, Google Scholar
- (2021) The role of high-skilled foreign labor in startup performance: Evidence from two natural experiments. J. Financial Econom. 142(1):430–452.Crossref, Google Scholar
- (2014) The impact of quantitative methods on hedge fund performance. Eur. Financial Management 20(5):857–890.Crossref, Google Scholar
- (2018) The investment value of mutual fund managers’ experience outside the financial sector. Rev. Financial Stud. 31(10):3821–3853.Crossref, Google Scholar
- (2008) The small world of investing: Board connections and mutual fund returns. J. Political Econom. 116(5):951–979.Crossref, Google Scholar
- (2015) Domeyard: Starting a high-frequency trading (HFT) hedge fund. Harvard Business School Case Study 9-215-036, Cambridge, MA.Google Scholar
- (2023) Hedge funds and public information acquisition. Management Sci. 69(6):3241–3262.Link, Google Scholar
- (1997) Measuring mutual fund performance with characteristic-based benchmarks. J. Finance 52(3):1035–1058.Crossref, Google Scholar
- (2023) The modern mutual fund family. J. Financial Econom. 148(1):1–20.Crossref, Google Scholar
- (2022) Give me your tired, your poor, your high-skilled labor: H-1B lottery outcomes and entrepreneurial success. Management Sci. 68(9):6355–7064.Google Scholar
- (2022) The effects of high-skilled immigration policy on firms: Evidence from visa lotteries. J. Political Econom. 130(10):2501–2533.Crossref, Google Scholar
- (2017) Cultural proximity and the processing of financial information. J. Financial Quant. Anal. 52(6):2703–2726.Crossref, Google Scholar
- (1993) Common risk factors in the returns on stocks and bonds. J. Financial Econom. 33(1):3–56.Crossref, Google Scholar
- (2015) A five-factor asset pricing model. J. Financial Econom. 116(1):1–22.Crossref, Google Scholar
- (1973) Risks, return, and equilibrium: Empirical tests. J. Political Econom. 81(3):607–636.Crossref, Google Scholar
- (2014) Betting against beta. J. Financial Econom. 111(1):1–25.Crossref, Google Scholar
- (2004) Hedge fund benchmarks: A risk based approach. Financial Anal. J. 60(5):65–80.Crossref, Google Scholar
- (2009) Measurement biases in hedge fund performance data: An update. Financial Anal. J. 65(3):36–38.Crossref, Google Scholar
- (2016) Capitalizing on Capitol Hill: Informed trading by hedge fund managers. J. Financial Econom. 121(3):521–546.Crossref, Google Scholar
- (2012) The life cycle of hedge funds: Fund flows, size, competition, and performance. Quart. J. Finance 2(1):1–53.Crossref, Google Scholar
- (2004) An econometric model of serial correlation and illiquidity of hedge fund returns. J. Financial Econom. 74(3):529–610.Crossref, Google Scholar
- (2007) Portfolio performance manipulation and manipulation-proof performance measures. Rev. Financial Stud. 20(5):1503–1546.Crossref, Google Scholar
- (2023) Labor mobility, entrepreneurship, and firm monopsony: Evidence from immigration wait-lines. Working paper, University of North Carolina at Chapel Hill.Google Scholar
- (2017) Man versus machine: Comparing discretionary and systematic hedge fund performance. J. Portfolio Management 43(4):55–69.Crossref, Google Scholar
- (2016) Improving ecological inference by predicting individual ethnicity from voter registration records. Political Anal. 24(2):263–272.Crossref, Google Scholar
- (2019) The fix is in: Properly backing out backfill bias. Rev. Financial Stud. 32(12):5048–5099.Crossref, Google Scholar
- (2013) Quotas and quality: The effect of H-1B visa restrictions on the pool of prospective undergraduate students from abroad. Rev. Econom. Statist. 95(1):109–126.Crossref, Google Scholar
- (2025) On the capital market consequences of big data: Evidence from outer space. J. Financial Quant. Anal. 60(2):551–579.Crossref, Google Scholar
- (2014) U.S. high-skilled immigration, innovation, and entrepreneurship: Empirical approaches and evidence. NBER Working Paper No. 19377, National Bureau of Economic Research, Cambridge, MA.Google Scholar
- (2006) Increasing residual wage inequality: Composition effects, noisy data, or rising demand for skill? Amer. Econom. Rev. 96(3):461–498.Crossref, Google Scholar
- (2018) Balancing covariates via propensity score weighting. J. Amer. Statist. Assoc. 113(521):390–400.Crossref, Google Scholar
- (2000) Hedge funds: The living and the dead. J. Financial Quant. Anal. 35(3):309–326.Crossref, Google Scholar
- (2001) Harvard Management Company (2001). Harvard Business School Case Study 201–129, Cambridge, MA.Google Scholar
- (2024) Diverse hedge funds. Rev. Financial Stud. 37(2):639–683.Crossref, Google Scholar
- (2024) Employer dominance and worker earnings in finance. Rev. Corporate Financial Stud. 13(4):1030–1079.Crossref, Google Scholar
- (1990) Workers versus firms: Bargaining over a firm’s value. Rev. Econom. Stud. 57(3):369–380.Crossref, Google Scholar
- (2011) Do hedge funds trade on private information? Evidence from syndicated lending and short-selling. J. Financial Econom. 99(3):477–499.Crossref, Google Scholar
- (2001) Birds of a feather: Homophily in social networks. Annual Rev. Sociol. 27:415–444.Crossref, Google Scholar
- (2008) The demise of investment banking partnerships: Theory and evidence. J. Finance 63(1):311–350.Crossref, Google Scholar
- (2024)
Labor and corporate finance . Denis DJ, ed. Handbook of Corporate Finance (Edward Elgar Publishing, Northampton, MA), 647–673.Crossref, Google Scholar - Cap on cap off. CIO Magazine (January 1).Google Scholar
- (2003) Liquidity risk and expected stock returns. J. Political Econom. 111(3):642–685.Crossref, Google Scholar
- (2015) Scale and skill in active management. J. Financial Econom. 116(1):23–45.Crossref, Google Scholar
- (2009) Estimating standard errors in finance panel data sets: Comparing approaches. Rev. Financial Stud. 22(1):435–480.Crossref, Google Scholar
- H-1B debate flares as EE jobless rate hits 7%. Electronic Engineering Times (April 14), https://www.eetimes.com/h-1b-debate-flares-as-ee-jobless-rate-hits-7/.Google Scholar
- (2021) Skilled labor mobility and firm value: Evidence from green card allocations. Rev. Financial Stud. 34(10):4663–4700.Crossref, Google Scholar
- (2012) The short of it: Investor sentiment and anomalies. J. Financial Econom. 104(2):288–302.Crossref, Google Scholar
- (2011) The use of propensity scores to assess the generalizability of results from randomized trials. J. Roy. Statist. Soc. Ser. A Statist. Soc. 174(2):369–386.Crossref, Google Scholar
- (2012) The road less traveled: Strategy distinctiveness and hedge fund performance. Rev. Financial Stud. 25(1):96–143.Crossref, Google Scholar
- (2011) Do the best hedge funds hedge? Rev. Financial Stud. 24(1):123–168.Crossref, Google Scholar
- (1980) A heteroskedasticity-consistent covariance matrix estimator and a direct test for heteroskedasticity. Econometrica 48(4):817–838.Crossref, Google Scholar
- (2010) Econometric Analysis of Cross Section and Panel Data (MIT Press, Cambridge, MA).Google Scholar
- (2018) Skilled immigration and firm-level innovation: The U.S. H-1B lottery. Working paper, Harvard University, Cambridge, MA.Google Scholar
- (2025) Skilled labor uncertainty and corporate investment: Evidence from H-1B visa lottery cycles. Management Sci. 71(11):9328–9360.Link, Google Scholar

