
NFT Disruption in Platform Competition: Evidence from Trading Card Collectibles
Abstract
The emergence of blockchain technology has sparked the creation of innovative product categories distinct from traditional ones. However, the literature has yet to address how the entry of new product categories on blockchain-based platforms impacts existing product categories on traditional platforms. This study fills this gap by examining the impact of NBA Top Shot (NTS), a blockchain-based platform offering digital collectibles, on the pricing of sports trading cards (physical collectibles) on eBay. Using detailed transaction data, we find that the entry of NTS led to a 5.2% decline (USD $27.7) in the prices of cards, along with a 4% drop in sales quantity and a 7% decline in sales value, suggesting that NTS cannibalizes demand for physical collectibles. Further analyses suggest that this effect is primarily driven by the demand side, with buyers’ willingness to pay decreasing by 10.3%, whereas sellers’ reservation prices fell by only 5%. We further examine the differences between eBay and NTS to understand how they drive price changes, arriving at three key findings. First, the cannibalization effect is concentrated on cards with digital alternatives rather than causing a broad market shift. Second, cards with less scarce digital counterparts experience sharper price declines. Third, contrary to the conventional belief, high-quality cards, and those sold by reputable sellers suffer steeper price declines, whereas low-quality cards and nonreputable sellers are less affected. Furthermore, we find that the substitution effect is not uniform. It is most salient for high-quality and unpopular cards. In contrast, for low-quality and popular cards, we observe a market expansion effect: NTS appears to attract new collectors to the hobby, increasing demand for affordable, widely recognized cards and even driving price increases in this segment. These findings contribute to our understanding of product-specific competition within platform ecosystems and highlight the nuanced economic effects of blockchain-based platforms. They also provide actionable insights for platform managers, collectors, and policymakers navigating the dynamic landscape of digital and physical collectibles.
History: Ravi Bapna, Senior Editor; Anuj Kumar, Associate Editor.
Supplemental Material: The online appendix is available at https://doi.org/10.1287/isre.2024.0829.
1. Introduction
Online platforms have become an integral part of our daily lives. As of 2023, 9 of the 10 most valuable companies worldwide operate on platform-based business models (Statista 2023). Although much research has focused on platform competition, where rival platforms compete for market share in overlapping services, such as Netflix versus Amazon Prime in streaming or Threads versus X (formerly Twitter) in social media, relatively little attention has been given to product-specific competition within a platform ecosystem. Unlike traditional platform competition, which involves entire platforms competing for users, this study examines a subtler form of platform disruption: the entry of an innovative product category through a new platform that challenges an existing product category on a traditional platform. This is particularly relevant when new product categories are enabled by disruptive technologies, such as blockchain, that radically alter how goods are created, owned, and traded.
One of the most notable recent innovations in this area has been the rise of nonfungible tokens (NFTs). NFTs are cryptographic assets that use blockchain technology to represent claims over specific copies of digital goods.1 When a digital good is minted as an NFT, it acquires attributes such as verifiable ownership, uniqueness, and scarcity.2 As such, NFTs have enabled the emergence of digital collectibles, fundamentally transforming a collectibles market that previously consisted only of physical goods.
In this context, we explore the consequences of the entry of NBA Top Shot (NTS), a blockchain-based platform offering digital NBA collectibles, into a market that had previously consisted exclusively of physical collectibles, specifically sports trading cards. We examine the impact of NTS’s entry on eBay, the traditional platform that dominated sports memorabilia sales. Unlike traditional platform competitors, NTS does not engage in direct platform-level competition with eBay. Instead, it introduces a new and innovative product category, digital (blockchain-based) collectibles, which may compete indirectly by drawing demand from the same pool of National Basketball Association (NBA) and sports memorabilia collectors. Although both platforms appeal to a similar customer base, they differ fundamentally in the format of the goods they offer: physical collectibles on eBay versus digital collectibles on NTS.3
Consequently, we investigate how the entry of digital collectibles affects the value and demand for physical collectibles by examining the impact of the entry of NTS on the market for sports trading card collectibles. Our central research question is as follows: How does the entry of an NFT collectible platform influence product pricing on a traditional platform for physical collectibles?
The answer to this question is not straightforward. On the one hand, we might expect a substitution effect: Collectors could shift spending from sports trading cards to NFTs, reducing demand and driving down prices for cards. On the other hand, a market expansion effect is also possible. NFTs may attract new collectors to the hobby, some of whom might eventually expand their collecting interests to include sports trading cards. This aligns with anecdotal evidence,4 complementing recent scholarly findings suggesting that digitized goods can increase demand for physical counterparts (Nagaraj and Reimers 2023). Thus, the entry of an NFT collectible platform could broaden the overall physical collectibles market rather than simply replacing one product category with another.
The unique nature of this competitive scenario lies not only in the entry of NFTs but also in the vertical integration of the NFT platform, which adds layers of complexity to its impact on the traditional platform’s product prices. Traditional platforms such as eBay primarily act as intermediaries in the exchange of goods, whereas decisions on product creation and scarcity are taken by the producers of the trading cards and the independent sellers. In contrast, vertically integrated platforms such as NTS make decisions on product creation and scarcity themselves, empowering them to shape market dynamics in ways that traditional platforms cannot.
Another layer of complexity is added to the competitive dynamics between these two players due to the different nature of physical collectibles and NFTs. Because NFTs are digital goods, they maintain their product quality over time (i.e., digital goods are durable in that they retain the same form and do not degrade, following the definition of Choi et al. (1997)), rendering product quality verification mechanisms, that are important in physical goods, redundant. Furthermore, blockchain technology enables the platform owner NTS to control that only authentic (digital) collectibles are visible on the market and credibly signal their authenticity and scarcity to buyers, thereby eliminating concerns over fraudulent or unreliable sellers. This renders seller reputation mechanisms, which are common practice in platform intermediaries of physical goods, superfluous.
We empirically study our research question using rich data from eBay around the entry period of NTS. This context is ideal for addressing our research question for several reasons. First, both the physical and the digital collectibles of our setting operate in the same domain (i.e., basketball memorabilia). Second, these goods use similar mechanisms, such as limited edition collectibles and booster packs to encourage existing customers to expand their collections and attract new collectors. Third, there is a substantial overlap in these collectibles’ target customers of NBA enthusiasts and memorabilia collectors.5 By using eBay data, we assess how NTS’s entry affects the prices of physical collectibles on eBay and how differences between the two platforms moderate this impact.
The main empirical challenge in identifying the causal effect of NTS’s entry on the prices of basketball trading cards is determining an appropriate counterfactual. To address this, we use baseball trading cards as a control group in a difference-in-differences (DiD) model, using a unique, self-collected data set from eBay. We enhance our DiD approach by including seller fixed effects, day fixed effects, and card fixed effects. The card fixed effects are generated using a self-developed natural language processing model that identifies the player-year combination for each card.
Our analyses yield four key findings. First, we find that the entry of NTS reduces basketball card prices on eBay by 5.2% (U.S. dollars (USD) $27.7). Notably, this price drop is primarily driven by a decline in buyers’ willingness to pay, rather than a reduction in sellers’ reservation prices. Additionally, the volume of basketball cards sold on eBay decreases by about 4% and the overall sales value declines by about 7%, providing evidence of a substitution effect. This suggests that NTS is cannibalizing demand for sports trading cards on eBay, rather than expanding the market. The total reduction in market value amounts to approximately USD $118.08 million.6
Second, we study the heterogeneity of price changes in terms of product choice and product scarcity. Regarding product choice, we find that the cards of active players, who are the focus of most NFT releases, see the most pronounced price decreases, whereas the prices of cards for retired players remain largely unaffected. Regarding product scarcity, the cards for players with many NFTs available see a price decline of about 10.8%, whereas cards for players with few available NFTs remain unaffected.
Third, we find that the impact of NTS’s entry varies based on product quality and seller reputation. Higher-quality cards experience more substantial price declines, whereas lower-quality cards are unaffected. Similarly, reputable sellers, generally considered more trustworthy, experience greater price declines compared with nonreputable sellers. This contrasts with prior literature (Bar-Isaac 2003, Cabral and Hortacsu 2010, Alyakoob et al. 2022), which suggests that a strong reputation can protect sellers from competition by maintaining profit margins. Our findings present an intriguing counterpoint: Instead of shielding sellers, high product quality and strong reputation may actually increase vulnerability to the disruptive effects of NTS’s market entry.
Fourth, although the average effect of NTS on eBay card prices is negative, we discover certain segments of cards that experience market expansion through the entry of NTS, as evidenced by increased card prices. In particular, low-quality cards by active popular players increase in prices, likely because NTS attracts collectors interested in these players whose cards make an attractive complement to merely owning their NFTs. The plausibility of a market expansion effect is also supported by our survey results in Online Appendix 5.C.
Finally, we conduct a series of robustness checks. We test the parallel trends assumptions with multiple statistical methods. We also conduct tests to ensure that our results are not biased by external factors such as shock date selection, significant sports events, an invalid control group, and selection-based endogeneity. To further strengthen our results, we replicate our main findings using related data from another platform (PWCC) that allows us to confirm our estimates and the validity of the parallel trends assumption over a longer period.7
Our study makes three key literature contributions. First, it extends platform competition research (Zhu and Iansiti 2012, Seamans and Zhu 2014, Zervas et al. 2017, Burtch et al. 2018, Llanes et al. 2019, Sharma and Mehra 2021, Zhu et al. 2021, Farronato and Fradkin 2022, Farronato et al. 2023) by examining how blockchain-enabled goods influence prices of related physical goods on traditional platforms, as well as how the vertically integrated nature of the new platforms, allowing for discretion over product creation and scarcity, shapes these effects. Second, we add to the channel competition literature (Liebowitz 2004, Zentner 2006, Smith and Telang 2009, Danaher et al. 2010, Nagaraj and Reimers 2023) by documenting conditions under which digital goods can simultaneously exert substitution, expansion, and null effects on their physical counterparts while examining how these effects are moderated by product quality. Third, we contribute to work on blockchain integration (Bakos and Halaburda 2022, Tunc et al. 2025) by showing how traditional platform features, such as seller reputation, moderate the impact of blockchain-based platforms. Our findings also carry practical implications. For traditional platforms, such as eBay, our results indicate ways in which they can improve their value proposition to compete with NFT offerings. For collectors, our results can inform them how to adjust their inventory to mitigate or even harness competition by NFTs. Lastly, for policymakers, our results suggest the need to treat certain types of NFTs as collectibles rather than securities and to prioritize standards and consumer education over restrictive regulation.
The remainder of the paper is organized as follows. In Section 2, we discuss related literature, Section 3 presents the context of our study, Section 4 introduces our data set and empirical strategy, Section 5 contains the main results, Section 6 discusses the heterogeneity underlying the main effects, Section 7 presents an analysis of market expansion effects, Section 8 outlines our robustness checks, and in Section 9, we discuss and conclude our work, outlining limitations and presenting avenues for future research.
2. Related Literature
In this section, we review three streams of literature, namely two-sided platform competition, channel competition, and blockchain integration, within which our paper is situated and to which it contributes.
2.1. Two-Sided Platform Competition
There is a growing body of literature on two-sided platform competition studying the impact of disruptive new platforms on traditional platforms and potential actions that these platforms can take to react to or prepare for such entries (Eisenmann et al. 2006, Gawer and Cusumano 2014).
Theoretical research in this field has explored various strategies and outcomes of platform competition. For example, Zhu et al. (2021) study how network characteristics impact the strategic decisions and performance of platforms. Similarly, Llanes et al. (2019) study how new platforms challenge traditional platforms, providing conditions under which new platforms should focus on either product bundling or cooperation with traditional platforms. Sharma and Mehra (2021) explore bundling strategies in contexts where service providers enter product markets. These studies offer a foundation for understanding how platforms interact in competitive landscapes.
Empirical research has shown that new platforms can impact traditional ones in various ways, even when they are not direct competitors. For example, Burtch et al. (2018) study how the entry of gig-economy platforms affects entrepreneurial activity on Kickstarter,8 finding that platform entry reduces entrepreneurial activity, particularly among low-quality campaigns (Burtch et al. 2018). Similarly, Seamans and Zhu (2014) study how Craigslist’s entry into local classified advertising impacted newspaper revenues, leading to reduced ad revenues and an increase in subscription fees. These works underscore how the entry of platforms that do not directly compete with existing platforms and markets can nevertheless have disruptive consequences.
More recent research has explored the heterogeneous impacts of platform entry. Farronato and Fradkin (2022) study how the lodging industry is affected by Airbnb’s entry, finding that hotel revenues are affected differently depending on location. Similarly, Zervas et al. (2017) study Airbnb’s effect on hotel prices and revenues, showing that the impact is smaller for higher-priced hotels and chain hotels.
Our work extends this literature in two ways. First, we fill a gap in the literature by investigating how the introduction of the previously unstudied product category of blockchain-enabled goods impacts its respective physical counterpart. Second, we fill another gap by investigating how the vertically integrated nature, allowing for discretion over product creation and scarcity, of this new type of (blockchain-enabled) competitor can moderate this effect.
2.2. Channel Competition
Our work also relates to the literature on channel competition, which studies how different distribution channels affect each other. In early research, Liebowitz (2004) studies the impact of downloading music files on record sales, finding evidence that MP3 downloads negatively impact physical music sales. Similarly, Zentner (2006) shows that music downloads reduce the likelihood of purchasing music. However, research in different industries yields different results. Smith and Telang (2009) study the effects of television broadcasts on DVD sales and pirated content, finding that broadcasts not only increase pirated content but also boost DVD sales. On a similar note, Danaher et al. (2010) also find no evidence of a substitution effect between digital and physical channels in the movie industry. With their study of the removal of television seasons from a digital platform on DVD sales, they find an insignificant change. Finally, Nagaraj and Reimers (2023) even find that e-books expand the market for physical books enhancing their sales.
Two characteristics emerge from these studies. First, although previous studies typically focus on identical goods across channels (e.g., the same music albums or movies in different format), the products we examine are related but not identical. For example, NTS’ NFTs and basketball trading cards both reference the same players, but they differ in format and in attributes like scarcity. This difference allows for two opposing effects: cannibalization, where customers shift from physical to digital collectibles, or market expansion, where NFT buyers also begin buying sports trading cards. Our study contributes to the literature by investigating which of these dynamics prevails. Second, unlike prior work that assumes homogeneous sellers and identical products, the eBay context we examine involves heterogeneous sellers with varying reputations, and the goods themselves exhibit vertical differentiation (e.g., different levels of card quality). This nuanced context enables us to contribute further to the channel competition literature.
2.3. Integration of Blockchain Technology
A third literature stream related to our work addresses the integration of blockchain technology into online platforms. Given the novelty of blockchain, this body of literature is nascent yet steadily growing. Bakos and Halaburda (2022) study how blockchain technology can help platforms overcome coordination challenges in adoption. They propose issuing cryptographic tokens that allow platforms to trade future for present revenue. Similarly, Gan et al. (2021) study how firms can issue tokens to support financial growth. Tunc et al. (2025) take a different approach and leverage the blockchain to study the effect of resale royalties and find that such royalties decrease sales prices, sales likelihood, and market liquidity. Pun et al. (2021) investigates how blockchain can combat counterfeiting. They find that government subsidies for blockchain adoption for manufacturers can benefit all parties (manufacturer, customers, and society), and can be more effective than simply penalizing counterfeiters. Furthermore, Hofstetter et al. (2024) investigates the effects of scarcity on the prices of NFTs. They find that the positive effect of scarcity on NFT prices can be flipped if scarcity undermines the social value of NFTs. Focusing on blockchain platforms, Li and Zhang (2024) develop a parametric model to examine their development trajectory, accounting for the distinct roles of participants and predicting a three-phase progression. Finally, Zhao et al. (2025) examine how vampire attacks, a distinctive entry strategy in the blockchain ecosystem, affect the operational performance of incumbent platforms.
Our work follows in the vein of these studies, because it is enabled by the integration of blockchain technology into platforms. We examine how the unique characteristics of blockchain-enabled platforms, such as NTS, impact product pricing on a nonblockchain traditional platform like eBay. By analyzing these differences between the two platforms, our study contributes to the growing literature on the integration of blockchain technology into platforms.
3. Study Context
3.1. eBay and Sports Trading Cards
Considering online platforms, eBay is one of the largest players. eBay launched in 1995 and throughout its history, it is characterized by actions aimed at enhancing user experience (e.g., introducing buyer protection programs and authentication services for luxury items). All this led to eBay becoming one of the most visited e-commerce websites (Statista 2021, Similarweb 2024) with a market capitalization of about USD $35.75 billion (as of June 2025). We decided to extract data from eBay due to the platform’s large market share of sports memorabilia sales; estimates show that about 87% of the total U.S. sports memorabilia sales are executed through eBay (Seideman 2018). Because of this large market share, using data from eBay allows us to have a comprehensive view of how the prices of sports trading cards are affected when NFT collectibles become available.
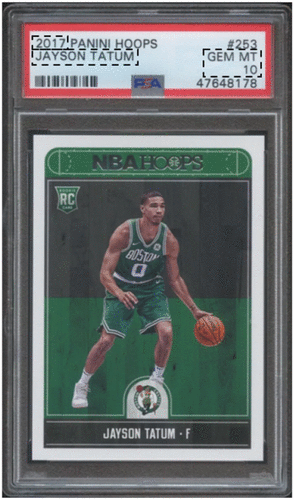
Sports trading cards are palm-sized cards with a picture of a professional sports player. They have long been considered a hobby and a passion for many people, for whom owning a card is similar to owning a piece of sports history or supporting their favorite players and teams. Since the beginning of 2020, the market of trading cards has experienced significant growth, with many card categories growing by at least 370% in sales, whereas single cards have sold for millions of USDs (Beer 2021). Trading cards can now be considered legitimate investments whose returns can outperform the S&P 500 (Seideman 2019). Thus, many collectors consult the service of professional grading companies for a fee, some of which have stopped accepting new orders due to large backlogs (Galloway 2021). An example of a graded basketball trading card is shown in Figure 1; graded baseball trading cards have an identical format. The actual card is included at the bottom, whereas at the top, we can see the card information inserted by professional grading services (PSA’s). The card information (tagged with dashed black rectangles) includes the year that the card refers to (2017), the player that the card depicts (Jayson Tatum), and the official grade that the card received (10 out of 10) by the professional grading service.
3.2. NTS and Moments
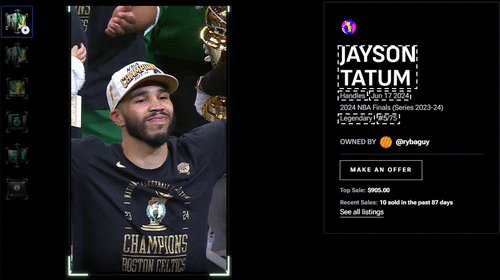
NTS was launched in 2020. NTS allows its users to acquire NFT equivalents of NBA sports trading cards. These NFTs come in the form of copies of short clips from NBA highlights, called “moments.” An example of a moment is shown in Figure 2. The moment is shown on the left side, whereas on the right side, we can see its information. This information (tagged with dashed white rectangles) includes the name of the player whom the moment refers to (Jayson Tatum), the action that the moment shows (Handles), the date when that action was performed (June 17, 2024), the rarity of the moment (Legendary), and the serial number of the moment (5 out of 75).
Unlike traditional online platforms of physical collectibles such as eBay whose role is limited to being intermediaries in the exchange of the goods, NTS has a comprehensive role encompassing both intermediary functions and direct control over moment production (as discussed in Section 3.3). Moments are introduced into the market (i.e., NTS) through a limited number of packs that periodically become available for purchase. Users who buy packs can open them to receive a predefined number of moments that are randomly sampled from a prespecified pool of moments. NTS incentivizes users to build a collection of moments by introducing limited-time challenges that reward users with exclusive moments. Instead of keeping their moments, users can also sell them to other users through the “marketplace” of NTS. There, some NFTs of the most-wanted moments have been sold for hundreds of thousands of USDs.9 NTS opened access to its beta version in October 2020 (Samman 2021), and within about six months, it was reportedly valued at USD $7.5 billion (Reynolds 2021). The revenues of NTS rely not only on the sale of packs but also on a 5% transaction fee that it receives for every transaction between its users. All pack purchases and transactions on NTS are conducted using USDs, unlike other NFT platforms that require users to transact using cryptocurrencies. This allows us to disregard concerns that our paper’s findings may be partly driven by fluctuations in the cryptocurrency market.
NTS was introduced to the public in late 2020 with little to no marketing push, more like an extended beta soft launch. For example, announcements about new packs were only made sporadically, and they were communicated through Discord channels at random times. Absent well-orchestrated coordination, many packs did not sell out immediately.10 Therefore, NTS received only little attention from traders. Yet, finance literature indicates that trader attention is a necessary prerequisite for investments to take place (Barber and Odean 2008). This suggests that NTS drew very limited demand from collectors at that time, and as a result, we would not expect to find any effect of its introduction on the prices of basketball trading cards, at least for the period close to its public launch.
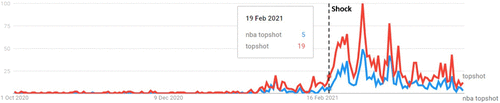
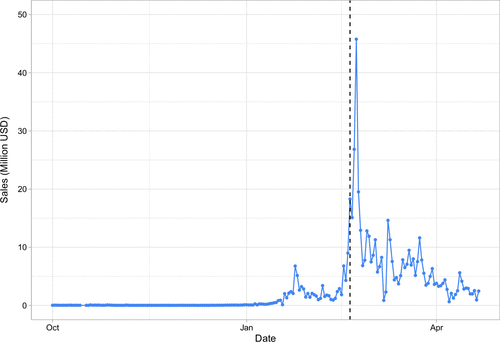
To estimate investor attention (toward NTS) and identify when it reached considerable levels, we take a two-step approach following different literature streams. First, we follow finance literature (Da et al. 2011, Ben-Rephael et al. 2017, Liu et al. 2023) and proxy for investor attention using Google Trends data for related search terms (“nba topshot” and “topshot”). Second, we follow recent information systems (IS) and economics literature (Levy and Mattsson 2019, Bellet et al. 2024) to identify when attention reaches substantial levels and thus inform our choice of the shock date. To do so, we inspect the search terms’ activity for the period from October 1, 2020, up to April 21, 2021 (Figure 3) and find that they started receiving considerable attention only after February 19, 2021. This is likely attributed to the highly-visible media coverage that NTS received from multiple prominent sports and news media outlets because of its innovative nature and the fact that some moments were sold for tens or hundreds of thousands of USDs (such as a LeBron James moment that sold for USD $208,000)11 and due to a heightened attention toward the general NFT sector that translated into record sales.12 For robustness, we corroborate this sudden increase in interest using sales data13 for the same period that we present in Figure 4. Therefore, we identify this as the entry date of NTS (hereinafter called “shock date”) to evaluate how the entry of NTS affects the market of sports trading cards. In Online Appendix 1.C, we also test the sensitivity of our main results to the choice of our shock date, and we find that they are insensitive to the choice and remain consistent.
Naturally, one might be concerned that our results may be an artifact of our determination of the shock date. This is a valid concern, as other factors that fall within our observation window and are chronologically close to our shock date may impact both attention peaks and trading card price changes. Such factors can include important and popular sports calendar events such as the U.S. tournament of the top men’s college basketball teams (National Collegiate Athletic Association March Madness) or the start and finish of the sports seasons. In the case that we fail to acknowledge them, we would erroneously attribute our findings to the shock date, instead of these confounding factors. To address these concerns, we conduct a series of robustness checks (available in Online Appendix 1.A, where we also discuss the plausibility of alternative events as drivers of our main results), none of which support that significant sports events or sports seasonality are confounding factors in our analysis.
3.3. Platform Comparison
In our study, we investigate how product pricing on a traditional platform (e.g., eBay) is impacted by the entry of an NFT platform. Unlike typical platform competition that involves rival platforms fighting for overall market share, the scenario we study is subtler. NTS does not compete directly with eBay as a whole but introduces a new product category (digital collectibles)14 that operates alongside physical collectibles in the same ecosystem. This situation offers a unique opportunity to explore how a new and innovative product category competes with an existing one. Our research hinges on the novel dynamics between a traditional platform such as eBay and a vertically integrated blockchain-enabled platform like NTS, each offering similar goods but in a distinct format.
One may be skeptical about comparing these platforms given two differences between them. The first is that eBay does not produce the cards itself because this task is undertaken by other organizations, whereas NTS produces the moments itself. Although this complicates investigating the effect of NTS on future cards to be printed due to potential reaction by card producers, which is beyond the scope of our paper, it does not prevent us from investigating the effect of NTS on already printed cards. The second is that eBay cannot directly control what goods are displayed in its marketplace compared with NTS, which can control that via its vertically integrated nature. Regarding this, we note that we restrict our analyses to sports trading cards that underwent rigorous authentication15 and are subject to protection mechanisms16 that are enabled for this product category. These mechanisms parallel the quality control that NTS has over the product display in their market. Consequently, the differences between eBay and NTS are unlikely to undermine the suitability of this setting for addressing our research questions.
However, despite the above arguments, there are several key differences that inform our subsequent analyses. We outline them in Figure 5 with a particular focus on the differences pertaining to our setting, which revolves around sports trading cards.
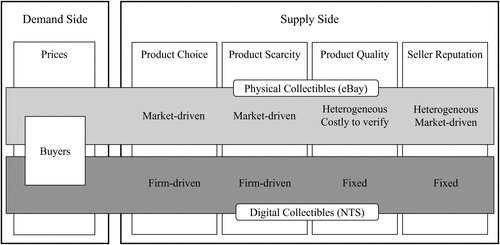
3.3.1. Demand Side.
On the demand side, both platforms cater to a similar customer base who are interested in either physical or digital collectibles. Our survey results17 show that many collectors are interested in both physical and digital basketball collectibles, indicating substantial overlap between these two groups of collectors.
3.3.2. Supply Side.
Four key differences between eBay and NTS emerge on the supply side due to NTS’s blockchain foundation and vertical integration. These differences provide crucial insights into how digital collectibles may impact product pricing for physical collectibles and provide the guiding structure for our empirical investigation.
3.3.2.1. Product Choice.
Unlike eBay, which acts solely as an intermediary for independent sellers and relies on these sellers to supply the platform with products (Tiwana et al. 2010), NTS is a vertically integrated platform. This allows NTS to transcend the limitations of an intermediary and make strategic decisions about which players to feature as NFTs and when to make these available to collectors, whereas eBay’s product offerings are market driven.
3.3.2.2. Product Scarcity.
Blockchains enable the concept of scarcity for NFTs, namely that their number of copies are fixed and immutable.18 NTS’s vertical integration and blockchain-based nature enable making strategic decisions on how many copies of each NFT to create, making scarcity a firm-driven decision. In contrast, eBay relies on independent sellers for product supply, leaving scarcity as an, at least partially, market-driven factor in addition to the decisions of card producers.
3.3.2.3. Product Quality.
Physical goods on eBay, such as trading cards, may degrade over time due to handling and storage, introducing condition-based quality19 variation, which affects price (Dewan and Hsu 2004). For this reason, third-party grading services provide quality certification, influencing price. NFTs, however, are digital and hence homogeneous in quality following the definition of Choi et al. (1997), eliminating the need for costly third-party verification.
3.3.2.4. Seller Reputation.
Traditional platforms such as eBay rely on market-driven seller reputation metrics to build trust (Resnick and Zeckhauser 2002). Trust is essential to absorb any residual concerns over authenticity and product delivery. However, blockchain-enabled platforms such as NTS harness the blockchain to ensure the authenticity of the products displayed, prevent counterfeiting, and guarantee instantaneous product transfer, making reputation systems redundant.20
In Section 6, we investigate how these platform differences shape the heterogeneity of our main effect.
4. Data and Empirical Strategy
To examine the impact of the entry of the NFT platform (NTS) on the prices of sports trading cards sold on eBay, we scraped data of past sold listings from eBay. Our data set includes 958,377 graded21 basketball (treatment group) and baseball (control group) sports trading cards that were sold between January 14, 2021, and March 23, 2021, providing a balanced time frame around the shock date (36 days before and 33 days after). We use a narrow observation window given our focus on the entry effects of NBA Top Shot. To address concerns about the longevity of our results, we test our main results using another data set with a wider observation window. This analysis is available in Online Appendix 1.B.
In selecting a counterfactual to basketball cards, we follow recent IS literature that leverages a horizontally differentiated product or service as the control group in a difference-in-differences setting (Nian et al. 2021, Foerderer et al. 2025). After evaluating different sports cards as potential counterfactuals, we selected baseball cards because they lend themselves favorably as a control group for several reasons. They are similar in popularity, trade volume, as well as the customer base they address, and they are also mainly traded on eBay. Yet, they refer to a different sport and are thus less likely to be affected by the entry of NTS.22 We provide evidence supporting this assumption in Online Appendices 1.D.3 and 1.E, where we investigate how the entry of NTS affects the prices of baseball cards. To address any remaining concerns, we implement an alternative identification strategy where we only analyze basketball cards and construct the control group via a look-ahead sampling strategy (Bapna et al. 2018, Jung et al. 2019). The results are available in Online Appendix 2.B, and they support the validity of our main results.
For each card in our data set, we collected the following information: the title (as listed by the seller), the sale date, the sold price, the card’s grade (if available), the number of bids received (if any), the seller’s feedback score, and additional product details (provided by the seller) that may or may not have been filled by the seller. Descriptive statistics of the basketball and baseball cards in our sample are summarized in Table 1.
|

Table 1. Descriptive Statistics
| Card | Variable | N | Mean | Median | Standard deviation | Minimum | Maximum | Missing |
|---|---|---|---|---|---|---|---|---|
| Basketball | Sold Price | 419,499 | 508.695 | 75 | 6,586.162 | 0.010 | 3,750,000 | 0 |
| Number of Bids | 419,499 | 8.389 | 1 | 12.665 | 0 | 255 | 0 | |
| Card Grade | 419,499 | 9.161 | 9 | 0.984 | 1 | 10 | 6,673 | |
| Seller Feedback Score | 419,499 | 112,817.600 | 2,542 | 225,960.400 | 828,213 | 0 | ||
| Baseball | Sold Price | 538,878 | 187.196 | 30 | 1,845.777 | 0.010 | 950,000 | 0 |
| Number of Bids | 538,878 | 4.726 | 0 | 9.067 | 0 | 174 | 0 | |
| Card Grade | 538,878 | 8.242 | 9 | 2.113 | 0.500 | 10 | 19,768 | |
| Seller Feedback Score | 538,878 | 101,969.800 | 6,382 | 194,233.000 | 831,516 | 0 |
Our identification strategy leverages the entry of NTS (the shock date) and the use of basketball and baseball cards as treatment and control groups, respectively, to study how the launch of NTS affects prices on eBay. We implement a DiD model using the following specification:
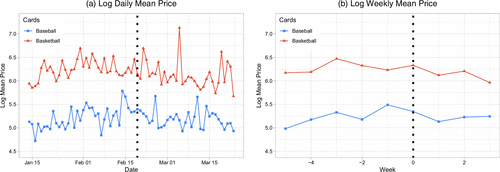
Before implementing our DiD model, we check the validity of the parallel trends assumption by visually inspecting the average log prices of cards over time. We present the average log prices per day and the average log prices per week (with the shock date being the first day of Week 0) in Figure 6, (a) and (b), respectively. The pretreatment trends suggest no significant violations of the parallel trends assumption. We supplement this visual check with formal statistical tests that are discussed in Section 8, all of which confirm that the parallel trends assumption holds.
5. Main Results
5.1. How Does the Entry of NTS Affect Prices?
The results of the model specified in Equation (1) can be seen in the first column of Table 2. The estimate suggests that the entry of NFTs reduces the price of the respective physical goods by about 20%. We enrich this specification in four ways and report the estimates in the same table. First, we include seller fixed effects (column (2)), and we see that the price reduction is now estimated at about 5%; this is a reduction of about USD $27.7, considering that the mean raw price of the sold basketball cards was about USD $534.14 before the shock date. Second, we also include day fixed effects (column (3)), and we find that the estimate remains almost identical. Third, for every card sold at day t, we control for the total cards of the same sport that were sold in the (time) interval (we call this a “rolling supply estimate”). This allows us to additionally control for potential supply-side reactions to the NFT entry. Because of the nature of this control, we limit our sample to the interval for which we have five days of lagged sales and five days of lead sales. Thus, we analyze listings sold from January 19, 2021, up to March 18, 2021. The estimate is shown in column (4), where we see that the reduction changes to 4.7%.
|
Table 2. Main Effects
| Log price | ||||||
|---|---|---|---|---|---|---|
| (1) | (2) | (3) | (4) | (5) | (6) | |
| −0.209*** | −0.052** | −0.052*** | −0.047*** | −0.047*** | −0.055** | |
| (0.042) | (0.020) | (0.020) | (0.018) | (0.018) | (0.025) | |
| Seller fixed effects | No | Yes | Yes | Yes | Yes | Yes |
| Day fixed effects | No | No | Yes | Yes | Yes | Yes |
| Rolling supply estimate | No | No | No | Yes | Yes | Yes |
| NTS popularity | No | No | No | No | Yes | Yes |
| Meme stocks prices | No | No | No | No | No | Yes |
| Cryptocurrency prices | No | No | No | No | No | Yes |
| Adjusted R2 | 0.050 | 0.638 | 0.638 | 0.641 | 0.641 | 0.642 |
| Observations | 958,377 | 958,377 | 958,377 | 819,877 | 819,877 | 728,138 |
Note. In all specifications, we cluster the standard errors at the seller level.
*p < 0.1; **p < 0.05; ***p < 0.01.
Fourth, we fully saturate our model with seller fixed effects, day fixed effects, the rolling supply estimate, and the daily number of buyers in NTS (a proxy for NTS’s popularity). The estimate (shown in column (5)) remains similar to that of column (4). Finally, in column (6) we control for the closing prices of speculative stocks (GameStop and AMC, also known as “meme stocks”)23 and cryptocurrencies (Bitcoin, Ether, Ripple, Cardano, Binance Coin, and FLOW) as proxies for the speculative interest of investors. The coefficient estimate remains consistent (p < 0.024), which indicates that our results are not driven by a temporary increase in speculative interest. We continue our analyses using the specification of column (3), which allows us to keep our full sample.
5.1.1. Card Fixed Effects via Product IDs.
To ensure that unobserved, time-invariant card characteristics (e.g., star players or high-demand years) do not bias our estimates, we control for card fixed effects. Unlike many other product categories on eBay, sports collectibles lack unique product identifiers (IDs) (Hui et al. 2016). To overcome this challenge, we developed a natural language processing (NLP) model that assigns product IDs to each card,24 based on the eBay listing’s information, and additional player information that we scraped from two external sources.25 Our model allows us to assign product IDs (i.e., card ID) to about 87% of the listings, flagged as “ID-Valid.” More details on the model are provided in Online Appendix 3.A.
We rerun our DiD specification for ID-Valid listings, once without controlling for card fixed effects and once while controlling for them. The results are shown in columns (1) and (2) of Table 3, and they remain consistent with our main results.
|
Table 3. Specifications for ID-Valid Listings
| Log price | ||
|---|---|---|
| (1) | (2) | |
| −0.058** | −0.066*** | |
| (0.023) | (0.025) | |
| Seller fixed effects | Yes | Yes |
| Day fixed effects | Yes | Yes |
| Card fixed effects | No | Yes |
| Adjusted R2 | 0.643 | 0.754 |
| Observations | 834,874 | 834,874 |
Notes. In both specifications, we analyze only the “ID-Valid” listings and we cluster the standard errors are clustered at the seller level. ID-Valid, listings with exactly one identified player.
*p < 0.1; **p < 0.05; ***p < 0.01.
5.1.2. Price Decline: Buyer or Seller Driven?
Next, we aim to uncover whether the reaction of buyers or sellers is the main driver behind the observed substitution effect. To do this, we analyze price changes across different listing formats. On eBay, items can be sold through an “Auction” format, where buyers bid, or a “Buy It Now“ format, where buyers can buy items directly at the seller’s set price (without having to bid). Following Hui et al. (2016), we assume that buyers’ bid function is linear and its slope remains unaffected by the shock. Therefore, the prices of cards sold under the “Auction” format are a function of buyers’ willingness to pay (WTP), whereas those of cards sold under the “Buy It Now” format are a function of sellers’ reservation prices (RPs). Thus, by running our DiD specification for each listing format, we can estimate (1) the individual effect of the shock on buyers’ WTP and (2) the individual effect of the shock on sellers’ RPs. We expect that sellers will react similarly to buyers in that if buyers are willing to pay less, sellers will lower their RPs. This would be reflected by a decline in the prices of basketball cards sold under the Auction format and a decline in the prices of basketball cards sold under the Buy It Now format. We present these results in columns (1) and (2), respectively, of Table 4. The estimates indicate that buyers’ WTP drops by about 10%, whereas sellers’ RPs drop by about 5%. Consequently, our evidence suggests that the price changes are driven more strongly by buyer reactions than by sellers, presumably because buyers are substituting sports trading cards for NTS moments.26 In columns (3) and (4), we replicate the analyses inclusive card fixed effects for ID-Valid listings and get similar results.
|
Table 4. Listings Formats: Willingness-to-Pay and Reservation Prices
| Log price | ||||
|---|---|---|---|---|
| Auction | Buy it now | Auction | Buy it now | |
| (1) | (2) | (3) | (4) | |
| −0.103** | −0.050*** | −0.116** | −0.050*** | |
| (0.043) | (0.019) | (0.049) | (0.013) | |
| Seller fixed effects | Yes | Yes | Yes | Yes |
| Day fixed effects | Yes | Yes | Yes | Yes |
| Card fixed effects | No | No | Yes | Yes |
| Adjusted R2 | 0.474 | 0.755 | 0.649 | 0.832 |
| Observations | 423,212 | 535,165 | 371,379 | 463,495 |
Notes. In columns (1) and (2), we analyze all the listings. In columns (3) and (4), we analyze only the “ID-Valid” listings. In all specifications, we cluster the standard errors at the seller level. ID-Valid, listings with exactly one identified player.
*p < 0.1; **p < 0.05; ***p < 0.01.
One might wonder whether the observed difference between the estimates of column (1) and column (2) stems from differences in the types of cards sold under each format. We analyze this in Online Appendix 2.A, and we find found no significant sample differences between cards sold under the two listings formats.27
5.2. How Does the Entry of NTS Affect Sales Quantity and Value?
Thus far, our results suggest that the price decrease on eBay is driven by a demand-side response to the NTS launch. If, in fact, the price decrease on eBay is driven by a decreased demand for physical collectibles, we would also expect to see a decrease in the volume of sold cards on eBay. To investigate this, we use data from all listings aggregated at the date, sport, and seller levels. Our updated DiD specification is similar to specification (3) of Table 2 with several differences. We present the updated specification below:
|
Table 5. Changes in Sold Quantity and Sold Value
| Log quantity | Log value | |||
|---|---|---|---|---|
| All | ID-Valid | All | ID-Valid | |
| (1) | (2) | (3) | (4) | |
| −0.038*** | −0.038*** | −0.072*** | −0.072*** | |
| (0.006) | (0.006) | (0.012) | (0.012) | |
| Seller fixed effects | Yes | Yes | Yes | Yes |
| Day fixed effects | Yes | Yes | Yes | Yes |
| Adjusted R2 | 0.390 | 0.386 | 0.559 | 0.563 |
| Observations | 366,026 | 324,302 | 366,026 | 324,302 |
Notes. The quantity and value measures are constructed by aggregating the observations at the seller, sport, and day level. In columns (1) and (3), we analyze all the listings. In columns (2) and (4), we analyze only the “ID-Valid” listings. In all specifications, we cluster the standard errors at the seller level. ID-Valid, listings with exactly one identified player.
*p < 0.1; **p < 0.05; ***p < 0.01.
Because we find evidence that both the sold prices and sold quantity of cards are affected, we also investigate whether the total value of sold cards is affected. To study this, we change the dependent variable in specification 2 from the sold quantity to the sold value of cards. We run this specification for all listings and for all “ID-Valid” listings and we present the results in columns (3) and (4) of Table 5, respectively. The coefficient estimates suggest that the sales value reduces by about 7.2%, which is consistent with our findings on sold prices and sold quantity.
5.3. Economic Implications
We estimate the economic implications of the entry of NTS on both the basketball trading card market and the daily revenue of platforms, using eBay as an example. According to a proprietary market report from Verified Market Research, the global market value of basketball trading cards was estimated at USD $1.64 billion in 2022. Based on our sales value estimate, the market value reduction during the posttreatment period amounts to approximately USD $118.08 million.
To estimate the impact on platform revenue, we conduct a back-of-the-envelope calculation for eBay. For every sports trading card sold on its platform, eBay keeps 12.35% of the sale up to USD $7,500 per item and 2.35% on the portion exceeding USD $7,500.28 Using this fee structure and a simple DiD analysis, we find that after the shock date, eBay’s revenue from basketball trading cards decreases by about USD $35,801/day, representing a reduction of about 22.5% compared with daily revenue before the shock date.
6. Heterogeneity in the Substitution Effect
In this section, we focus on the four critical dimensions discussed in Section 3.3 (product choice, product scarcity, product quality, and seller reputation) to better understand how these factors influence the competitive dynamics between physical and digital collectibles. Each of these elements plays a key role in shaping demand and price movements in the market.
6.1. Product Choice
Our main results provide initial evidence consistent with the presence of a substitution effect.
However, a key question that arises is whether our results could also point to a general decline in demand for basketball trading cards. In this case, the observed decline in the prices of basketball cards would not be limited to the cards of players for whom NFTs were introduced, but it would extend to the rest of the players. To identify players for whom NFTs were introduced, we use to our advantage that the majority of moments offered by NTS refer to players who are (as of 2021) active in the NBA. If the decline is restricted to the cards of active players, this would substantiate a substitution effect, where collectors are shifting demand from sports trading cards to NFTs, for example, purchasing an NFT of Jayson Tatum29 rather than a card that features him. However, if inactive players’ cards are also affected, it could signal a broader decline in the market for basketball trading cards. Understanding this distinction is crucial for determining whether NFTs are merely substituting specific sports trading cards or driving a more widespread market shift.
To examine this, we separately analyze the price changes of players for whom there are equivalent NFTs available (active players) versus players for whom there were none (inactive players). We combine this information with the output of our natural language processing model (i.e., which player a card refers to) to build a subsample of the ID-Valid listings of active and inactive players. Next, we analyze price changes for sports trading cards of both active and inactive players. The results, presented in columns (1) and (2) of Table 6, show a significant 10.8% price reduction for active players, translating to a decrease of about USD $50.48 per card. In contrast, the price change for inactive players is statistically insignificant, suggesting that the price drop is largely confined to cards with NFT counterparts and supporting the substitution effect.
|
Table 6. Product Choice
| Log price | ||
|---|---|---|
| Active | Inactive | |
| (1) | (2) | |
| −0.108*** | −0.028 | |
| (0.027) | (0.027) | |
| Seller fixed effects | Yes | Yes |
| Day fixed effects | Yes | Yes |
| Card fixed effects | Yes | Yes |
| Adjusted R2 | 0.671 | 0.797 |
| Observations | 374,729 | 460,145 |
Notes. In both specifications, we analyze only the “ID-Valid” listings and we cluster the standard errors at the seller level. In columns (3) and (4), we analyze only the inactive players. ID-Valid, listings with exactly one identified player; HoFer: hall-of-famer.
*p < 0.1; **p < 0.05; ***p < 0.01.
With this identification strategy, one might be concerned about potential biases arising from selection-based endogeneity, such as the possibility that NTS selectively introduces moments for more popular players, which could influence demand independently. To tackle this concern, we implement an alternative identification strategy where we combine trajectory balancing (Hazlett and Xu 2018) with a look-ahead sampling approach (Bapna et al. 2018, Jung et al. 2019). The results are consistent with our main results and available in Online Appendix 2.C, indicating that selection-based endogeneity does not bias our results.
6.2. Product Scarcity
The second characteristic we examine is digital scarcity. In the context of sports trading cards, scarcity is a familiar concept: Card producers can print a large number of some cards and limit the number of others. However, for digital goods, scarcity was not possible prior to the entry of NFTs. Unlike traditional digital goods, NFTs enable scarcity by restricting the number of copies issued on the blockchain. This unique feature allows digital goods to mimic the scarcity that has been associated with physical collectibles. Digital scarcity can add unique dynamics to the pricing of physical goods and influence collectors’ investment decisions. In our case, the impact of moment scarcity on the prices of sports trading cards is not straightforward.
On the one hand, a higher number of available NFTs for a player might divert demand away from sports trading cards (i.e., physical collectibles), because collectors could favor digital alternatives (i.e., moments). In this case, we would expect the prices of cards for players with more available NFTs to experience a larger decline. On the other hand, scarcity is a key driver of value in the collectible market. Just as rare cards in other collectible games, such as Black Lotus (Magic The Gathering) or a first edition Charizard (Pokemon Trading Card Game) are highly sought after, a player with fewer NFTs might be more desirable, possibly steering demand away from the sports trading cards. This could result in a more significant price reduction for players with scarce NFTs.
To explore this, we first identify the basketball players for whom NFTs were released by analyzing publicly available information from NTS. First, we find all the packs30 that were released up to March 23, 2021. Then, for each pack, we extract its available moments,31 as well as information about these moments, such as their title and available quantity (i.e., supply) in every pack. Next, we use our basketball player-name dictionary (described in Section 5.1), to identify the player whom each moment refers to using the moment’s title. This allows us to identify the active (basketball) players with NFTs (using the moments released up to March 23, 2021).
We use the ID-Valid listings of active players in combination with the data set of available moments, we run our DiD specification twice, and we present the results in Table 7. In column (1), we compare baseball cards with basketball cards featuring players whose number of moments is larger than the median number of unique player moments (7,508); we call these “players with many NFTs.” In column (2), we compare baseball cards with basketball cards featuring players whose number of moments is lower or equal to the median (7,508) and larger than 0; we call these “players with few NFTs.” The estimated coefficients indicate that the prices of cards featuring players with many NFTs are more negatively affected (reduced by 10.8%) than those featuring players with few NFTs (insignificant effect). In these specifications, we alleviate concerns over player popularity impacting a player’s total number of NFTs by controlling for card fixed effects. We also replicate the analysis by categorizing the players into quartiles instead of using a median split and we obtain similar results (the results are available in Online Appendix 2.B). It is also important to contextualize our results. For, trading card producers such as Panini, scarcity is preset and physically immutable,32 whereas for NTS, it is code based, publicly auditable, and, until an edition is locked,33 adjustable. Considering this, the fact that NTS can dynamically decide to increase the number of copies for specific moments might further exacerbate the substitution effect for cards.
|
Table 7. Product Scarcity (Only ID-Valid Listings)
| Log price | ||||||
|---|---|---|---|---|---|---|
| Players with many NFTs | Players with few NFTs | Players with many NFTs | Players with few NFTs | Players with many NFTs | Players with few NFTs | |
| (1) | (2) | (3) | (4) | (5) | (6) | |
| −0.108*** | −0.051 | −0.087*** | 0.025 | −0.094*** | 0.007 | |
| (0.030) | (0.035) | (0.031) | (0.037) | (0.030) | (0.038) | |
| Seller fixed effects | Yes | Yes | Yes | Yes | Yes | Yes |
| Day fixed effects | Yes | Yes | Yes | Yes | Yes | Yes |
| Card fixed effects | Yes | Yes | Yes | Yes | Yes | Yes |
| Rolling supply estimate level | No | No | Sport | Sport | Player | Player |
| Adjusted R2 | 0.661 | 0.717 | 0.661 | 0.717 | 0.647 | 0.702 |
| Observations | 339,853 | 171,866 | 284,827 | 149,512 | 278,728 | 143,206 |
Notes. In all specifications, we analyze only the “ID-Valid” listings of active players, using baseball cards as the control group, and we cluster the standard errors at the seller level. In columns (1), (3), and (5), the treatment group is cards featuring basketball players whose total number of available moments is greater than the median (7,508). In columns (2), (4), and (6), the treatment group are cards featuring basketball players whose total number of available moments is lower than or equal to the median (7,508) but higher than zero. ID-Valid, listings with exactly one identified player.
*p < 0.1; **p < 0.05; ***p < 0.01.
One might be concerned that in our model we are not accounting for the scarcity of cards. To do this, we replicate the analysis of columns (1) and (2) but we add a control for the scarcity of cards, using the “rolling supply estimate” that we used in Table 2. We construct a rolling supply estimate on the sports (player) level by using the total cards of the same sport (player) that were sold in the (time) interval and, as we discussed, adding this control limits our sample to the interval for which we have five days of lagged sales and five days of lead sales. We replicate our scarcity analysis once adding the first measure of the scarcity of cards (columns (3) and (4)) and once more adding the second measure (columns (5) and (6)) and present the results in Table 7 that follows. As we see the results remain qualitatively similar.
Lastly, one might be concerned that our identification strategy is prone to selection-based endogeneity. This is possible as NTS can decide the scarcity of player moments due to unobserved reasons. Once again, to mitigate such concerns, we use an alternative identification strategy where we combine trajectory balancing (Hazlett and Xu 2018) with a look-ahead sampling approach (Bapna et al. 2018, Jung et al. 2019). The results of this approach are presented in Online Appendix 2.C, and we find no evidence to support these concerns.
6.3. Product Quality
A critical factor influencing the value of trading cards is their quality. As with many physical products, the price of a trading card is largely determined by its condition. Collectors who want to preserve the quality of their cards must handle them carefully (e.g., avoiding direct contact with their hands and investing in protective cases). To signal a card’s quality, collectors often rely on professional grading services such as Professional Sports Authenticator (PSA)34 or Sportscard Guaranty Corporation (SGC),35 which provide a widely respected and trusted measure of quality in the market for trading cards (Tomashoff 2021). However, the grading process can be expensive, time-consuming, and occasionally inaccessible due to backlogs (Galloway 2021).
Unlike trading cards, NFTs are consistent in quality (Choi et al. 1997) and do not require special handling to maintain their condition. A priori, it is unclear, whether high- or low-quality cards are more strongly affected by the entry of NFTs. To illustrate this, we consider a stylized thought experiment where potential buyers face a high and a low-quality card, everything else equal (e.g., price, player, etc.). Why would demand decline more strongly for one or the other group of cards? On the one hand, the entry of NFTs may shift demand away from high-quality sports trading cards, because buyers who value high quality may consider NTS an option associated with greater ease of preserving its condition (and as an extension its quality).36 On the other hand, low-quality cards might be particularly affected by the entry of NFTs. If buyers care little about the future handling effort of cards, high-quality cards are less inferior in quality to NFTs compared with low-quality cards. Hence, everything else equal, instead of buying low-quality cards on eBay, buyers might shift toward buying the NFTs.
To test these competing predictions, we use our data set, where many eBay sellers indicate the professional grades of their cards received from services such as PSA or SGC. We run a DiD specification, examining price changes for higher-quality cards (graded ≥ 9 or higher, considered “mint” and lower-quality cards (graded < 9). The results, presented in columns (1) and (2) of Table 8, show that prices for high-quality basketball cards decreased significantly, whereas the prices of low-quality cards were not statistically significantly affected.37 We replicate the analyses of Table 8 inclusive card fixed effects for ID-Valid listings in columns (3) and (4), and we get similar results. Furthermore, to ensure our findings are not an artifact of the binary split between high- and low-quality cards, we conduct an alternative analysis by adding a three-way interaction between After Shock, Basketball Card, and card grade. This approach produces consistent results, which are available in Online Appendix 2.B.
|
Table 8. Product Quality
| Log price | ||||
|---|---|---|---|---|
| Grade 9 | Grade < 9 | Grade 9 | Grade < 9 | |
| (1) | (2) | (3) | (4) | |
| −0.072*** | 0.049 | −0.075*** | 0.017 | |
| (0.020) | (0.057) | (0.020) | (0.024) | |
| Seller fixed effects | Yes | Yes | Yes | Yes |
| Day fixed effects | Yes | Yes | Yes | Yes |
| Card fixed effects | No | No | Yes | Yes |
| Adjusted R2 | 0.677 | 0.576 | 0.769 | 0.801 |
| Observations | 685,545 | 272,832 | 611,005 | 223,869 |
Notes. In columns (1) and (2), we analyze all the “ID-Valid” listings. In columns (3) and (4), we analyze only the “ID-Valid” listings. In all specifications, we cluster the standard errors at the seller level. ID-Valid, listings with exactly one identified player.
*p < 0.1; **p < 0.05; ***p < 0.01.
Similar to earlier analyses, there may be concerns about selection bias, because product quality can be correlated with other factors such as player status. For example, cards of active players may be of higher quality due to being traded fewer times or due to improved preservation techniques. To address this, we conduct matching on the preshock observations aggregated on the card level. This ensures an effective balancing of the covariates between high- and low-quality cards. After creating a matched sample, we rerun the analysis, and the results, presented in Online Appendix 2.C, show no evidence of selection bias.
6.4. Seller Reputation
Seller reputation is a crucial factor in online platforms, because it helps foster trust between buyers and sellers. On NFT platforms such as NTS, trust issues are minimized through instant delivery, consistent quality of digital assets, and product authenticity guaranteed by the NTS blockchain. However, for physical collectibles, buyers must rely on sellers’ reputations to ensure timely delivery and accurate product quality. Platforms such as eBay have introduced seller feedback score38 as a proxy for seller reputation. This score increases with positive ratings and decreases with negative ones, providing a reputation measure based on past transactions.
Although maintaining reputable sellers is essential for any online platform, it remains unclear who is more strongly affected by the entry of NTS: reputable or nonreputable sellers. To explore this, we consider a stylized thought experiment where potential buyers choose between a high- and a low-quality reputation seller, with all else being equal (e.g., price, card grade, etc.). Why might demand decline more for one type of seller over the other?
On the one hand, reputable sellers might be particularly affected by the entry of NTS, if NTS attracts primarily those buyers who highly value seamless and secure transactions, shifting their demand to a platform that guarantees these attributes. This could be a significant loss for eBay, given the network effects associated with reputable sellers (Binken and Stremersch 2009, Rietveld et al. 2019), which are critical for sustaining buyer trust and platform prosperity. On the other hand, nonreputable sellers could be more vulnerable because seller feedback scores on platforms like eBay typically shelter reputable sellers from competition and help preserve sales margins (Höner 2002, Bar-Isaac 2003, Cabral and Hortacsu 2010, Alyakoob et al. 2022, Kovbasyuk and Spagnolo 2024). Without a strong reputation, nonreputable sellers may struggle to compete against the trustworthiness and transparency that NTS offers, leading to a greater loss of demand.
In the following, we are going to test these competing predictions. Using eBay’s seller feedback score, we classify sellers with scores above the median (336.5) as eputable and those below as nonreputable. We apply our DiD specification separately and find that listings from reputable sellers experience significant price effects, whereas those from nonreputable sellers are not significantly affected, as we can see from the results in Table 9.
|
Table 9. Seller Reputation
| Log price | ||||
|---|---|---|---|---|
| Reputable | Nonreputable | Reputable | Nonreputable | |
| (1) | (2) | (3) | (4) | |
| −0.056** | −0.012 | −0.071*** | −0.035* | |
| (0.022) | (0.021) | (0.027) | (0.019) | |
| Seller fixed effects | Yes | Yes | Yes | Yes |
| Day fixed effects | Yes | Yes | Yes | Yes |
| Card fixed effects | No | No | Yes | Yes |
| Adjusted R2 | 0.637 | 0.610 | 0.755 | 0.722 |
| Observations | 810,049 | 148,328 | 708,350 | 126,524 |
Notes. In columns (1) and (2), we analyze all the listings. In columns (3) and (4), we analyze only the “ID-Valid” listings. In columns (1) and (3), we analyze the listings of sellers with a seller feedback score greater than the median (336.5 and 325, respectively). In columns (2) and (4), we analyze the listings of sellers with a seller feedback score lower than or equal to the median (336.5 and 325, respectively). In all specifications, we cluster the standard errors at the seller level. Seller Score refers to the Seller Feedback Score.
*p < 0.1; **p < 0.05; ***p < 0.01.
We also include a three-way interaction term between After Shock, Basketball Card, and the seller reputation score, confirming the same outcome. One might worry that the effect is driven by reputable sellers leaving the market and not selling expensive cards on eBay. However, as shown in Online Appendix 1.I, we find no evidence of this. Finally, this analysis is not exempt from concerns over endogeneity and selection issues. Such issues can arise if reputable sellers systematically sell more expensive cards (e.g., cards of higher quality). We alleviate these concerns by conducting matching on the preshock observations aggregated on the seller level. After we build a matched sample of sellers, we use the same specification as the above, and we present the results in Online Appendix 2.C. Our analysis provides no evidence to support that our results on seller reputation are driven by systematic differences between reputable and nonreputable sellers.
The findings of the above analyses are summarized in Table 10 that follows.
|
Table 10. Summary of the Heterogeneous Effects
| Dimensions | Physical collectibles (eBay) | Digital collectibles (NTS) | Price change findings |
|---|---|---|---|
| Product choice | Collectibles feature both active and inactive players. Decisions on which players to release collectibles for and when are undertaken by the card producer. | Collectibles primarily feature active players. Decisions on which players to release collectibles for and when are undertaken by NTS. | The prices of cards featuring active players decline, due to direct competition with NFTs, while those of cards featuring inactive players see insignificant price declines. |
| Product scarcity | Decisions on how many copies of each collectible to produce are undertaken by card producers. | Decisions on how many copies of each collectible to produce are undertaken by NTS. | The prices of cards featuring players with more NFTs see larger declines, as demand shifts to the more abundant digital options, while cards featuring players with few NFTs see insignificant price changes. |
| Product quality | Condition (i.e., quality) can vary significantly across collectibles due to physical wear and printing imperfections. | Condition (i.e., quality) is consistent across collectibles, as digital items do not degrade in quality. | The prices of high-quality cards experience steeper price declines, while those of low-quality cards experience insignificant price changes. |
| Seller reputation | Reputation is essential for establishing trust between buyers and sellers. | Reputation is less relevant, as blockchain guarantees authenticity and instantaneous transfer. | The cards sold by reputable sellers face greater price declines than those sold by nonreputable sellers. |
7. Market Expansion Effect
Thus far, our empirical results suggests that, on average, NTS exerts a substitution effect on the market for physical collectibles. Although this might be expected, it is possible that this average effect masks substantial heterogeneity across card segments and that, for some cards, NTS might even exert a market expansion effect.
A market expansion effect may be present because of new collectors. The emergence of NFTs can attract new collectors to start collecting and investing in sports trading collectibles. Even though these collectors initially become immersed solely into NFTs (digital collectibles), they may decide to also start collecting sports trading cards (physical collectibles). This demand shift from digital to physical collectibles could give rise to market expansion effects. The presence of such effects would translate into price increases for specific subsets of sports trading cards that are more likely to attract NFT collectors.
To identify these subsets, we need to think about the players that NFT collectors may be interested in. As discussed earlier, NTS produced moments primarily for active players which means that collectors drawn to NTS are likely fans of these (active) players. Hence, even if these collectors own NFTs of their favorite players, they may develop a desire to also collect sports trading cards of the same players. Because popular players are fan favorites who will be a more attractive addition to a collection, complementary to moments, we expect the cards of active, popular players to exhibit sharper price increases compared with the rest (i.e., unpopular players).
However, not all cards of all players will necessarily experience this market expansion effect. As we discussed in Section 6.3, card quality plays a central role crucial role in collectors’ decisions and is a key driver of card valuations. This interaction between player popularity and card quality creates unique dynamics in the market. Therefore, in this section, we analyze our data along these two dimensions.
To identify popular NBA and Major League Baseball (MLB) players, we used two lists compiled by ESPN, which is one of the most renowned sports media organizations. These lists contain the historically (i.e., includes both active and inactive players) top MLB and NBA players. The list of MLB players39 includes 100 players, whereas the respective NBA list includes 75 players;40 thus, to make the lists consistent, we kept the top 75 players from each of them. We use these lists to split players into popular and unpopular as follows: Any NBA (MLB) players that is listed in the top 75 NBA (MLB) players’ list is considered as popular; otherwise, they are considered unpopular.
Our expectations are as follows. First, as shown in Section 6.3, the substitution effect is particularly pronounced for high-quality cards. Consequently, we expect a substitution effect for these cards here as well. In this case, we also study the dimension of player popularity, and we expect this effect to be stronger for unpopular players, as high-quality cards of popular players may serve as an investment vehicle that can preserve or increase their value over time, therefore shielding them from substitution effects. Second, as we discussed before, NFT collectors may develop a desire to also collect cards of their favorite players. If so, then these new collectors, often cautious about investing heavily at first,41 are likely to buy low-quality cards (of their favorite players) because they are more affordable.42 This influx of new budget-conscious collectors could increase the prices of these lower-quality cards of popular players.
We use our main specification for each combination of card player popularity and card quality and we present the results in Table 11 that follows. The findings from columns (1) and (2) indicate that the prices of high-quality cards of popular players remain unaffected, whereas those of unpopular players are negatively affected. This is in line with our expectation that the substitution effect may be more pronounced for unpopular players and that high-quality cards of popular players may serve an investment that preserves its value and is protected from the substitution. The results in columns (3) and (4) also confirm our expectations for low-quality cards: We see a statistically significant increase in prices for low-quality cards of popular players in column (3), providing evidence for market expansion. This evidence is also in line with our survey results (presented in Online Appendix 5.C) that suggest that collectors of moments my also develop an interest for sports trading cards. Yet, for low-quality cards of unpopular players, we do not find a significant estimate.
|
Table 11. Active Players: Popularity and Quality Analysis
| Log price | ||||
|---|---|---|---|---|
| Grade 9 | Grade 9 | Grade < 9 | Grade < 9 | |
| Popular | Unpopular | Popular | Unpopular | |
| (1) | (2) | (3) | (4) | |
| 0.018 | −0.135*** | 0.280*** | −0.074 | |
| (0.047) | (0.028) | (0.081) | (0.060) | |
| Seller fixed effects | Yes | Yes | Yes | Yes |
| Day fixed effects | Yes | Yes | Yes | Yes |
| Card fixed effects | Yes | Yes | Yes | Yes |
| Adjusted R2 | 0.681 | 0.685 | 0.636 | 0.588 |
| Observations | 64,987 | 287,059 | 7,348 | 15,335 |
Notes. In all specifications, we analyze only the “ID-Valid” listings of active players and we cluster the standard errors at the seller level. ID-Valid: listings with exactly one identified player.
*p < 0.1; **p < 0.05; ***p < 0.01.
There might be lingering concerns that our estimates are affected by endogeneity or selection issues. To alleviate such concerns, we conduct matching on the preshock observations aggregated on the card level, and we do so separately for high- and low-quality cards. Using this matched sample, we re-estimated our models and found that the results remained consistent. The results are available in Online Appendix 2.C and show that the coefficient estimates remain qualitatively similar, providing no evidence to support that our estimates are plagued by endogeneity or selection issues.
8. Robustness Checks
We conducted a series of robustness checks (presented in the Online Appendix) to address potential concerns regarding our empirical analyses. An overview of all robustness checks is provided in Table 12.
|
Table 12. Overview of Robustness Checks
| Concern | Check | Online appendix |
|---|---|---|
| Shock date validity | ||
| Is the focal estimate merely a seasonal effect? | Test for Granger causality | 1.A |
| Control for major sports events | 1.A | |
| Exclude the period of a major sports event | 1.A | |
| Employ trajectory balancing and look-ahead sampling only on basketball cards | 2.C.1 | |
| Analyze the eBay data for the same time window but a year later (2022) | 1.D.2 | |
| Use basketball cards from 2022 as the control group | 1.D.2 | |
| Analyze the period after the shock | 1.H.1 | |
| Does the shock date selection affect the focal estimates? | Analyze PWCC data from June 19, 2020, to April 9, 2021 | 1.B |
| Analyze the results by trying out 40 different days around our original shock date | 1.C | |
| Control group validity | ||
| Are the treatment and control group too different? | Propensity score matching | 1.D.3 |
| Are baseball card prices affected by the NTS introduction? | Before-after analysis of baseball card prices | 1.E |
| DiD analysis following Eichenbaum et al. (2024) with baseball card data from 2021 and 2022 | 1.E | |
| Are the results driven by an incompatible control group? | Employ trajectory balancing and look-ahead sampling only on basketball cards | 2.C.1 |
| Use basketball cards from 2022 as the control group | 1.D.2 | |
| Focal estimate: Potential biases | ||
| Is the focal estimate driven by endogeneity and selection issues? | Employ trajectory balancing and look-ahead sampling only on basketball cards | 2.C.1 |
| Is the original observation window too narrow to have reliable results? | Analyze PWCC data from June 19, 2020, to April 9, 2021 | 1.B |
| Is the focal estimate biased by serial correlation between card prices and unobservables? | Randomized treatment test following Bertrand et al. (2004) | 1.F |
| Is the focal estimate affected by cards listed before and sold after the NTS introduction? | Exclude these cards in our main model | 1.G |
| Does the focal estimate diminish in the short-term and in the long-term? | Analyze the period after the shock and eBay 2022 data | 1.H |
| Is the focal estimate affected by sellers exiting the market? | Analyze the listings of sellers who are present after the shock | 1.I |
| Is the focal estimate affected by outliers? | Exclude outliers in our main model | 1.J |
| Listing formats and moderators | ||
| Are the items listed under the two different formats inherently different? | Analyze the differences of the two samples | 2.A |
| Are the results robust to other specifications of product scarcity, product quality, and seller reputation? | Analyze the subsample with quartiles analysis and three-way interaction terms | 2.B |
| Are the results driven by endogeneity and selection issues? | Employ trajectory balancing and look-ahead sampling only on basketball cards | 2.C |
| Parallel trends | ||
| Does the data satisfy the parallel trends assumption? | Run the three parallel trends assumption tests | 4.A |
First, we validate the robustness of the parallel trends assumption with three tests. The first is a placebo test where we analyze only the observations before the shock date, where we split our preshock time into two equal parts and use a placebo shock date in the middle of that window (Foerderer et al. 2025). The results, reveal an insignificant estimate, suggesting no violation of the parallel trends assumption. Second, we implement a fully flexible DiD model with treatment lags and leads (Burtch et al. 2018), which also shows no violation of the parallel trends assumption. Lastly, we regress the outcome variable on the treatment indicator interacted with a time trend for the pretreatment period (Angrist and Pischke 2009). The results show minimal pretrend differences (only significant at the 10% level), which become insignificant after removing observations close to the shock date. These tests confirm the robustness of the parallel trends assumption.
Second, we test the validity of our chosen shock date to ensure that it, rather than seasonal effects, drives the observed effects. To do so, we (1) control for major sports events, (2) test an alternative identification strategy, (3) collect data from the same time window a year later, (4) analyze the postshock period more granularly, (5) use data from another platform (PWCC) that provides an extended time window, and (6) test alternative shock dates within the same observation window.
Third, we validate the control group to confirm it is comparable to the treatment group (prior to the shock) and that it remains unaffected by the shock. For that, we (1) use propensity score matching to create comparable samples of basketball and baseball cards, (2) test and ensure that the control group is unaffected by the shock, and (3) employ an alternative identification strategy using only basketball cards with a look-ahead sampling strategy (Bapna et al. 2018, Jung et al. 2019).
Fourth, we address concerns that the focal estimate might be biased due to factors such as selection-based endogeneity, a narrow observation window, and sellers exiting the market, while we test whether the focal estimate diminishes or reverts over time.
Lastly, we test the robustness of our heterogeneity analyses to other specifications, leveraging alternative identification strategies to mitigate concerns about selection bias or endogeneity affecting these estimates.
9. Discussion and Conclusion
9.1. Summary of Findings
In this work, we examine how the launch of a blockchain-based platform, NTS, impacted the prices of physical collectibles on a traditional platform: eBay. By focusing on the entry of NTS (that offers digital collectibles, i.e., NFTs) as an exogenous shock, we analyze the effects on the market for sports trading cards using data from eBay.
We find that the entry of NTS led to a 5.2% reduction in basketball card prices on eBay (equivalent to USD $27.7). This price decline is driven primarily by reduced buyers’ willingness to pay rather than sellers’ reservation prices, indicating a substitution effect as collectors shift demand from physical to digital collectibles. Additionally, the sales volume fell by 4% and sales value by 7%, resulting in an estimated market value loss of approximately USD $118.08 million.
Next, we explore how NTS’s decisions on product choice (e.g., focusing on active players) and product scarcity (e.g., the number of NFTs available per player) shape these price changes. We find that cards of players with NFTs face significant price declines, whereas those of players without NFTs remain unaffected. Additionally, cards of players with many NFTs (low scarcity) see sharper price drops compared with cards of players with fewer NFTs (high scarcity).
Furthermore, although prior literature (Höner 2002, Bar-Isaac 2003, Cabral and Hortacsu 2010, Alyakoob et al. 2022, Kovbasyuk and Spagnolo 2024) typically suggests that product quality and seller reputation protect against competition, we find the opposite: High-quality cards and those sold by reputable sellers suffer larger price drops, suggesting these attributes can increase vulnerability to disruption from NTS platforms.
Finally, we also find that the substitution effect is not uniform. It is most pronounced for high-quality cards of unpopular players, which experience the steepest price declines as collectors shift toward their digital alternatives. In contrast, for low-quality cards of popular players, we observe a market expansion effect: NTS appears to attract new collectors to the hobby, boosting demand for affordable, widely recognized cards and even leading to price increases in this segment.
Collectively, these findings highlight the complex and sometimes unexpected ways that NFT platforms reshape competition in collectible markets, blending substitution effects with potential market expansion.
9.2. Contributions to the Literature
Our study contributes three key contributions to the existing literature.
First, we contribute to the literature on platform competition (Zhu and Iansiti 2012, Seamans and Zhu 2014, Zervas et al. 2017, Burtch et al. 2018, Llanes et al. 2019, Sharma and Mehra 2021, Zhu et al. 2021, Farronato and Fradkin 2022, Farronato et al. 2023). Work in this literature has primarily focused on classical platform competition, consistent with the notion of Parker et al. (2017) of an inverted firm, to investigate how platforms interact in competitive landscapes (Llanes et al. 2019, Sharma and Mehra 2021, Zhu et al. 2021) and how their entry can disrupt existing players both directly (Zervas et al. 2017, Farronato and Fradkin 2022) and indirectly (Seamans and Zhu 2014, Burtch et al. 2018). Our study contributes by examining (1) how a new, and until now unstudied, product category of blockchain-enabled goods affects a related category of physical goods (sports trading cards) on a traditional platform and (2) how the vertically integrated nature of the new competitor can shape these effects. Specifically, we find that blockchain-enabled goods affect the prices of physical ones and that the product choice enabled by the vertical integration of the blockchain-based platform shapes this effect.
Second, we contribute to the literature on channel competition between digital and physical goods interaction by studying the dynamics between NFTs and their physical counterparts (Liebowitz 2004, Zentner 2006, Smith and Telang 2009, Danaher et al. 2010, Nagaraj and Reimers 2023). Although previous work in this area has found substitution (Liebowitz 2004, Zentner 2006), expansion (Smith and Telang 2009), or no effects (Danaher et al. 2010) from digital to physical goods, in isolation, we document all three effects occurring simultaneously within the same setting. Furthermore, by leveraging granular product-level characteristics, we can characterize potential drivers responsible for the three effects. It bears note that, unlike previous studies that focus on identical goods across digital and physical channels, our study looks at different channels offering related but distinct goods. Moreover, although previous studies dealt with consistent product quality across channels (e.g., movies or songs), the heterogeneous physical quality of cards in our setting enables us to shine a light on how product quality moderates the competition between digital and physical goods.
Third, we contribute to the literature on the integration of blockchain technology into online platforms (Bakos and Halaburda 2022, Tunc et al. 2025). In our study, traditional platforms display heterogeneity in product quality and seller reputation; this distinction allows us to examine how these factors moderate the impact of blockchain-based platforms and deepen our understanding of how blockchain technology influences competition between digital and physical goods. A key takeaway is that, although previous literature found that reputation and quality can provide a competitive advantage (Höner 2002, Bar-Isaac 2003, Cabral and Hortacsu 2010, Alyakoob et al. 2022, Kovbasyuk and Spagnolo 2024), they may be a liability for sellers when competing with NFT goods. Our study also adds to the nascent scholarly understanding of the competitive effects of digital product scarcity (Hofstetter et al. 2024). We unveil that, as digital scarcity decreases, the substitution effects to physical competitor products increase.
Last, as part of our commitment to open science, we have made our code for producing product IDs publicly available as an R package.43 This tool enables researchers to apply our natural language processing approach in other studies of collectibles markets, supporting more rigorous and transparent research in this growing area.
9.3. Managerial Implications
Our findings offer several meaningful managerial implications.
First, our findings can inform traditional platforms and NFT platforms alike. Traditional platforms are alerted about the threat posed by NFT platforms so that they can reevaluate and adapt their services to better match those of NFT platforms. Traditional platforms often lag behind NFT ones in key areas such as ensuring product quality and minimizing seller-related risks. This might prompt dissatisfied buyers to gravitate toward the more technologically advanced NFT platforms. If reputable sellers see a continued drop in earnings due to this shift, they may exit the market, potentially triggering a cascading effect on the traditional platforms. To counteract this, traditional platforms need to evolve by introducing features that neutralize the advantages of NFT platforms, such as secure storage, seamless transfers, and enhanced quality assurance. eBay has already taken steps in this direction. In 2022, it launched the “eBay Vault” service,44 focusing on secure storage and authenticity for trading cards. Two years later, eBay partnered with PSA to integrate its vault into PSA’s own vault.45 Additionally, eBay introduced an authentication service46 and integrated a functionality to view the available population of specific trading cards47 through partnerships with professional grading companies like PSA, aiming to position itself as a one-stop-shop marketplace for physical collectibles. eBay’s acquisition of the NFT platform “KnownOrigin” further underscores its proactive approach to addressing the rise of NFTs in the collectible space (Malik 2022). For NFT platforms like NTS, our findings highlight the strategic importance of product choice and scarcity. By focusing on certain players, and carefully controlling the number of NFTs per player, NFT platforms can maximize their appeal to collectors seeking digital alternatives with an exclusive edge. Moreover, this selective scarcity can boost demand by creating a sense of exclusivity, thereby enhancing the perceived value of NFTs while broadening their competitive edge in the broader collectible markets.
Second, for traditional platform participants, such as sellers on eBay, our findings suggest several key strategies to mitigate the impact of digital competition from NFT platforms like NTS. First, sellers should strategically adjust their inventory to focus on product segments less impacted by NFT competition, such as cards of certain players or players with fewer NFT copies, which show greater price stability. At the same time, they might also enrich their portfolio with cards that are likely to benefit from market expansion effects, namely low-quality cards of active and popular players. Additionally, sellers of high-quality physical collectibles may need to rethink their value propositions. For example, offering unique attributes, such as limited edition prints, may help differentiate these products from NFTs and reinforce buyer interest. For reputable sellers whose crowd-sourced trust seems to offer less protection against NFT competition, platforms like eBay may need to provide additional support to enhance traditional collectibles’ competitiveness, particularly by leveraging trust and authenticity mechanisms to rival blockchain-backed assurances.
Finally, our findings also carry significant implications for policymakers. Given the increasing interconnectedness between digital and physical collectible markets, it is crucial for regulators to recognize and account for cross-category competition when formulating market regulations. Traditional approaches that separately address digital or physical goods may no longer be sufficient, as emerging blockchain technologies blur these boundaries. These insights are particularly timely in light of the ongoing policy debate surrounding the regulation of cryptographic assets, to which our study can contribute.48 Our findings support the view that certain types of NFTs, such as those issued by NTS, are part of the broader collectibles market, rather than being mere financial securities. This provides an argument to exempt such NFTs from more stringent regulatory oversight applied to securities. This differentiation is important to avoid stifling innovation in the blockchain sector. Rather than regulating these NFTs as securities, policymakers could instead focus on promoting standards that enhance transparency and authenticity across platforms, thereby supporting consumer welfare. Additionally, policies aimed at consumer education would help collectors navigate the evolving market dynamics, enhancing consumer protection and supporting informed participation in digital and physical collectible markets.
9.4. Generalizability
The findings of this study offer insights that may extend beyond the specific context of NTS and eBay, particularly to markets where digital collectibles or assets are emerging alongside established physical counterparts. The substitution effect, where demand shifts from physical to digital goods, may be relevant for collectibles like trading cards, arts, and memorabilia. However, a certain set of factors should be taken into account when evaluating the generalizability of our results to other settings.
First, the NFT platform we investigate is characterized by low technical barriers. This will likely help accelerate user adoption and make it more accessible to a broader audience. In contrast, many other NFT platforms have substantially higher entry barriers in terms of technical requirements.49 Second, at the time of the study, NTS operated entirely using USD, making it possible to trade without having to buy cryptocurrency. This made moments’ prices more robust against cryptocurrency volatility and less complex to users, thus making it more attractive toward a broader user base. Third, our study focuses on platforms that offer goods which are priced accessibly to the average user. In settings such as high-brow physical art (e.g., paintings), the price levels of goods can be higher or digital alternatives may not hold the same appeal. Thus, although our findings indicate broader trends, their relevance varies with platform accessibility and market characteristics.
9.5. Limitations and Future Research
We acknowledge several limitations of our study, which present avenues for future research. First, the NFT platform in our setting, NTS, is co-owned by the NBA, a strong brand that likely facilitated platform adoption. This brand affiliation could affect the extent to which NTS substitutes demand for sports collectibles on eBay and could enhance additional trust and credibility independently of the blockchain itself. Although our research design maintains the internal validity of our econometric analysis by using a carefully selected control group, disentangling blockchain effects from potential brand effects is beyond the scope of this study. Future research could explore other NFT platforms without such brand affiliations to better generalize our findings. Second, although our study contributes to a previously missing perspective on platform competition by examining competitive dynamics between a traditional and a vertically integrated platform, the vertical integration of NTS may limit the generalizability of our results to more typical, nonintegrated NFT platforms. Future research could explore how nonintegrated NFT platforms impact physical goods markets. Third, our data set is limited to cards sold on eBay, allowing us to study price and quantity at equilibrium but restrict our analysis to sold items, excluding unsold listings. Although this approach captures key market dynamics, future studies could benefit from data sets that include listings and unsold items, offering a more comprehensive view of supply-side behavior. Fourth, the shock date used in our DiD framework is researcher chosen rather than externally imposed. Although we justify this decision with previous literature (Levy and Mattsson 2019, Bellet et al. 2024), carefully examine the sensitivity of our results with respect to shock date selection, and test for conditional exogeneity with respect to related sports events, this remains a methodological limitation of our paper. Finally, our observation window does not extend across multiple years, limiting the extent to which we can assess long-term impacts. Although we estimate longer-term impacts in Online Appendices 1.B and 1.D.2, future studies using multiyear data could provide a more robust analysis of the lasting effects of NFT platform entry on physical collectible markets.
The authors thank the senior editor, associate editor, and two anonymous reviewers for thoughtful and constructive feedback throughout the review process. The authors are grateful for the insightful comments received from participants at research seminars hosted by LMU Munich, University of Arizona, University of Münster, Saarland University, University of Science and Technology China, Renmin University, Tsinghua University, Peking University, University of Bremen, University of Mannheim, and Nanyang Technological University. The authors also appreciate the valuable suggestions provided by attendees at the Workshop on Information Systems and Economics (WISE) 2022, the International Conference on Crypto-Marketing 2022, the Virtual Digital Economy (VIDE) Seminar Series, the Heinz Nixdorf (HNI) Symposium, the Symposium on Statistical Challenges in E-Commerce Research (SCECR) 2021, the Digital Economy Workshop (DigiEcon) 2022, the Conference on Information Systems and Technology (CIST) 2021, the International Conference on Information Systems (ICIS) 2021, and the Virtual Conference on AI, ML, and Business Analytics at Temple University (2021). The authors gratefully acknowledge feedback from Anindya Ghose, Geert Duysters, Meng Liu, Murat Tunc, and Anthony Lee Zhang. Their perspectives helped us refine and strengthen the arguments presented in this paper.
1 Typically, purchasing an NFT does not grant ownership of underlying creative content, such as intellectual property rights (Weiss and Ozer 2022). Instead, ownership refers to the holding of a unique verifiable token that is recorded on the blockchain and that serves as a proof of the authenticity and provenance for a specific copy of a digital asset.
2 Context-related differences between NFTs and other digital goods are presented and discussed in Online Appendix 5.A. In Online Appendix 5.B, we also discuss how these attributes may shape price effects.
3 This scenario presents a novel form of competition, specifically, a special case of platform competition in which technological innovation in one product category, introduced by a new platform, affects an existing category on an incumbent platform. This contrasts with prior research on digitization, which has typically focused on platform-level competition or direct substitution between physical and digital goods, such as streaming music versus CDs (Zentner 2006) or online movies versus DVDs (Smith and Telang 2009). In the case of NTS and eBay, their competitive dynamics are more nuanced because they revolve around the interplay between a new digitally scarce product and a traditional physically scarce one.
4 See https://web.archive.org/web/20221221122959/https://twitter.com/nf_suzanne/status/1597231048152125440 (accessed October 7, 2024).
5 We corroborate this with survey results. Details about the implementation and the results of our survey are discussed thoroughly in Online Appendix 5.C. Other popular NFTs, for example, CryptoPunks or the Bored Apes Yacht Club, are not as well suited for this task. For these collections, it is less clear what a comparable offline domain with similar mechanics and overlapping target consumers would be.
6 This figure originates from proprietary market research; we acquired the “Sports Trading Market” report from Verified Market Research (https://www.verifiedmarketresearch.com/product/sports-trading-card-market/).
7 An overview of all robustness checks is provided in Table 12.
8 A platform that helps users to support their entrepreneurial ideas through crowdfunding.
9 See https://nbatopshot.com/transactions/top-sales (accessed October 7, 2024).
11 See https://www.espn.com.au/nba/insider/story/_/id/30906788/this-future-nba-top-shot-dizzying-world-digital-collectibles, https://finance.yahoo.com/news/nba-top-shot-seeing-record-141513789.html, https://www.nytimes.com/2021/02/22/business/nft-nba-top-shot-crypto.html, https://eu.usatoday.com/story/sports/nba/2021/02/26/what-is-nba-top-shot-stocks-lebron-james-highlight/6825173002/, and https://www.cnbc.com/2021/02/28/230-million-dollars-spent-on-nba-top-shot.html.
12 See https://www.artnews.com/list/art-news/artists/2021-year-of-the-nft-1234614022/bored-ape-yacht-club-jpeg-summer-and-rise-of-the-pfp/ and https://medium.com/sandbox-game/the-sandbox-breaks-nft-records-in-february-2021-36a89c9840b2.
13 Data available at http://cryptoslam.io/nba-top-shot/sales/summary/ (accessed October 7, 2024).
14 In Online Appendix 5.A, we present and discuss differences between NFTs and other digital goods that are relevant and important for our setting.
15 In our setting, we analyze graded sports trading cards that are a product category that is easy to authenticate: When trading cards are graded, they receive a unique identifier from the grading service provider that can then be used on the grading service provider’s website (e.g., PSA (https://www.psacard.com/pop/search), Beckett (https://www.beckett.com/grading/card-lookup), SGC (https://www.gosgc.com/cert-code-lookup)) to verify that the card is indeed authentic. This serves as an excellent way for users to authenticate that the cards they are viewing are real.
16 If fake cards are sold, eBay still gives buyers the opportunity to report this and claim back the amount that they spent (https://community.ebay.com/t5/Ask-a-Mentor/Fake-pokemon-cards/td-p/34294283).
17 Details about our survey implementation are discussed thoroughly in Online Appendix 5.C.
18 We recognize that NTS can decide to increase the number of copies of a particular NFT as long it is not locked, as we explain in Section 6.2. Albeit this incrementally reduces the scarcity of a focal NFT’s copies, it does not infringe the concept of scarcity of NFTs as such.
19 When evaluating the quality of trading cards, its existing condition is compared to its ideal condition, which is not the condition that it had when it was first created (i.e., produced, as in the case of a painting), but the condition that it should have had when it was first produced. This is a subtle but important difference because trading cards are mass produced and some copies have slight deviations, from their ideal condition, that occurred by the production process. Examples of such deviations can include that the card is not perfectly centered or it has minor printing imperfections (https://www.psacard.com/gradingstandards). These deviations (that occurred during the production process) will very likely be spotted by grading card authenticators who will penalize the quality score of the card, even though the card is in pristine physical condition (i.e., there was no mishandling by the collector(s)).
20 It should be noted that there have been cases of theft through NFTs (for an example, see https://research.checkpoint.com/2021/check-point-research-prevents-theft-of-crypto-wallets-on-opensea-the-worlds-largest-nft-marketplace/). Although these cases can make one skeptical over the redundancy of reputation systems on the blockchain, they are nothing more than cases of platforms failing to implement adequate security measures and users not being careful, similar to cases of fraud on eBay or other platforms. As a result, they should not invalidate that blockchain’s roles, in making transactions instant and allowing anyone to verify the authenticity of NFTs, can render traditional reputation systems redundant. Finally, we believe that similar to other cybersecurity vulnerabilities, platform vulnerabilities and user inattention will likely remain a big problem that collectors have to be aware of. One way that NFT collectors are advised to protect themselves from these, is to use two wallets with one wallet being used to store collectibles and a separate second wallet being used for trading activity.
21 These are cards whose quality has been evaluated and verified by professional third-party services. We discuss “graded” cards in more detail in Section 6.3.
22 One could argue that the entry of NTS also affects the prices of baseball cards, in which case we would expect the prices of baseball cards to drop after the shock. Under this scenario, and if we find that the prices of basketball cards also drop after the shock, our coefficient estimates will be conservative and thus underestimate how the entry of NFT collectibles affects product prices on the traditional platform.
23 Between January and February 2021, these stocks experienced sharp daily variance as individual investors banded together for large-scale pump-and-dump speculations to benefit from short-squeezing the stocks. We address the missing closing prices for weekends and holidays by imputing them with the closing prices from the next available trading day.
24 We have made the R code for this available in an R package found in https://github.com/jk2049/cardid. There, we have included an example with instructions on how to run the code.
25 These sources also contain information such as the players’ active years and whether a player has been inducted into the Hall of Fame. Basketball and baseball players are considered active if they are currently (as of 2021) playing in the NBA and MLB, respectively.
26 This also suggests that disparate strategies by eBay and NTS sellers are unlikely to explain our results.
27 In general, this analysis also provides evidence that there are no significant sample differences between the basketball cards sold before and after the shock.
28 See https://pages.ebay.com/seller-center/service-and-payments/fees-and-features.html (accessed October 7, 2024).
29 Jayson Tatum is a player who is active in the NBA during the time of our study.
30 We use the following link: https://blog.nbatopshot.com/category/drops (accessed October 7, 2024).
31 After viewing a pack’s page (e.g., https://nbatopshot.com/listings/pack/137dd9c2-8d06-418f-a53e-24a52a16f5cc (accessed October 7, 2024)), one can view its contents by clicking on “View a complete list.”
32 For NBA trading cards, scarcity is locked in by card producers, such as Panini, at the production/printing stage. This means that well before the packs of cards are shipped to distributors, each individual card is mapped out with a fixed press run, and the rare “parallel” versions are sequentially stamped (e.g., “15/99” or “1/1”). Because printing is a physical process, these numbers can never change, and there will never be additional copies of cards that are produced. However, not all cards are numbered (i.e., contain scarcity information). There are also unnumbered base cards and, although they may be plenty, the collectors have no verified information on their exact number of copies (because that is not stamped on the cards), unless that is communicated by the card producer.
33 For the scarcity of moments, NTS takes a more dynamic approach. Similar to card producers, NTS produces each moment in mass and the number of produced copies is denoted by the “edition size” that is permanently visible on NTS and the Flow blockchain. Nevertheless, unlike card producers, NTS may produce more copies for certain existing moments. Naturally, this would create problems for collectors who want to collect moments with a fixed supply. Thus, to distinguish between moments with and without fixed supply, NTS assigns a different tag to the moments of each category. Moments with fixed supply have a “Limited Edition (LE)” tag. Moments without a fixed supply have a “Circulating Count (CC)” tag and even though they do not have a fixed supply upon being introduced to the market, NTS can later make their supply fixed, which changes their tag to “Limited Edition (LE).”
34 See https://www.psacard.com/.
35 See https://www.gosgc.com/.
36 For details on the card grading process, we refer the reader to https://www.psacard.com/resources/gradingstandards for the possible card grades (accessed October 7, 2024).
37 In the presented analysis, we have replaced missing grade values with the value number 0. The results remain robust if we instead discard the observations with missing grade values. The results are available in Online Appendix 2.B.
38 See https://www.ebay.ie/pages/help/feedback/scores-reputation.html (accessed October 7, 2024).
39 See https://www.espn.com/mlb/story/_/id/33145121/top-100-mlb-players-all.
41 In thinking about this, imagine that you are interested in starting a new hobby such as tennis. Although you are interested to start playing tennis, you are not sure whether you will indeed like tennis enough to pick it up as a hobby. This makes you indecisive on whether to invest in high-quality tennis equipment because if you do not like tennis, then the money that you invested will be for nothing. As a result, when considering what racket to choose, you may opt for a medium to lower quality tennis racket which is more affordable instead of a high-quality and expensive tennis racket. That way if you decide to quit tennis, the costs you incurred will be lower and more negligible for you.
42 For instance, the average sold price of active popular players’ high-quality cards is USD $979.17 compared with USD $699.09 for their low-quality cards.
43 See https://github.com/jk2049/cardid.
44 See https://www.ebayinc.com/stories/news/ebay-launches-its-vault-for-trading-cards/ (accessed October 7, 2024).
45 See https://www.ebayinc.com/stories/news/ebay-collectors-enter-into-commercial-agreement-sign-deals-for-acquisition-of-goldin-by-ebay-and-acquisition-of-the-ebay-vault-by-psa/ (accessed October 7, 2024).
46 See https://www.ebay.com/help/buying/paying-items/using-psa-grading-service?id=5639 (accessed September 30, 2025).
47 See https://www.psacard.com/articles/articleview/11059/collectors-and-ebay-transactions-close-summer-launch-expected-for-integrated (accessed September 30, 2025).
48 See https://cointelegraph.com/explained/secs-2025-guidance-what-tokens-are-and-arent-securities and https://nftevening.com/dapper-labs-nft-legal-battle-4-million-settlement/.
49 For platforms such as OpenSea or Rarible, users need to choose a wallet type (custodial or noncustodial), decide on a wallet provider, connect their wallet to the platform, and familiarize themselves with the transaction systems.
References
- (2022) Online reputation and market power: Evidence from the cannabis retail market. Preprint, submitted July 29, https://doi.org/10.2139/ssrn.4170426.Google Scholar
- (2009) Mostly Harmless Econometrics: An Empiricist’s Companion, 1st ed. (Princeton University Press, Princeton, NJ).Crossref, Google Scholar
- (2022) Overcoming the coordination problem in new marketplaces via cryptographic tokens. Inform. Systems Res. 33(4):1368–1385.Link, Google Scholar
- (2018) Monetizing freemium communities: Does paying for premium increase social engagement? MIS Quart. 42(3):719–735.Crossref, Google Scholar
- (2003) Reputation and survival: Learning in a dynamic signalling model. Rev. Econom. Stud. 70(2):231–251.Crossref, Google Scholar
- (2008) All that glitters: The effect of attention and news on the buying behavior of individual and institutional investors. Rev. Financial Stud. 21(2):785–818.Crossref, Google Scholar
- (2021) EBay reports increase of 4 million trading cards sold in 2020. Accessed October 7, 2024, https://www.forbes.com/sites/tommybeer/2021/02/11/ebay-reports-increase-of-4-million-trading-cards-sold-in-2020/.Google Scholar
- (2024) Do consumers respond to social movements? Evidence from gender-stereotypical purchases after #MeToo. Management Sci. 71(6):4915–4941.Google Scholar
- (2017) It depends on where you search: Institutional investor attention and underreaction to news. Rev. Financial Stud. 30(9):3009–3047.Crossref, Google Scholar
- (2004) How much should we trust differences-in-differences estimates? Quart. J. Econom. 119(1):249–275.Crossref, Google Scholar
- (2009) The effect of superstar software on hardware sales in system markets. J. Marketing 73(2):88–104.Crossref, Google Scholar
- (2018) Can you gig it? An empirical examination of the gig economy and entrepreneurial activity. Management Sci. 64(12):5497–5520.Link, Google Scholar
- (2010) The dynamics of seller reputation: Evidence from eBay. J. Industry Econom. 58(1):54–78.Crossref, Google Scholar
- (1997) The Economics of Electronic Commerce (Macmillan Computer Publishing, New York City).Google Scholar
- (2011) In search of attention. J. Finance 66(5):1461–1499.Crossref, Google Scholar
- (2010) Converting pirates without cannibalizing purchasers: The impact of digital distribution on physical sales and internet piracy. Marketing Sci. 29(6):1138–1151.Link, Google Scholar
- (2004) Adverse selection in electronic markets: Evidence from online stamp auctions. J. Industry Econom. 52(4):497–516.Crossref, Google Scholar
- (2024) Expectations, infections, and economic activity. J. Political Econom. 132(8):2571–2611.Crossref, Google Scholar
- (2006) Strategies for two-sided markets. Harvard Bus. Rev. 84(10):92–101.Google Scholar
- (2022) The welfare effects of peer entry: The case of Airbnb and the accommodation industry. Amer. Econom. Rev. 112(6):1782–1817.Crossref, Google Scholar
- (2023) Dog eat dog: Balancing network effects and differentiation in a digital platform merger. Management Sci. 1–20.Google Scholar
- (2025) Star Wars: An empirical investigation of star performer turnover and content supply on multi-sided streaming platforms. Inform. Systems Res., ePub ahead of print May 14, https://doi.org/10.1287/isre.2023.0367.Link, Google Scholar
- (2021) PSA card grading service temporarily closes submissions. Accessed October 7, 2024, https://dotesports.com/news/psa-card-grading-service-temporarily-closes-submissions.Google Scholar
- (2021) Initial coin offerings, speculation, and asset tokenization. Management Sci. 67(2):914–931.Link, Google Scholar
- (2014) Industry platforms and ecosystem innovation. J. Product Innovation Management 31(3):417–433.Crossref, Google Scholar
- (2018) Trajectory balancing: A general reweighting approach to causal inference with time-series cross-sectional data. Preprint, submitted August 18, http://dx.doi.org/10.2139/ssrn.3214231.Google Scholar
- (2024) Beyond scarcity: A social value-based lens for NFT pricing. J. Consumer Res. 51(1):140–150.Crossref, Google Scholar
- (2002) Reputation and competition. Amer. Econom. Rev. 92(3):644–663.Crossref, Google Scholar
- (2016) Reputation and regulations: Evidence from eBay. Management Sci. 62(12):3604–3616.Link, Google Scholar
- (2019) Love unshackled: Identifying the effect of mobile app adoption in online dating. MIS Quart. 43(1):47–72.Crossref, Google Scholar
- (2024) Memory and markets. Rev. Econom. Stud. 91(3):1775–1806.Crossref, Google Scholar
- (2019) The effects of social movements: Evidence from #metoo. Preprint, submitted December 24, https://doi.org/10.2139/ssrn.3496903.Google Scholar
- (2024) Development trajectory of blockchain platforms: The role of multirole. Inform. Systems Res. 35(3):1296–1323.Link, Google Scholar
- (2004) Will MP3 downloads annihilate the record industry? The evidence so far. Intellectual Property and Entrepreneurship, Advances in the Study of Entrepreneurship, Innovation & Economic Growth, vol. 15 (Emerald Group Publishing Limited, Bradford, UK), 229–260.Google Scholar
- (2023) Retail attention, institutional attention. J. Financial Quant. Anal. 58(3):1005–1038.Crossref, Google Scholar
- (2019) Entry into complementary good markets with network effects. Strategy Sci. 4(4):262–282.Link, Google Scholar
- (2022) EBay acquires NFT marketplace Knownorigin for an undisclosed sum. Accessed October 7, 2024, https://techcrunch.com/2022/06/22/ebay-acquires-nft-marketplace-knownorigin/.Google Scholar
- (2023) Digitization and the market for physical works: Evidence from the google books project. Amer. Econom. J. Econom. Policy 15(4):1–31.Google Scholar
- (2021) Examining the impact of television-program-induced emotions on online word-of-mouth toward television advertising. Inform. Systems Res. 32(2):605–632.Link, Google Scholar
- (2017) Platform ecosystems: How developers invert the firm. MIS Quart. 41(1):255–266.Crossref, Google Scholar
- (2021) Blockchain adoption for combating deceptive counterfeits. Production Oper. Management 30(4):864–882.Crossref, Google Scholar
- (2002)
Trust among strangers in internet transactions: Empirical analysis of eBay’s reputation system . The Economics of the Internet and E-Commerce, vol. 11 (Emerald Group Publishing Limited, Bradford, UK), 127–157.Crossref, Google Scholar - (2021) NBA Top Shot firm Dapper Labs raising funds at $7.5b+ valuation: Report. Accessed October 7, 2024, https://www.coindesk.com/nba-top-shot-firm-dapper-labs-raising-funds-at-7-5b-valuation-report/.Google Scholar
- (2019) Platform strategy: Managing ecosystem value through selective promotion of complements. Organ. Sci. 30(6):1232–1251.Link, Google Scholar
- (2021) What’s all the fuss about NBA Top Shot? Accessed October 7, 2024, https://www.si.com/nba/2021/03/17/nba-top-shot-crypto-daily-cover.Google Scholar
- (2014) Responses to entry in multi-sided markets: The impact of Craigslist on local newspapers. Management Sci. 60(2):476–493.Link, Google Scholar
- (2018) Tech entrepreneur determines first estimate of U.S. sports memorabilia market: $5.4 billion. Accessed October 7, 2024, https://www.forbes.com/sites/davidseideman/2018/09/19/tech-entrepreneur-determines-first-true-estimate-of-sports-memorabilia-market-5-4-billion/.Google Scholar
- (2019) Trading cards continue to trounce the S&P 500 as alternative investments. Accessed October 7, 2024, https://www.forbes.com/sites/davidseideman/2019/01/18/trading-cards-continue-to-trounce-the-sp-500-as-alternative-investments/.Google Scholar
- (2021) Entry of platforms into complementary hardware access product markets. Marketing Sci. 40(2):325–343.Link, Google Scholar
Similarweb (2024) Top ecommerce & websites ranking in September 2024. Accessed October 7, 2024, https://www.similarweb.com/top-websites/e-commerce-and-shopping/.Google Scholar- (2009) Competing with free: The impact of movie broadcasts on DVD sales and internet piracy. MIS Quart. 33(2):321–338.Crossref, Google Scholar
Statista (2021) Leading e-commerce websites in the United States as of June 2021. Accessed October 7, 2024, https://www.statista.com/statistics/271450/monthly-unique-visitors-to-us-retail-websites/.Google ScholarStatista (2023) Most valuable companies 2023. Accessed October 7, 2024, https://www.statista.com/statistics/263264/top-companies-in-the-world-by-market-capitalization/.Google Scholar- (2010) Research commentary—Platform evolution: Coevolution of platform architecture, governance, and environmental dynamics. Inform. Systems Res. 21(4):675–687.Link, Google Scholar
- (2021) Should I get my cards graded? Accessed October 7, 2024, https://blog.comc.com/2021/01/12/should-i-get-my-cards-graded/.Google Scholar
- (2025) Resale royalty in non-fungible token marketplaces: Blessing or burden for creators and platforms? Infrom. Systems Res. 36(3):1543–1564.Link, Google Scholar
- (2022) NFTs: What you need to know to protect copyrights. Brand Protection Professional 7(2).Google Scholar
- (2006) Measuring the effect of file sharing on music purchases. J. Law Econom. 49(1):63–90.Crossref, Google Scholar
- (2017) The rise of the sharing economy: Estimating the impact of Airbnb on the hotel industry. J. Marketing Res. 54(5):687–705.Crossref, Google Scholar
- (2025) What doesn’t kill you makes you stronger? Evidence From vampire attack on decentralized exchange and non-fungible token marketplace. J. Oper. Management 71(7):1–32.Google Scholar
- (2012) Entry into platform-based markets. Strategic Management J. 33(1):88–106.Crossref, Google Scholar
- (2021) Network interconnectivity and entry into platform markets. Inform. Systems Res. 32(3):1009–1024.Link, Google Scholar

