OTC Discount
Abstract
We document a pecking order of transaction costs in the interdealer market for German sovereign bonds, where three trading protocols coexist. Dealers can trade over the counter (OTC), either bilaterally or via brokers, as well as on an exchange. Trading on the exchange is more expensive than OTC, and broker-intermediated trades are more costly than bilateral OTC trades. The existence of an OTC discount is difficult to square with theories centered around search-and-bargaining frictions but is in line with models of hybrid markets based on information frictions. Consistently, we show that dealers’ information impacts their choice of trading protocol and that the pecking order of transaction costs is aligned with the informational content of order flows across protocols. Search and bargaining as well as information proxies explain differences in OTC discount within protocols. A realistic description of hybrid markets thus requires both types of frictions.
This paper was accepted by Agostino Capponi, finance.
Funding: L. Pelizzon and M. Schneider acknowledge funding by the Deutsche Forschungsgemeinschaft [Grant 329107530]. L. Pelizzon thanks the Leibniz Institute for Financial Research SAFE for financially sponsoring this research.
Supplemental Material: The online appendix and data files are available at https://doi.org/10.1287/mnsc.2022.00194.
1. Introduction
Most fixed-income and derivative instruments trade in over-the-counter (OTC) markets. Participants in these markets search for counterparties and negotiate prices that reflect their relative bargaining positions. Instead, in some asset classes, dealers trade with one another on electronic central limit order books provided by exchange platforms. In contrast to OTC markets, search-and-bargaining frictions are irrelevant on the exchange where all participants can immediately trade at the same prices. In practice, OTC and exchange platforms often coexist as hybrid markets.
The dealer-to-dealer (D2D) segment of the market for German sovereign bonds (Bunds) is a case in point. We document that the vast majority of OTC Bund trades have lower transaction costs than those implied by exchange quotes, thus giving rise to a pervasive OTC discount. A substantial share of these OTC transactions is intermediated by interdealer brokers. Distinguishing between bilaterally negotiated and broker-intermediated OTC trades, we show that the latter features a considerably lower OTC discount. We thus observe a pecking order of transaction costs; exchange trading is more expensive than via brokers, and broker-intermediated trades are more costly than bilateral OTC trades.
These findings are difficult to square with theories that exclusively focus on search-and-bargaining frictions. If search was the only friction, then traders with access to an exchange should not have a reason to trade bilaterally. That said, the existence of a hybrid market and our finding of an OTC discount are consistent with theories emphasizing the role of asymmetric information, which gives rise to adverse selection. In line with this view, we document that dealers’ choice of trading protocol is driven by variables measuring the private and market-wide information that they have access to. Moreover, we show that the pecking order of transaction costs is aligned with the informational content of order flows across protocols for Bund returns. Finally, our results imply that the observed variation of transaction costs within OTC protocols is driven by information as well as search-and-bargaining frictions. Combined, our analysis suggests that a realistic description of hybrid markets requires both types of frictions. This is relevant given recent efforts to regulate OTC markets more tightly and to foster exchange-based trading.
In the interdealer Bund market, dealers trade with each other using three different protocols: via the interdealer exchange MTS (Mercato Telematico dei titoli di Stato), via interdealer brokers, and through bilateral negotiations. Trading on the exchange is immediate and post-trade transparent. As such, it eliminates search-and-bargaining frictions but can also reveal private information because all market participants instantaneously observe the price and volume of each trade. In contrast, for bilateral and broker-intermediated OTC transactions, only the involved counterparties observe a trade. In bilateral OTC transactions, dealers search for counterparties and therefore, know their identities. Instead, when they trade via a broker, this search effort is undertaken by the broker, and counterparties remain anonymous to one another. For each trade, dealers can thus choose between three protocols, which differ with respect to anonymity, transparency, and immediacy. Hence, their trading decisions depend on the relative importance of search-and-bargaining frictions as well as information frictions across protocols. What the presence of these frictions implies for the ranking of transaction costs is an empirical question.
The D2D Bund market represents an ideal laboratory to study this question. We combine a unique regulatory data set that comprises all trades involving at least one financial institution regulated in Germany with the full limit order book on MTS. This allows us to compute our main quantity of interest, OTC discount, which measures the transaction cost advantage of an OTC trade with respect to the potential execution of the same trade on the exchange at the same time.1 We find that 87% of interdealer transactions execute at a lower transaction cost than the one attainable on MTS. Moreover, there is a sizable difference between the OTC discounts of bilateral and broker-intermediated OTC trades. Although bilateral OTC trades on average feature 54.6% lower transaction costs relative to exchange quotes, broker trades are on average only 24.6% cheaper. This pecking order of transaction costs is highly economically significant in light of an annual trading volume of about 1.6 trillion Euro in the interdealer Bund market.
More than three quarters of interdealer trading volume in the Bund market is intermediated by brokers. Why do dealers rely so heavily on brokers despite the higher transaction costs relative to bilateral OTC trades? Moreover, why do dealers trade on the exchange, even though it is more costly than in the OTC protocols? We study both questions by modeling dealers’ protocol choice at the level of individual trades and rely on several proxies of information and search-and-bargaining frictions as explanatory variables. We find that both types of frictions are relevant for dealers’ protocol choice. More informed trades are more likely routed via the exchange. Similarly, more informed OTC transactions are often intermediated by a broker. Finally, we also show that proxies for search frictions influence dealers’ protocol choice. Combined, these results highlight the complementary roles that the three protocols provide.
We document that dealers’ individual trading decisions are also reflected in the informational content of aggregate order flows across protocols. Regressing bond returns on the lagged order flows from all three protocols, we show that the order flows from both the exchange and broker trading predict bond returns a few days out and that this effect is more pronounced for the exchange. We find no predictability for the flow from bilateral interdealer trades. Crucially, this is consistent with the observed pecking order and our finding that more informed trades are more likely routed via the exchange or a broker.
To assess the relative importance of search-and-bargaining and information frictions in determining transaction costs within protocols, we estimate a transaction-level regression of OTC discount on proxies of both types of frictions. Importantly, our results account for the potential endogeneity arising from the joint determination of the choice of trading protocol and pricing decisions. We find that more informed OTC trades receive significantly lower discounts. Moreover, dealers with more bargaining power receive higher discounts, suggesting that both types of frictions are quantitatively important drivers of OTC discount. Although our analysis is focused on the D2D segment, we also show that there is significant pass-through of OTC discount from the D2D to the dealer-to-customer (D2C) market segment.
Our paper contributes to several strands of the literature. There is a long-standing interest in the functioning of OTC markets. Theories of such markets focus on search-and-bargaining frictions to explain pricing differences (e.g., Duffie et al. 2005, 2007). The empirical literature has confirmed the relevance of these frictions: for example, with regard to dealer network structure (Li and Schürhoff 2019) and systematic changes in yield spreads (Friewald and Nagler 2019). Therefore, it is a widely held view that exchange markets feature lower transaction costs than OTC markets if considered separately (Edwards et al. 2007, Bessembinder et al. 2020).
This view has been challenged, however, by Glode and Opp (2020). These authors compare OTC and exchange markets in a model with endogenous information acquisition. They find that OTC markets can improve allocative efficiency by providing dealers incentives to acquire expertise. On the other hand, it can also reduce welfare when this expertise is exploited for adverse selection. In this case, competitive limit order markets tend to dominate.
Although Glode and Opp (2020) consider OTC and limit order markets separately, there are studies that analyze these protocols jointly in a hybrid setting, where information frictions are commonly at the center (e.g., Seppi 1990, Lee and Wang 2025).2 A key feature of Seppi (1990) is that in OTC protocols, dealers know the identity of their counterparties, whereas market orders on the exchange are anonymous. In this model, equilibria arise where market participants always trade OTC when they are uninformed and at least partially on the exchange when they are informed. Lee and Wang (2025) extend this theory to investigate the welfare implications of restricting OTC trading in a hybrid market. In their model, dealers in the OTC protocol price discriminate between traders who are either likely informed or likely uninformed. A key testable hypothesis is that “the exchange spread is strictly wider than the OTC spread.”3 Consistent with this prediction, we find that OTC transaction costs for Bunds are lower than on the exchange. Because brokers provide a higher degree of anonymity than bilateral OTC trading, this prediction might also apply to our finding that transaction costs via brokers are higher than in the bilateral OTC protocol.
Some prior work relates information to order flows (e.g., Seppi 1990, Grossman 1992). In Grossman (1992), dealers in upstairs (OTC) and downstairs (limit order) markets receive information from their respective expressed order flows. In addition, dealers’ or brokers’ knowledge of unexpressed order flow in the upstairs OTC market allows them to provide better trading conditions over the counter than on the exchange. Relatedly, the model of Seppi (1990) predicts that uninformed traders trade only OTC, whereas informed traders either trade only on the exchange or use mixed strategies. As a result, the order flow from the exchange should be more informative than the OTC order flow. Consistently, we find that in the interdealer Bund market, aggregate order flows from the exchange and from broker trades each carry predictive information about future returns, whereas we do not find such a result for the aggregate order flow from bilateral OTC trades.4
Relevant information can also be about the identity of traders. Meling (2021) investigates the role of post-trade anonymity on market quality. He shows that the introduction of post-trade anonymity on the Oslo stock exchange increased trading volume and improved bid-ask spreads. This is in line with our results, which also point to the relevance of anonymity for trading decisions. Specifically, we find that dealers frequently forego some OTC discount to trade via brokers who provide anonymity.
Another key friction that has been identified in the literature is immediacy. Menkveld et al. (2017) observe that volatility shocks shift market shares between dark and lit venues along a pecking order of transaction costs. They present a simple model where the transaction cost differences are explained by varying degrees of immediacy. We complement their analysis by showing that the three trading protocols for which we document a pecking order of transaction cost differ not only in terms of immediacy but also, along the additional dimensions of transparency and anonymity. The exchange provides anonymity as well as the highest degree of immediacy and therefore, features higher transaction costs than the OTC protocols. Relative to bilateral OTC trading, brokers provide a higher degree of anonymity and potentially also immediacy, and thus, they have higher transaction costs, in line with theories based on information frictions. Indeed, we show that both exchange and broker order flows are informative about future returns.
Several papers have empirically studied pricing and protocol choice in hybrid markets in different asset classes. Barclay et al. (2006) analyze the choice between electronic and voice brokerage for U.S. Treasuries that go off-the-run, and Hendershott and Madhavan (2015) study U.S. corporate bonds trading both OTC and on a request-for-quote (RFQ) platform. More recently, Allen and Wittwer (2023) study traders’ venue choice in the Canadian sovereign bond market and analyze the welfare implications of modifications to the hybrid market setting. Investigating the market for index CDS (Credit Default Swap), Riggs et al. (2020) focus on the strategic choices of dealers and customers in trading via RFQ or request-for-streaming protocols, whereas Collin-Dufresne et al. (2020) report that in the interdealer segment, low-cost, low-immediacy protocols are preferred to trading on a limit order book. Studying the introduction of OTC trading to the Chinese interbank FX (foreign exchange) market, Holden et al. (2021) provide evidence for the role of bargaining power by comparing the aggregate price functions of small and large banks. A key advantage of our analysis is that we can directly compare the transaction costs for exchange and OTC trading as well as measure the relevant frictions at the transaction level. Relatedly, a number of papers have analyzed alternative protocols for equities, such as upstairs markets (e.g., Bessembinder and Venkataraman 2004).
We also contribute to the literature on the role of brokers as intermediaries. In the equity market, Barbon et al. (2019) and Di Maggio et al. (2019) document that brokers leak private information from informative trades to their institutional clients, whereas Han et al. (2024) argue that brokers help facilitate liquidity provision. In the U.S. Treasury market, Anderson and Liu (2024) show that brokerage platforms help dealers manage their interest rate risk. We document that brokers also play a key role in the Bund market as they represent the most actively used interdealer trading protocol. In particular, dealers benefit from the anonymity and facilitation of large orders provided by brokers. Brokers are not unique to the Bund market but are also an integral part of other interdealer fixed-income markets, such as U.S. Treasuries (Copeland et al. 2018), UK Gilts (Holland 2002), and Canadian sovereign bonds (Berger-Soucy et al. 2018). Our results thus highlight that understanding the role of brokers is crucial for modeling the microstructure of sovereign debt markets.
In sum, our findings point to a gap in the theoretical literature on OTC and exchange markets. A realistic description of the prevalent market structure should consider the coexistence of more than two different trading protocols and especially, the important role of interdealer brokers. Moreover, it should account for both information and search-and-bargaining frictions in a unified framework.
The remainder of this paper proceeds as follows. Section 2 describes the Bund market and the features of the three trading protocols as well as our data set. Section 3 introduces our main quantity of interest, OTC discount, and establishes a pecking order of transaction costs across protocols. In Section 4, we relate dealers’ protocol choice to proxies of information and search-and-bargaining frictions. We also show that the pecking order is consistent with the informational content of order flows across protocols. In Section 5, we study the role of both types of frictions in driving differences of OTC discount within trading protocols. Section 6 concludes.
2. The Bund Market
German sovereign debt securities enjoy benchmark status in the euro area and worldwide as a liquid and safe asset. Secondary market trading occurs among dealers and between dealers and customers. We refer to these as the interdealer (D2D) segment and the D2C segment of the market, respectively. In this paper, we focus on the D2D segment, which features a hybrid market structure with three distinct trading protocols: the interdealer exchange MTS, over-the-counter transactions intermediated by interdealer brokers, and bilateral OTC transactions. In this section, we describe the market structure of the three protocols and highlight their properties in terms of transparency and anonymity.5
2.1. Trading Protocols and Market Structure
2.1.1. Exchange.
The first option for Bund dealers to trade is via an exchange. The main exchange platform with a significant market share is the MTS interdealer exchange, which is operated as a fully electronic limit order book market. Dealers actively quote executable limit orders on MTS, and the depth on both the bid and ask sides of the book is typically in excess of 100 million Euro for most bonds, whereas the minimum trade size is 2.5 million Euro. Subscription services, such as Bloomberg, disseminate MTS prices and volumes at the best bid and ask levels in real time. Hence, this information is also available to non-MTS dealers. Similarly, all trading activity on the exchange is observed by all market participants in an anonymized way. Hence, MTS provides both pretrade transparency (about trading conditions) and post-trade transparency (about executed trades). After a trade occurs, the identity of the counterparties is revealed only to the two involved dealers for the purpose of settlement. This protocol, therefore, provides anonymity pretrade and post-trade from noninvolved parties.
2.1.2. Bilateral.
Dealers trade directly with one another in bilateral over-the-counter negotiations. This protocol represents the classical OTC trading protocol studied in most of the literature on OTC bond markets. Bilateral OTC trading is neither pretrade transparent nor post-trade transparent (trades are observed by the counterparties but not by other market participants). In these bilateral trades, both involved dealers are aware of the identity of their counterparty (i.e., bilateral trades are not anonymous for the counterparties involved). Other market participants do not observe any information about the trade.
2.1.3. Interdealer Brokers.
Dealers can also trade with one another via interdealer brokers. In this case, the initiating dealer communicates the trade request to a broker, who then undertakes to find a suitable counterparty and earns a fee. According to conversations with market participants, broker trades in the Bund market are still commonly done by voice. Just as bilateral OTC trades, broker trades are not transparent and unobserved by other market participants.6 Crucially, brokers follow a “matched principal” protocol. This implies that the broker acts as a counterparty to both sides of the trade without taking inventory and that the identities of counterparties are not revealed to each other, even after the trade is settled.7 This protocol, therefore, also provides anonymity both pre- and post-trade because the broker masks the identity of the other counterparty.
In what follows, we refer to bilateral and broker trades jointly as OTC trades in contrast to exchange trades on MTS.
Table 1 summarizes the transparency and anonymity features of the three protocols. The main differences between the three protocols are as follows. First, exchange trading is pre- and post-trade transparent, whereas OTC trades are not and thus, are unobserved by other market participants. Second, in bilateral trades, dealers are aware of each others’ identity, whereas the involved counterparties are anonymous in broker-intermediated trades. On the exchange, the identities of the counterparties are only revealed post-trade to the involved dealers for settlement purposes. Third, trading on the exchange is immediate, whereas both OTC protocols include search-and-bargaining processes.
|

Table 1. Comparison of Trading Characteristics Across Protocols
| Exchange | OTC | ||
|---|---|---|---|
| Bilateral | Broker | ||
| Transparency | |||
| Pretrade | Yes | No | No |
| Post-trade | Yes | No | No |
| Anonymity | |||
| Pretrade | |||
| All participants | Yes | Yes | Yes |
| Involved counterparties | Yes | No | Yes |
| Post-trade | |||
| All participants | Yes | Yes | Yes |
| Involved counterparties | No | No | Yes |
| Immediacy | Yes | No | No |
Notes. This table summarizes the characteristics of the trading protocols used in the interdealer Bund market. Pre-trade transparency refers to the observability of trading conditions before a trade takes place (e.g., through the dissemination of order book information). Post-trade transparency implies the disclosure of information on trades after a trade took place. We refer to anonymity when counterparties of the transaction or other market participants do not observe the identity of the participants involved in the transaction. Immediacy implies fast and certain execution of trades.
Importantly, all three trading protocols are simultaneously available to dealers, and in our sample, dealers rely on all of them. The fact that all three protocols are regularly used suggests that they offer complementary features to dealers for different trades. Of note, this hybrid structure is not unique to the interdealer Bund market but is similar to that of other European sovereign bond markets, such as those for sovereign debt issued by France and the United Kingdom. In the U.S. Treasury market (Fleming 1997, Fleming and Remolona 1999, Mizrach and Neely 2009), the order book of the BrokerTec platform assumes a role similar to that of MTS in the euro area. Interestingly, this market structure differs from that studied in most theoretical models, which to the best of our knowledge, do not consider all three protocols jointly.
2.2. Data
We focus on German sovereign bonds with maturities of 2, 5, 10, and 30 years, which we jointly refer to as Bunds. Reissuances are common for Bunds, and on-the-run effects are much less important than for U.S. Treasuries. We, therefore, include both on-the-run and off-the-run bonds in our analysis.
Our study is based on a unique regulatory transactions data set of all Bund trades involving at least one German financial institution from June 2011 to December 2017. Importantly, this trade repository includes interdealer trades from all three market segments in addition to bilateral D2C trades. The transactions data are based on reporting requirements of German financial institutions to the German Federal Financial Supervisory Authority (Bundesanstalt für Finanzdienstleistungsaufsicht, popularly known as “BaFin”). They contain information on the price, size, time, and direction of each trade as well as a flag indicating whether a trade was over the counter or the platform in which the trade was executed. The data set also includes anonymous identifiers for the reporting agent and the counterparty of a trade. We match these data with the full limit order book data from MTS.
Table 2 describes the trading activity covered by our sample and the subsamples relevant for our analysis in terms of number of trades, aggregate trading activity, trade size, and market share by type of trading protocol. Our full sample contains over 500,000 trades across 116 German federal bonds and 402 reporting institutions, corresponding to a total nominal volume of almost 3.4 trillion Euro (labeled “full sample”). A survey by the German finance agency among Bund Issues Auction Group members pegs daily trading volume in the secondary market at more than 17 billion Euro. Our sample captures about 11% of this trading activity.
|
Table 2. Trading Activity by Subsamples
| No. of trades | Trade volume | Trade size (million Euro) | ||||||||
|---|---|---|---|---|---|---|---|---|---|---|
| Sum (billion Euro) | Share of D2D (%) | Mean | Standard deviation | 5th Percentile | 25th Percentile | Median | 75th Percentile | 95th Percentile | ||
| Full sample | 503,220 | 3,395.39 | 6.75 | 19.46 | 0.00 | 0.10 | 1.00 | 5.00 | 30.00 | |
| Init. & counterp. ID known | 211,886 | 1,485.02 | 7.01 | 17.35 | 0.01 | 0.18 | 1.25 | 5.00 | 32.50 | |
| D2D | 47,449 | 493.55 | 10.40 | 19.95 | 0.10 | 0.90 | 2.00 | 10.00 | 50.00 | |
| Trade size million Euro | 22,252 | 470.13 | 100.00 | 21.13 | 25.13 | 2.75 | 5.00 | 10.00 | 25.00 | 72.00 |
| D2D via MTS | 2,179 | 17.18 | 3.65 | 7.88 | 6.40 | 2.50 | 5.00 | 5.00 | 10.00 | 13.00 |
| D2D via bilateral OTC | 6,791 | 86.52 | 18.40 | 12.74 | 20.30 | 2.60 | 3.80 | 5.40 | 11.60 | 50.00 |
| D2D via broker | 13,282 | 366.43 | 77.94 | 27.59 | 27.09 | 3.00 | 7.00 | 20.00 | 40.00 | 85.00 |
Notes. This table provides an overview of trading activity for the full sample of observed trades and the subsamples used in our analysis. Full sample refers to the cleaned and unfiltered sample, and init. & counterp. ID known refers to those trades where both parties are identified. In the interdealer segment (labeled D2D), we consider the subset of all trades with a nominal amount of at least 2.5 million Euro (trade size 2.5 million Euro) and distinguish by trading protocol: D2D via MTS (i.e., trades on the interdealer exchange MTS), D2D via bilateral OTC (i.e., bilaterally negotiated interdealer trades), and D2D via broker (i.e., interdealer trades intermediated by an interdealer broker). Reported are the number of trades for each subsample, the aggregated trade volume over our full sample period, the volume share of overall interdealer volume, and summary statistics of trade size (in terms of notional amount). The table is based on regulatory data of all transactions in Bunds involving German financial institutions from June 2011 through December 2017.
For about 210,000 of these trades (corresponding to a volume of roughly 1.5 trillion Euro), we are able to identify both initiator and counterparty (labeled “Init. & counterp. ID known” in Table 2).8 We classify the involved parties as either dealers or customers based on their access to the interdealer exchange MTS. According to this classification, we observe about 47,500 interdealer trades between MTS dealers (labeled “D2D”). For trades on its platform, MTS imposes a 2.5 million Euro minimum trade size. To ensure comparability with the OTC segment of the market, we limit our sample to the set of trades above that threshold. These roughly 22,000 interdealer trades (by 34 dealers and via six interdealer brokers) represent more than 95% of the overall interdealer trading volume. About 2,200 interdealer trades take place on MTS (labeled “D2D via MTS,” corresponding to 3.7% of overall observed interdealer volume), whereas there are about 6,800 OTC transactions resulting from bilateral negotiations (“D2D via bilateral OTC,” corresponding to 18.4% of interdealer volume). The by far largest share of interdealer trading is done via brokers (“D2D via broker”) in terms of both the number of trades (about 13,300) and overall volume (77.9%).9 The average nominal trade size in the interdealer segment is lowest on MTS (7.9 million Euro), somewhat larger (12.7 million Euro) in bilateral OTC transactions, and considerably larger (27.6 million Euro) in broker-intermediated trades.
3. OTC Discount in the Bund Interdealer Market
In this section, we document that transaction costs in the interdealer Bund market are on average lower for OTC trades compared with contemporaneous quotes on the exchange. Moreover, bilateral OTC trades are cheaper than those intermediated via brokers. In Section 3.1, we define our measure of transaction cost differential, which we label “OTC discount.” In Section 3.2, we provide descriptive statistics about the transaction cost measure across trading protocols. Section 3.3 then confirms this result based on a matched sample of bilateral and broker-intermediated trades.
3.1. Definition
We measure the transaction cost of OTC trades relative to those on the exchange protocol of the interdealer Bund market. In doing so, we make use of the full limit order book of MTS and compare the transaction costs of OTC trades with the contemporaneous trading conditions on the exchange. Our quantity of interest is the premium or discount that OTC trades pay or receive with respect to bid and ask quotes on MTS when initiating a trade. We define the OTC discount as the difference between the price that a trade would have incurred on the exchange and the observed price of an OTC trade. We measure OTC discount as a fraction of the hypothetical transaction cost on the exchange. Formally, OTC discount is defined as
Figure 1 illustrates the trade sign identification and calculation of OTC discount. A positive OTC discount implies that executing a trade over the counter is cheaper for the initiator than trading on the exchange. Trades at the midprice correspond to 100% OTC discount, the upper bound, whereas buys at the MTS ask price and sells at the MTS bid price have 0% OTC discount; that is, the OTC trade occurred at the same price as on the exchange. When OTC discount is negative (i.e., when it would have been cheaper to trade on MTS instead of OTC), we refer to this as an OTC premium.
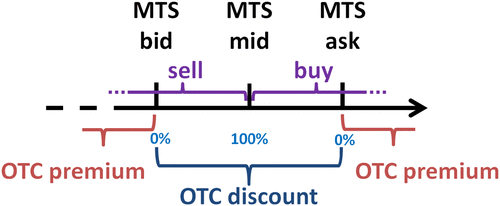
Notes. We classify OTC trades above (below) the quoted midprice on MTS as buyer-(seller-) initiated. For a buyer-initiated trade, OTC discount is the price difference between the quoted best ask price on MTS and the observed price of the trade measured as a fraction of the MTS half-spread: that is, the difference between the best ask and the midprice. For a seller-initiated trade, OTC discount is, symmetrically, the normalized difference between the observed price of the trade and the quoted best bid. By this definition, a positive OTC discount implies that executing a trade over the counter is cheaper for the initiator than trading on the exchange. We identify an OTC premium, where OTC discount is negative: that is, when trading on MTS would have been cheaper. Trades at the midprice have 100% OTC discount, whereas buys at the MTS ask price and sells at the MTS bid price have 0% OTC discount, that is, the OTC trade presented no price improvement over MTS.
As the reference price, we choose the quoted price at the respective best level of the limit order book (i.e., is the best ask (bid) price for buyer-initiated (seller-initiated) trades). Hence, we disregard that larger trades would also have to execute against quotes at deeper levels of the limit order book (known as “walking up the book”). We do so for several reasons. First, large trades are rare on MTS, and the price at the best provides a better benchmark for OTC trades than an “effective” price. Second, in choosing the quoted price at the best as , our measurement for OTC discount is conservative (i.e., smaller) with respect to a price that takes into account the depth of the order book.
Given that the market share of exchange transactions is substantially lower than that of OTC trading, one might worry about the use of exchange quotes as a reference. However, market share is endogenous to trading conditions, and all else equal, dealers will generally gravitate to cheaper protocols. A better indicator of the potential capacity of the exchange to facilitate trading is the depth of the order book. We find that 98% of all OTC transactions could take place on the MTS order book at the moment of the trade. Moreover, notwithstanding the smaller market share, all limit orders on MTS are executable. MTS bid and ask quotes are thus an appropriate reference price.
3.2. Properties of OTC Discount
Table 3 shows the descriptive statistics of OTC discount for the same subsamples of OTC trades as those discussed above. Both mean and median of OTC discount are positive across all considered subsamples, and we reject the null hypothesis that the average OTC discount is zero at the 0.01% significance level using a simple t-test. For interdealer trades with a size of at least 2.5 million Euro (“trade size 2.5 million Euro”), the average OTC discount equals 34.7%. This implies that dealers pay on average just about two thirds of the quoted MTS bid-ask spread when trading among each other over the counter. The median OTC discount is even larger at 61.6%, and the trade at the 95th percentile receives a discount of 96%. Less than 16% of D2D trades above 2.5 million Euro incur an OTC premium.
|
Table 3. Descriptive Statistics of OTC Discount
| No. of observations | OTC discount (%) | Share <0 (%) | p-value (%) | |||||||
|---|---|---|---|---|---|---|---|---|---|---|
| Mean | Standard deviation | 5th Percentile | 25th Percentile | Median | 75th Percentile | 95th Percentile | ||||
| Full sample | 443,018 | 35.85 | 105.89 | −109.50 | 32.00 | 65.71 | 84.00 | 96.23 | 13.5 | 0.0000 |
| Init. & counterp. ID known | 209,427 | 45.91 | 72.69 | −74.39 | 36.67 | 66.67 | 85.00 | 96.47 | 11.3 | 0.0000 |
| D2D | 45,032 | 39.97 | 82.05 | −100.00 | 32.00 | 65.33 | 84.00 | 96.25 | 13.2 | 0.0000 |
| Trade size million Euro | 20,073 | 34.71 | 87.29 | −125.25 | 25.00 | 61.60 | 82.35 | 96.00 | 15.8 | 0.0000 |
| D2D via bilateral OTC | 6,708 | 54.57 | 60.44 | −25.00 | 45.71 | 70.00 | 85.71 | 96.00 | 6.9 | 0.0000 |
| D2D via broker | 13,226 | 24.60 | 96.44 | −160.47 | 9.52 | 55.50 | 80.00 | 95.65 | 20.4 | 0.0000 |
Notes. OTC discount is defined in Equation (1) in Section 3.1. For a buyer-initiated trade, OTC discount is the price difference between the quoted best ask price on MTS and the observed price of the trade measured as a fraction of the MTS half-spread: that is, the difference between the best ask and the midprice. For a seller-initiated trade, OTC discount is, symmetrically, the normalized difference between the observed price of the trade and the quoted best bid. A positive OTC discount implies that executing a trade over the counter is cheaper for the initiator than trading on the exchange. Reported are summary statistics of OTC discount for the subsets defined in Table 2 excluding interdealer trades via MTS, for which OTC discount is, by definition, equal to zero. For the calculation of mean and standard deviation, we winsorize OTC discount for each subsample at the 0.5th and 99.5th percentiles. The column share <0 gives the share of trades with an OTC premium (negative OTC discount) in percentage, and p-value refers to a t-test of the mean being different from zero. This table is based on regulatory data of all transactions in Bunds involving German financial institutions from June 2011 through December 2017.
The existence of an OTC discount implies that it is typically cheaper for dealers to execute Bund transactions in the over-the-counter market. The difference in transaction costs between OTC and exchange trades is not only highly statistically significant but also, economically meaningful. A simple back-of-the-envelope calculation suggests that an OTC discount of 35% implies a daily cost advantage of about 2.4 million Euro (600 million Euro annually) from trading OTC rather than on the exchange.11
In Online Appendix C, we show that these results are robust with respect to alternative definitions of OTC discount. First, we explicitly account for the effects of large trades walking up the book (i.e., is no longer the price at the best but the actual price that would result for a trade of a given size given the current depth of the limit order book). Second, in order to relate to yields instead of transaction costs, we consider an alternative definition of OTC discount where we normalize by price instead of transaction cost (i.e., the denominator in Equation (1) becomes ). Both alternative definitions equally give rise to a pervasive and economically large OTC discount.
3.3. Difference in OTC Discount Across Protocols
The results documented in the previous section mask sizable differences in the distribution of OTC discount between bilateral and broker OTC trades. As shown in Table 3, bilateral OTC trades (“D2D via bilateral OTC”) receive a considerably larger average discount of 54.6% as opposed to 24.6% for brokered trades (“D2D via broker”). Bilateral trades also have a lower share of trades with an OTC premium: 6.9% compared with 20.4% for trades via brokers.
Figure 2 shows the histogram of OTC discount for interdealer trades with a minimum size of at least 2.5 million Euro, where panel (a) refers to bilaterally negotiated trades and panel (b) is based on transactions via brokers. Both subsets feature a distribution that is heavily tilted toward positive values of OTC discount (i.e., in the majority of cases, trading over the counter is cheaper than on the exchange). Moreover, bilateral OTC trades clearly feature more mass on large positive values of OTC discount than broker trades. In summary, a pecking order of average transaction costs emerges; bilateral is cheaper than broker-based OTC trading, and both are cheaper than transactions on the exchange. This is surprising given that 78% of the transaction volume in the D2D segment is executed via brokers, implying that dealers prefer to route the majority of their transactions through a more expensive protocol.
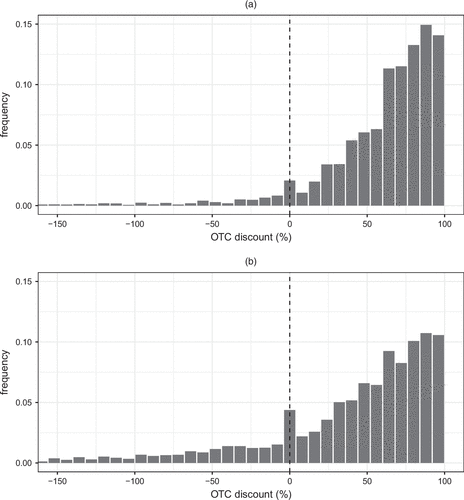
Notes. OTC discount is defined in Equation (1) in Section 3.1. For a buyer-initiated trade, OTC discount is the price difference between the quoted best ask price on MTS and the observed price of the trade measured as a fraction of the MTS half-spread: that is, the difference between the best ask and the midprice. For a seller-initiated trade, OTC discount is, symmetrically, the normalized difference between the observed price of the trade and the quoted best bid. A positive OTC discount implies that executing a trade over the counter is cheaper for the initiator than trading on the exchange. OTC discount is bounded from above to be 100% at most. The figure shows the distribution of OTC discount based on interdealer trades of nominal size of at least 2.5 million Euro. Panel (a) refers to bilateral OTC trades, and panel (b) refers to trades via a broker. This figure is based on regulatory data of all transactions in Bunds involving German financial institutions from June 2011 through December 2017.
Of course, the OTC discount differential between bilateral and broker-intermediated trades could be because of systematic differences in trade characteristics between the two protocols. For example, as documented above, broker trades are often larger in volume than bilateral ones. To fully establish the pecking order of transaction costs, we consider similar trades that were carried out via different trading protocols. Specifically, we construct a matched sample that pairs bilaterally negotiated trades with similar broker transactions using nearest neighbor propensity score matching.12 We then estimate the following equation:
Table 4 shows the results. The main finding is that broker-facilitated trades feature an OTC discount that is about 20 percentage points lower than for bilaterally negotiated trades in the matched sample. Although this is somewhat smaller than the difference shown in the summary statistics above, it highlights that broker trades receive a substantially lower OTC discount than similar bilaterally negotiated trades, controlling for a host of potential confounding factors.
|
Table 4. Differences in OTC Discount Across Interdealer Protocols
| (1) | (2) | |
|---|---|---|
| Trade via broker (dummy) | −20.2928*** | −18.9691*** |
| (−6.0892) | (−4.9009) | |
| Price impact (15 min) | −0.9012 | |
| (−1.5610) | ||
| Order splitting (dummy) | −2.5828 | |
| (−1.0046) | ||
| Informedness | −0.2375 | |
| (−0.2830) | ||
| Aggregate order flow | −0.8898 | |
| (−1.0172) | ||
| Order book imbalance | 0.2541 | |
| (0.5530) | ||
| Inventory | −0.1927 | |
| (−0.1543) | ||
| Volatility | −12.8433*** | |
| (−7.0713) | ||
| Trade size (log) | −1.5569 | |
| (−0.4594) | ||
| Intercept | 55.2786*** | 55.1914*** |
| (33.1345) | (26.3025) | |
| 0.1223 | 0.1907 | |
| 0.0987 | 0.1657 | |
| 0.0400 | 0.1148 | |
| N | 4,317 | 4,317 |
| Bond FE | Yes | Yes |
| Dealer FE | Yes | Yes |
| Controls | No | Yes |
Notes. Ordinary Least Squares estimation of (see Equation (2) and Section 3.3). The dependent variable, OTC discount, defined in Equation (1) in Section 3.1 is the difference between the price that a trade would have incurred on the exchange and the observed price of an OTC trade. We measure OTC discount as a fraction of the hypothetical transaction cost on the exchange. is a vector of trade and bond characteristics. It contains a dummy variable indicating whether an interdealer trade was via a broker and variables representing search-and-bargaining and information frictions as well as control variables, including fixed effects (FEs) for bond and initiating dealer. Control variables include MTS half-spread, depth at the MTS best, dummy variable for issuance days, dummy variable for cheapest-to-deliver securities, dummy variable for securities with on the run, bond age, and dummy variable for end-of-quarter days or end-of-year days. The sample consists of bilateral and broker OTC interdealer trades that are matched along the dimensions of trade size, MTS (half-)spread, date, bond, and initiating dealer among others. Further details of the matching process are described in Section 3.3. The minimum trade size is 2.5 million Euro in all specifications. This table is based on regulatory data of all transactions in Bunds involving German financial institutions from June 2011 through December 2017. Standard errors are clustered at bond, dealer, and daily time level. t-values are given in parentheses.
***Significance at the 1% level.
4. Information, Protocol Choice, and OTC Discount
Our analysis thus far has established a pecking order of transaction costs in the interdealer Bund market. Trades on the exchange are more expensive than OTC trades. Among OTC trades, bilateral trades have lower transaction costs than broker-intermediated OTC trades. These findings are difficult to rationalize with theories relying on search-and-bargaining frictions in OTC markets. First, if such frictions were the main driver of transaction costs, then the exchange protocol, where they are absent, should be the cheapest. Second, as search costs are arguably lower for broker-intermediated trades than bilateral OTC trades, they should feature a higher, not a lower, discount.
Both of these findings can be explained, however, by information motives. Liquidity providers on the exchange might charge a wider spread to protect themselves from being adversely selected by more informed traders. Similarly, dealers providing liquidity via brokers may request wider spreads because the broker protocol conceals the identity of the counterparty, who may be more informed. This section provides empirical evidence supporting this view.
We start by documenting that dealers’ choice of trading protocol is often driven by variables measuring the information content of a given trade. We then show that the pecking order of transaction costs is aligned with the informational content of order flows across protocols for predicting Bund returns.
4.1. Protocol Choice in the Interdealer Segment
In the interdealer Bund market, dealers face the choice between three trading protocols: exchange, bilateral, or via a broker. We model this choice as a sequential decision. First, we consider the choice between trading on the exchange or OTC.13 To this end, we estimate a probit model where the dependent variable equals one for over-the-counter trades and zero for trades on MTS. Conditional on a trade not being executed on the exchange, we then estimate a second probit model where the dependent variable equals one for trades via a broker and zero otherwise (i.e., bilaterally negotiated OTC transactions). In both models, the probability to route a trade via a specific protocol depends on a set of proxies for information and search-and-bargaining frictions that we detail next.14
4.1.1. Measuring Information and Search-and-Bargaining Frictions.
We now motivate our choice of regressors to capture the potential drivers of protocol choice. Variable definitions take the point of view of the trader initiating the transaction.
4.1.1.1. Information Frictions.
In Seppi (1990), equilibria emerge where liquidity traders prefer to trade large blocks over the counter, whereas informed traders may also split up an order into a series of smaller trades. We create a dummy variable, Order Splitting, that takes the value of one when a trade is the result of order splitting and zero otherwise. We identify order splitting when a dealer has multiple trades of the same bond in the same direction (buy or sell) with at most 48 hours between two transactions and without any offsetting trades.
Our second variable measuring information is based on the time elapsed since a dealer last traded the same security and is similar in spirit to the one used by Brancaccio et al. (2020). The idea is that dealers have more current information about securities that they have traded recently. More precisely, Informedness is defined as the negative of the logarithm of the time since a dealer last traded the same bond.15
Information is often revealed via order flow. Czech et al. (2021) show that the order flow by hedge funds and mutual funds predicts bond returns in the UK Gilt market, and Ranaldo and Somogyi (2021) present similar findings for the FX market. These results are consistent with Grossman (1992), in which information need not necessarily be about fundamental value but can also refer to expressed and unexpressed order flow. We use two proxy variables that indicate the direction of orders in the market. Aggregate Order Flow captures for each trade the net order flow of all preceding OTC trades on the same day, including customer trades, in all Bunds. Order Book Imbalance measures the contemporaneous imbalance between the best three levels on both sides of the limit order book of the same Bund. Both variables are defined as positive for trades in the direction of the market. We associate trading in the same direction as the market with a higher degree of information.
In line with information-based theories of hybrid markets, our hypothesis is that more informed transactions are routed via the exchange instead of OTC. Moreover, because the broker protocol provides anonymity, we expect that among all OTC transactions, trades with higher information content are more likely to be broker intermediated.
4.1.1.2. Search-and-Bargaining Frictions.
Search-based models of over-the-counter markets identify bargaining power as the crucial driver of OTC transaction costs. They predict that dealers with more bargaining power face lower transaction costs (Duffie et al. 2005, 2007; Duffie 2012). According to these theories, dealers will transact in the cheapest protocol. On the exchange, dealers do not face search costs and cannot exercise bargaining power.
Dealers’ inventory is a key factor in trading and pricing decisions (e.g., Stoll 1978, Amihud and Mendelson 1980). Inventory requires balance sheet capacity (Dick-Nielsen and Rossi 2019, Goldstein and Hotchkiss 2020, Colliard et al. 2021). Dealers with large inventory are more likely to be constrained and hence, in a worse bargaining position. We measure a dealer’s Inventory as her net imbalance over all Bunds on the same day prior to the trade divided by her average daily trading volume. The variable is signed so that it is positive for trades increasing a dealer’s net inventory position in absolute value. Search costs amplify inventory risk on volatile days, which reduces dealers’ bargaining power. We measure Volatility as the intraday price volatility of each bond on MTS. In line with the theories based on search and bargaining, we expect the probability to trade OTC to depend negatively on both Inventory and Volatility.
Previous studies have identified the dealer network structure and trading relations as important factors for pricing in OTC markets (e.g., Di Maggio et al. 2017, Li and Schürhoff 2019, Hendershott et al. 2020). Unfortunately, we only observe trades involving German financial institutions and are thus unable to reconstruct the full network structure of interdealer trades. Therefore, we use each dealer’s overall trading volume (Dealer Volume) as an indirect measure of network centrality (cf. Nikolova et al. 2020) and by extension, bargaining power. Our hypothesis is that dealers with a higher overall trading volume are more likely to trade OTC.
Duffie et al. (2005) argue that access to outside options increases dealers’ bargaining power. In the Bund market, dealers have the outside option to trade on the exchange. Because larger trades become increasingly expensive on MTS, this outside option vanishes with increasing Trade Size. Therefore, we expect larger trades to be less likely done via MTS. Moreover, as search costs are likely higher for larger trades and as brokers alleviate search costs, the probability to route an OTC trade via a broker should also increase in trade size.
Online Appendix E provides detailed definitions of all proxy variables as well as control variables in Table A.8 and their descriptive statistics in Table A.9.
4.1.2. Choice Between Exchange and OTC.
We study dealers’ choice between using the exchange or going OTC via the following probit model:
To account for potential nonlinearities with respect to trade size, we employ dummy variables for trades of 10–30 million Euro and for trades larger than 30 million Euro. The baseline hence consists of trades for 2.5–10 million Euro. In addition, Round Trade Size is a dummy variable that equals one for trades with a nominal amount of exactly 2.5, 5, or 10 million Euro, which are typical trade sizes on MTS, and zero otherwise. Controls is a vector of further control variables that capture bond-specific liquidity and bond characteristics.16 Throughout our analysis, all regressors except for dummy variables have been standardized to have a mean of zero and unit variance.
Specifically, we have
Table 5 provides the regression results. The first three columns in Table 5 show the marginal effects of the probit estimation of Equation (3), with standard errors clustered at the dealer level. We first analyze the role of information frictions in driving protocol choice. Our two measures of private information, order splitting and informedness, point in the same direction; more informed trades are more likely to be routed via MTS. Transactions that have been split into smaller trades are about two percentage points more likely to trade on MTS. Moreover, the probability to trade OTC increases by 0.75–1 percentage point with each standard deviation increase in informedness. In contrast to our expectation, we find weakly significant evidence that aggregate market-wide information (aggregate order flow and order book imbalance) increases the probability to trade OTC.
|
Table 5. Probability Model for Protocol Choice
| Interdealer trades: | OTC vs. MTS | Broker vs. bilateral | OTC | ||||
|---|---|---|---|---|---|---|
| (1) | (2) | (3) | (4) | (5) | (6) | |
| Order splitting (dummy) | −0.0232*** | −0.0197*** | 0.0664*** | 0.0647*** | ||
| (−3.7038) | (−3.1317) | (3.8505) | (2.7181) | |||
| Informedness | −0.0119*** | −0.0075*** | −0.0001 | −0.0125 | ||
| (−6.1722) | (−3.5398) | (−0.0105) | (−1.0042) | |||
| Aggregate order flow | 0.0050* | 0.0050* | 0.0050* | 0.0102 | 0.0111 | 0.0098 |
| (1.8605) | (1.8724) | (1.8995) | (1.0530) | (1.1435) | (1.0267) | |
| Order book imbalance | 0.0032* | 0.0029 | 0.0027 | −0.0058** | −0.0042 | −0.0045 |
| (1.7368) | (1.5727) | (1.5117) | (−2.0911) | (−1.4078) | (−1.5412) | |
| Inventory | 0.0085*** | 0.0066*** | 0.0066*** | 0.0217*** | 0.0193*** | 0.0193*** |
| (3.2592) | (3.0344) | (3.0054) | (3.1044) | (2.6956) | (2.7077) | |
| Volatility | −0.0331*** | −0.0290*** | −0.0290*** | −0.0040 | 0.0002 | 0.0001 |
| (−7.5524) | (−7.7091) | (−7.7118) | (−0.3978) | (0.0240) | (0.0121) | |
| Dealer Volume | −0.0177 | −0.0192 | −0.0185 | 0.1416*** | 0.1339*** | 0.1326*** |
| (−0.8827) | (−1.0488) | (−1.0078) | (2.7134) | (2.6322) | (2.6192) | |
| Trade size 10–30 million Euro (dummy) | 0.0262** | 0.0191* | 0.0200* | 0.2095*** | 0.2080*** | 0.2036*** |
| (2.3568) | (1.6539) | (1.7396) | (4.1278) | (4.0368) | (3.9766) | |
| Trade size >30 million Euro (dummy) | 0.1035*** | 0.0870*** | 0.0890*** | 0.3671*** | 0.3684*** | 0.3602*** |
| (3.8109) | (3.3454) | (3.3510) | (7.7604) | (7.6409) | (7.5038) | |
| Round trade size (2.5/5/10 million Euro, dummy) | −0.1688*** | −0.1523*** | −0.1508*** | |||
| (−9.3607) | (−8.1698) | (−8.2199) | ||||
| 0.4110 | 0.4073 | 0.4093 | 0.1854 | 0.1858 | 0.1886 | |
| N | 21,787 | 20,242 | 20,242 | 19,691 | 18,546 | 18,546 |
| Controls | Yes | Yes | Yes | Yes | Yes | Yes |
Notes. Marginal effects are at means of a probit model. In specifications (1)–(3), we estimate , where is a dummy variable that takes the value of one when transaction n takes place OTC and zero when it is on MTS. In specifications (4)–(6), we estimate , where is a dummy variable that takes the value of one when transaction n is broker intermediated and zero when it is bilaterally negotiated. is the standard normal cumulative distribution function, and is a vector of variables representing information and search-and-bargaining frictions as detailed in Equation (4) (cf. Section 4.1.2). This table is based on regulatory data including all transactions in Bunds involving German financial institutions from June 2011 through December 2017. Z-scores are given in parentheses, where standard errors are clustered at the dealer level.
*Significance at the 10% level; **significance at the 5% level; ***significance at the 1% level.
We now turn to the role of search-and-bargaining frictions as drivers of protocol choice. Dealers holding larger inventory of a given security are more likely to transact them OTC. A one-standard-deviation increase in inventory of a given security translates into a 0.66- to 0.85-percentage-point-higher probability that the transaction is OTC. On more volatile days, trading on the exchange is more likely. A one-standard-deviation increase in volatility increases the likelihood of routing a trade to the exchange by about three percentage points, in line with the notion that the outside option of search in the OTC market is less feasible.
Finally, larger transactions are less likely to be traded on the exchange. Trades in the 10–30 million Euro range are 1.9–2.6 percentage points more likely to be traded over the counter with respect to the baseline of trades for 2.5–10 million Euro. This effect is even more pronounced for trades larger than 30 million Euro, where OTC trading is about 8.7–10.5 percentage points more likely. Round trade sizes are significantly more likely on MTS.
In summary, these results show that both information and search-and-bargaining frictions impact dealers’ decision to trade on the exchange or in the OTC market. We next study the role of these frictions for the decision to trade bilaterally or via a broker.
4.1.3. Choice Between Broker and Bilateral OTC.
More than 75% of all interdealer trading is done via brokers. We model dealers’ decision to route an OTC trade via a broker or trade bilaterally with the following probit model:
The last three columns in Table 5 show the marginal effects of this probit model. We highlight the following results. First, more informed transactions are more likely to be intermediated by a broker than bilaterally negotiated; transactions that have been split into smaller trades are more than six percentage points more likely to be routed via a broker. That said, the alternative measure of informedness does not significantly affect the decision to trade via a broker.
Second, dealers with larger inventories are more likely to trade via brokers. A one-standard-deviation increase in dealer inventory increases the likelihood of broker intermediation by about two percentage points. Third, large dealers are more likely to trade via brokers than smaller ones. A dealer with a one-standard-deviation-larger total trading volume is about 14% more likely to trade via a broker. Fourth, larger trades are significantly more likely to be routed via brokers. OTC trades in the 10–30 million Euro range are more than 20 percentage points more likely to be broker intermediated. Trades larger than 30 million Euro are almost 40 percentage points more likely to be routed via a broker.
Our interpretation of these results is as follows. Larger and more central dealers as well as dealers with larger trading needs avoid trading bilaterally and instead, prefer to trade anonymously via brokers. Possible motives could be to maintain their informational advantage (Holland 2002, Babus and Kondor 2018) or to protect themselves against front-running (Harris 1997, Brunnermeier and Pedersen 2005) or back-running (Yang and Zhu 2020).17
In sum, our results suggest that more informed transactions are more likely to take place on the exchange. Among OTC trades, more informed transactions are more likely to be routed via an interdealer broker. Combined, they highlight the important role of information frictions in dealers’ trading decisions.
4.2. The Informational Content of Order Flows
In the previous section, we have shown that variables measuring the informational content of trades are strong predictors of the protocol in which dealers execute transactions. If there are systematic differences in the informational content of the three trading protocols, these should be reflected in aggregate order flows. Moreover, information is often associated with realized returns. We, therefore, follow the literature on informed trading in bond markets (e.g., Czech et al. 2021) to assess whether the informational content of trades is in line with the pecking order of transaction costs that we have documented. Specifically, we regress bond returns on order flows in each protocol as follows:
Here, denotes the cumulative log return of bond i from day d to day in basis points. , , and are the net total volume for each bond and trading day.18 Control variables include the customer order flows, the lagged return, the logarithm of the amount outstanding in the bond, and the logarithm of the remaining maturity. We also include bond and day fixed effects.
Table 6 shows the results of this regression for horizons equal to one, two, and five days. MTS order flow is statistically significant for the two- and five-day horizons and has the strongest price impact at all horizons. The coefficient on order flow via brokers is slightly smaller and statistically significant at the 5% level for the two-day horizon. By contrast, bilateral order flow is indistinguishable from zero at all horizons.
|
Table 6. Bond Returns and Interdealer Order Flows
| Dependent variable: | |||
|---|---|---|---|
| (1) | (2) | (3) | |
| MTS order flow | 0.0486 | 0.1601** | 0.1928* |
| (1.0749) | (2.4484) | (1.8694) | |
| Broker order flow | 0.0352 | 0.1193** | 0.0840 |
| (0.8374) | (1.9856) | (0.9004) | |
| Bilateral order flow | 0.0321 | 0.0487 | −0.0882 |
| (0.7653) | (0.7941) | (−0.9414) | |
| 0.4848 | 0.4875 | 0.4999 | |
| 0.4722 | 0.4750 | 0.4877 | |
| 0.0008 | 0.0011 | 0.0039 | |
| N | 73,990 | 73,925 | 73,620 |
| Bond FE | Yes | Yes | Yes |
| Date FE | Yes | Yes | Yes |
| Controls | Yes | Yes | Yes |
Notes. Ordinary Least Squares estimation of (see Equation (6) and Section 4.2). The dependent variable, , is the logarithmic return of bond i from end of day d to end of day given in units of basis points and trimmed at the 1st and 99th percentiles. All order flow variables are computed for each bond and trading day and are standardized. Control variables include customer order flow, the lagged return (in basis points), the logarithm of the amount outstanding in the bond (standardized), and the logarithm of the remaining maturity (standardized). The sample consists of 2-, 5- and 10-year Bunds from June 2011 through December 2017. Because 30-year Bunds are much less liquid and less often traded than other maturities, we exclude them from this part of our analysis. Order flow variables are based on regulatory data of all transactions in Bunds involving German financial institutions. t-values based on heteroskedasticity-robust standard errors are given in parentheses.
*Significance at the 10% level; **significance at the 5% level.
Our findings on the predictive content of order flow are consistent with the pecking order of transaction costs documented in Section 3. Trading on MTS is the most informative about future returns and also features the highest transaction cost. Trading via brokers has somewhat less predictive power and lower transaction costs. Bilateral trading, in turn, carries no information about future returns and features the lowest transaction costs. These results are also in line with our previous findings that more informed transactions are more likely done on the exchange and that better informed OTC transactions are more likely to be broker intermediated. Thus, information frictions represent a coherent explanation for the observed differences in transaction costs and dealers’ protocol choice.
5. Transaction Cost Differentials Within Protocols
In the previous sections, we have established a pecking order of transaction costs, which is consistent with informational differences across trading protocols. We now turn to an analysis of the drivers of OTC discount within protocols. To this end, we regress OTC discount on proxies of information and search-and-bargaining frictions.
5.1. Regression Specification
Transaction costs likely influence dealers’ protocol choice. Hence, trading protocol and OTC discount are likely determined jointly. To correct for this potential endogeneity in modeling OTC discount, we follow the standard approach of using a two-stage switching model (Madhavan and Cheng 1997, Bessembinder and Venkataraman 2004, Hendershott and Madhavan 2015). The first stage consists of estimating a model of protocol choice as in Section 4.1. In the second stage, we then relate OTC discount to explanatory variables and the inverse Mills ratio calculated from the first stage.
Assuming that error terms are jointly normal, we estimate the following equation separately for bilateral and broker OTC trades at the level of individual trades (indexed by n):
5.2. Estimation Results
Table 7 shows the estimation results, with standard errors obtained via bootstrap to account for correlation with protocol choice.21
|
Table 7. Intermediation Frictions and OTC Discount
| Interdealer trading protocol: | Bilateral OTC | Via broker | |
|---|---|---|---|
| (1) | (2) | (3) | |
| Price impact (15 min) | −2.2285*** | −2.2508*** | −1.3561** |
| (−3.2367) | (−3.2653) | (−2.4922) | |
| Order splitting (dummy) | −2.1973 | −2.6248* | −4.1521*** |
| (−1.3577) | (−1.7040) | (−3.1084) | |
| Informedness | −0.3288 | −0.3476 | −0.1769 |
| (−0.5334) | (−0.5730) | (−0.3222) | |
| Aggregate order flow | −1.7390*** | −1.7630*** | −1.4726*** |
| (−3.7491) | (−3.8898) | (−3.1311) | |
| Order book imbalance | −0.6214 | −0.5714 | 0.1480 |
| (−1.1937) | (−1.1137) | (0.2817) | |
| Inventory | −0.7140 | −0.7903 | −0.4154 |
| (−1.2631) | (−1.5358) | (−0.7993) | |
| Volatility | −10.2794*** | −10.3751*** | −15.9561*** |
| (−8.2978) | (−8.4067) | (−14.5200) | |
| Trade size (log) | −4.1577*** | −4.9888*** | −3.1803*** |
| (−3.2199) | (−6.0573) | (−2.8536) | |
| Top 5 dealer (dummy) | 7.4927*** | ||
| (5.9132) | |||
| Bottom 5 dealer (dummy) | −18.3482*** | ||
| (−5.7457) | |||
| Inverse Mills OTC | −0.2614 | −0.1349 | 0.3912 |
| (−0.4630) | (−0.2397) | (0.7183) | |
| Inverse Mills bilateral | 1.4963 | 0.2821 | |
| (0.9721) | (0.3288) | ||
| Inverse Mills broker | −5.9684*** | ||
| (−4.0760) | |||
| Intercept | 59.8610*** | 59.7788*** | 37.4653*** |
| (79.1175) | (74.8237) | (43.3042) | |
| 0.1344 | 0.1310 | 0.2161 | |
| 0.1106 | 0.1115 | 0.2069 | |
| 0.0799 | 0.0970 | 0.0772 | |
| N | 5,871 | 5,871 | 12,179 |
| Bond FE | Yes | Yes | Yes |
| Dealer FE | Yes | No | Yes |
| Controls | Yes | Yes | Yes |
Notes. Ordinary Least Squares estimation of (see Equation (7) and Section 5.1). The dependent variable, OTC discount, defined in Equation (1) in Section 3.1, is the difference between the price that a trade would have incurred on the exchange and the observed price of an OTC trade. We measure OTC discount as a fraction of the hypothetical transaction cost on the exchange. , as detailed in Equation (8), is a vector of variables representing information and search-and-bargaining frictions, fixed effects (FEs) for bond and initiating dealer, and a set of control variables. These include the MTS half-spread, depth at the MTS best, dummy variable for issuance days, dummy variable for cheapest-to-deliver securities, dummy variable for securities with on-the-run, bond age, and dummy variables for end-of-quarter days or end-of-year days. and , are the inverse Mills ratios controlling for protocol choice. The sample consists of bilaterally negotiated OTC trades between dealers in specifications (1) and (2) (row D2D via bilateral OTC in Table 2) and interdealer trades via interdealer brokers in specification (3) (row D2D via broker in Table 2). The minimum trade size is 2.5 million Euro in all specifications. This table is based on regulatory data including all transactions in Bunds involving German financial institutions from June 2011 through December 2017. Standard errors are obtained through sampling. t-values are given in parentheses.
*Significance at the 10% level; **significance at the 5% level; ***significance at the 1% level.
5.2.1. Bilaterally Negotiated Interdealer Trading.
Column (1) in Table 7 reports the coefficient estimates for bilaterally negotiated OTC trades. A one-standard-deviation increase in price impact is associated with a 2.2-percentage-point-lower OTC discount. Order splitting has a similarly large effect, which is not, however, statistically significant.22 We also do not find a statistically significant impact of informedness in the presence of the above two proxies for private information. The coefficient for aggregate order flow is negative and highly significant, implying that trades in the same direction as the overall market feature a lower OTC discount. These results suggest that dealers, at least to some extent, price discriminate against each other based on their counterparty’s perceived information.
We next turn to the role of search-and-bargaining frictions. Volatility, which makes the outside option of continued search more costly or less feasible, strongly raises transaction costs. A one-standard-deviation increase in volatility reduces OTC discount by about 10 percentage points. OTC discount also decreases with trade size. A one-standard-deviation-larger trade is associated with a 4.2-percentage-point-lower OTC discount.23 Importantly, our regression includes dealer fixed effects, which absorb any residual time-invariant differences in bargaining power across dealers. The estimated fixed effects show sizeable variation; the standard deviation across dealers amounts to 17.6 percentage points of the MTS half-spread—almost one third of the average OTC discount.
To further illustrate the effect of dealer-specific bargaining power, we construct dummy variables for the top and bottom five dealers in terms of their dealer fixed effects in column (1) in Table 7. In column (2) in Table 7, we repeat the estimation, including these dummies instead of dealer fixed effects. The top five dealers receive a 7.5-percentage-point-higher OTC discount, whereas the bottom five obtain a 18.3-percentage-point-lower OTC discount relative to their peers. These effects are again sizeable in light of the average OTC discount of 54.6%. This suggests that dealer-specific bargaining power plays a quantitatively important role for transaction cost over and above the proxies included in our regressions.
We show the robustness of our results in Online Appendix C. We consider alternative definitions of OTC discount, where we (a) normalize OTC discount by price instead of transaction cost and (b) include the effect of larger trades walking up the limit order book and consuming liquidity from deeper levels of the limit order book. All results are quantitatively and qualitatively in line with those presented here.
5.2.2. Broker-Intermediated Interdealer Trading.
We now investigate the determinants of OTC discount for trades intermediated by interdealer brokers. Column (3) in Table 7 shows the results. They highlight that the same set of drivers as for bilateral OTC trades affects transaction costs in the broker protocol.
Specifically, we find that higher price impact and the presence of order splitting are both associated with significantly lower OTC discounts. Although the coefficient on price impact is somewhat smaller compared with bilateral trades, the order splitting dummy is highly significant and almost twice as large. Trades that are part of a meta-order receive a discount that is 4.2 percentage points lower. Although the coefficient on informedness is negative as expected, it is not statistically significant. Trading in the same direction as the market also significantly reduces OTC discount. A one-standard-deviation-higher aggregate order flow implies a 1.5-percentage-point-lower OTC discount for broker-facilitated trades.
We now turn to measures of search-and-bargaining frictions. As before, days with higher volatility are characterized by substantially lower OTC discounts. The impact of volatility is about 50% larger than for bilateral trades and highly statistically significant. As for bilateral transactions, larger trades receive significantly smaller discounts. A one-standard-deviation increase in log trade size is associated with a 3.2-percentage-point-lower OTC discount.
Combined, these results show that more informed trades receive lower OTC discounts, in line with information-based theories of hybrid markets. At the same time, we find that less bargaining power translates into lower OTC discounts, consistent with search-and-bargaining-based theories of OTC markets. Although the coefficients differ slightly, the role of information and search-and-bargaining frictions is comparable across the two OTC protocols.
5.3. The Dealer-to-Customer Segment
Although our paper focuses on the hybrid market structure of the Bund interdealer segments and their main drivers, an interesting complementary question is how this structure and dealers’ pricing and trading decisions in the interdealer segment affect trading conditions in the dealer-to-customer segment. In Online Appendix F, we extend our analysis to the D2C segment of the Bund market and present three main findings. First, we observe an OTC discount with respect to MTS quotes even for D2C trades, suggesting that dealers pass on a substantial share of their transaction cost advantage to their clients. Second, information and search-and-bargaining frictions play a similar role in driving OTC discount as in the D2D segment. Third, dealers with more bargaining power in the interdealer segment offer lower transaction costs to their clients.
6. Conclusion
In an environment where academics and regulators increasingly call for a shift from traditional over-the-counter market structures toward electronic platforms and greater transparency, understanding the drivers of dealers’ pricing decisions across trading protocols is ever more important. Using a unique regulatory data set of securities transactions, our paper contributes to this debate along several dimensions. We find that the vast majority of OTC trades execute at favorable prices relative to the exchange limit order book. This OTC discount is significantly larger for bilateral than for broker-intermediated OTC trades, giving rise to a pecking order of transaction costs. Dealers’ decisions of where to execute a trade depend both on their bargaining power as well as on the information that they have. Consistently, we document that this pecking order is in line with the relative informedness of order flows from the different protocols. Moreover, we show that the variation of OTC discount across transactions within the same protocol is driven by both information and search-and-bargaining frictions, suggesting that both types of frictions are present in hybrid markets.
Our findings are relevant for the growing literature on OTC markets. Specifically, they suggest that both theoretical work and empirical work in this area should strive to account for the complex structure of today’s markets by considering (i) the coexistence of multiple trading protocols, (ii) the relevance of interdealer brokers, (iii) the importance of both information and search-and-bargaining frictions, and (iv) the interlinkages between the interdealer and D2C segments.
On the regulatory side, there is a strong effort to improve OTC market functioning. In Europe, the Markets in Financial Instruments Directive II (MiFID II) regulation was rolled out with the intention to improve market transparency, whereas in the United States, the Financial Industry Regulatory Authority (FINRA) has started to collect transaction-level data for sovereign bonds similar to that in the Trade Reporting and Compliance Engine (TRACE) database and the regulatory data set used in this paper. In recent years, there has also been a regulatory push away from OTC toward exchange-based trading. However, as pointed out by Dugast et al. (2022), a centralized exchange market is not always socially optimal as agents’ trading decisions are driven by their private incentives. Although our empirical analysis cannot shed light on the socially optimal market structure, our results suggest that there is substantial heterogeneity across trades and dealers. As a result, bilateral, broker-intermediated, and exchange-based trading protocols all play complementary roles in serving the different needs of dealers in a way that a single venue might not be able to achieve.
The authors are thankful for comments from the participants at the 8th Bundesbank Term Structure Workshop, the 31st Australasian Finance and Banking Conference, the 16th Paris December Finance Meeting, the 6th International Conference on Sovereign Bond Markets, the 2019 Annual Meeting of the Swiss Society for Financial Market Research, the 2nd Workshop on Over-the-Counter Markets, the 12th Annual Meeting of the Society for Financial Econometrics, the 27th Finance Forum, and the 26th Annual Meeting of the German Finance Association as well as Mario Bellia, Pierre Collin-Dufresne, Marco Di Maggio, Darrell Duffie, Peter Egger, Michael Fleming, Yalin Gündüz, Terrence Hendershott, Edith Hotchkiss, Sven Klingler (discussant), Juliane Krug (discussant), Tomy Lee (discussant), Fabrizio Lillo, Albert Menkveld, Florian Nagler (discussant), Stanislava Nikolova, Christian Opp, Roberto Pascual (discussant), Paolo Pasquariello, Angelo Ranaldo, Torsten Rothe, Stephen Schaefer, Kathi Schlepper, Norman Schürhoff (discussant), Philipp Schuster (discussant), Duane Seppi, Marti G. Subrahmanyam, Sebastian Vogel (discussant), Thomas Weinberg, Haoxiang Zhu, and numerous market participants. This paper represents the views of the authors and does not necessarily reflect the views of the Reserve Bank of Australia, the Deutsche Bundesbank, or the Eurosystem. This research was conducted as part of Calebe De Roure’s PhD studies at the Frankfurt School of Finance & Management. All errors are the authors’ own.
1 Cenedese et al. (2020) use similar terminology in their analysis of interest rate swaps. These contracts are traded in an OTC market, with some trades cleared via central counterparties (CCPs) and others not. They document that the same derivative contract is more expensive when not cleared via a CCP and label these price differentials OTC premia.
2 The previous literature has also associated heterogeneity in traders’ asset valuations and other trading needs with differences in transaction costs and venue choices in hybrid markets (e.g., Pagano 1989, Chowdhry and Nanda 1991, Babus and Parlatore 2022, Dugast et al. 2022).
3 A similar prediction is derived in Desgranges and Foucault (2005), where enduring relationships allow dealers to avoid being adversely selected by informed counterparties.
4 These results are complementary to Czech et al. (2021), who show that in the Gilt market, the order flows from informed groups of customers predict future returns.
5 We provide further information on the interdealer Bund market structure in the Online Appendix.
6 The MiFID II/MiFIR (Markets in Financial Instruments Regulation) regulation that came into effect in January 2018, after the end of our sample period, introduced provisions for post-trade transparency.
7 See the AFME (Association for Financial Markets in Europe) European Primary Dealers Handbook available at https://www.afme.eu/portals/0/globalassets/downloads/publications/afme-primary-dealers-handbook-q3-2017.pdf and the Online Appendix for institutional background on interdealer brokers.
8 For a detailed description of the data set and our matching approach, please refer to the Online Appendix.
9 This figure is in line with evidence provided by Pinter et al. (2022) for the UK Gilt interdealer market.
10 We infer the initiator of each trade by comparing the trade price with the contemporaneous midprice on the exchange as in, for example, Bessembinder and Venkataraman (2004). Whenever the observed trade price is above (below) the midprice of MTS at the full minute preceding the transaction, the trade is identified as buyer (seller) initiated. We do not assign a trade sign to trades at the midprice (about 3% of our sample), thus differing from the approach in Lee and Ready (1991).
11 We consider an average half bid-ask spread of four basis points on MTS and a daily trading volume of about 17 billion Euro for this calculation.
12 The variables used in the matching procedure are the next MTS bid-ask spread and depth; (logarithmic) trade size; the date; the bond identifier; the identity of the initiating dealer; the direction of the trade; volatility; inventory; order flow; informedness; and dummy variables for order splitting, whether a bond was issued or reopened on the same day, its status as the cheapest-to-deliver bond in the current futures contract, on-the-run status, and end-of-quarter and end-of-year effects. All variables are defined in Section 4. We enforce strict matching on the bond and dealer dimensions; that is, we allow only for perfect matches of trades from the same dealer in the same security. We impose minimum closeness criteria for the other matching characteristics. Furthermore, we only consider trades where the initiating party is obliged to report to our transactions database (i.e., where we observe the dealer’s full trading activity).
13 We consider the decision of whether to trade on the exchange first because execution there is certain and immediate.
14 In the Online Appendix, we conduct a robustness check by considering a multinomial logit model that does not rely on a particular hierarchy of choices. This analysis yields very similar results.
15 The variable is winsorized at the 1% and 99% percentiles, and its distribution is standardized at the dealer level; see the tables in the Online Appendix.
16 The vector includes MTS half-spread (half the MTS bid-ask spread), Depth at MTS best (logarithm of the volume available at the best), and a dummy variable that equals one for bonds that are Cheapest-to-deliver for currently active futures contracts. 2-year Schatz, 5-year Bobl, and 30-year Bund are dummy variables that indicate a maturity at issuance of 2, 5, or 30 years, respectively. Further control variables account for issuance days (dummy), (logarithmic) amount outstanding, bond age (as a percentage of original maturity), the coupon rate (in percent), end-of-quarter effects (dummy) and end-of-year effects (dummy), on-the-run status (dummy), and whether the dealer is a German financial institution (dummy).
17 In line with the first motive, Hagströmer and Menkveld (2019) find that strongly connected central FX dealers are more informed.
18 We trim returns at the 1st and 99th percentiles. Buyer-initiated (seller-initiated) transactions increase (decrease) net order flow. For a bond without any trades in a given day, the order flow is zero. Furthermore, we standardize all variables to have mean of zero and variance of one. As 30-year Bunds are considerably less often traded than other maturities, we exclude them from this part of our analysis.
19 Specifically, Controls accounts for MTS half-spread, depth at the MTS best, issuance days, cheapest-to-deliver and on-the-run status, bond age, and end-of-quarter and end-of-year effects.
20 Price impact captures the ex post reaction of MTS prices to trades. This reaction is structurally different across protocols. For example, when an exchange trade depletes levels of the order book, it immediately shifts prices even without a reaction from other market participants adjusting their limit orders. This is not the case for OTC transactions. For this reason and to avoid a potential endogeneity bias, we do not include price impact in our protocol choice estimations above.
21 Specifically, we draw 1,000 samples with replacement from our set of trades. For each sample, we repeat the protocol choice and OTC discount estimations, and we obtain standard errors from the distribution of coefficient estimates. We deem very large OTC premia as unrealistic and winsorize OTC discount from below at −100%. Our results are robust to omitting this step.
22 We have verified that our results do not materially change when considering similar horizons for price impact, such as 5 or 30 minutes, and when considering only the last child order in cases of order splitting.
23 Although in pure OTC markets, transaction costs typically decrease with trade size (Edwards et al. 2007, Green et al. 2007, O’Hara and Zhou 2021), Pinter et al. (2024) show that after controlling for trader fixed effects, transaction costs increase with size, in line with our setup and result. An and Song (2023) document a similar trade-size markup effect for Federal Reserve purchases of agency mortgage-backed securities (MBS).
References
- (2023) Centralizing over-the-counter markets? J. Political Econom. 131(12):3310–3351.Crossref, Google Scholar
- (1980) Dealership market: Market-making with inventory. J. Financial Econom. 8(1):31–53.Crossref, Google Scholar
- (2023) Does the federal reserve obtain competitive and appropriate prices in monetary policy implementations? Rev. Financial Stud. 36(10):4113–4157.Google Scholar
- (2024) Inferring intermediary risk exposure from trade. Management Sci. 70(10):6966–6982.Link, Google Scholar
- (2018) Trading and information diffusion in over-the-counter markets. Econometrica 86(5):1727–1769.Crossref, Google Scholar
- (2022) Strategic fragmented markets. J. Financial Econom. 145(3):876–908.Crossref, Google Scholar
- (2019) Brokers and order flow leakage: Evidence from fire sales. J. Finance 74(6):2707–2749.Crossref, Google Scholar
- (2006) Automation versus intermediation: Evidence from treasuries going off the run. J. Finance 61(5):2395–2414.Crossref, Google Scholar
- (2018) Government of Canada fixed-income market ecology. Bank of Canada Staff Discussion Paper No. 2018-10, Bank of Canada, Ottawa.Google Scholar
- (2004) Does an electronic stock exchange need an upstairs market? J. Financial Econom. 73(1):3–36.Crossref, Google Scholar
- (2020) A survey of the microstructure of fixed-income markets. J. Financial Quant. Anal. 55(1):1–45.Crossref, Google Scholar
- (2020) Learning by trading: The case of the U.S. market for municipal bonds. Working paper, Princeton University, Princeton, NJ.Google Scholar
- (2005) Predatory trading. J. Finance 60(4):1825–1863.Crossref, Google Scholar
- (2020) OTC premia. J. Financial Econom. 136(1):86–105.Crossref, Google Scholar
- (1991) Multimarket trading and market liquidity. Rev. Financial Stud. 4(3):483–511.Crossref, Google Scholar
- (2021) Inventory management, dealers’ connections, and prices in over-the-counter markets. J. Finance 76(5):2199–2247.Crossref, Google Scholar
- (2020) Market structure and transaction costs of index CDSs. J. Finance 75(5):2719–2763.Crossref, Google Scholar
- (2018) Do you know how your treasury trades are cleared and settled? Federal Reserve Bank of New York Liberty Street Economics Blog (September 12), https://libertystreeteconomics.newyorkfed.org/2018/09/do-you-know-how-your-treasury-trades-are-cleared-and-settled/.Google Scholar
- (2021) Informed trading in the government bond market. J. Financial Econom. 142(3):1253–1274.Crossref, Google Scholar
- (2005) Reputation-based pricing and price improvements. J. Econom. Bus. 57(6):493–527.Crossref, Google Scholar
- (2019) The cost of immediacy for corporate bonds. Rev. Financial Stud. 32(1):1–41.Google Scholar
- (2017) The value of trading relations in turbulent times. J. Financial Econom. 124(2):266–284.Crossref, Google Scholar
- (2019) The relevance of broker networks for information diffusion in the stock market. J. Financial Econom. 134(2):419–446.Crossref, Google Scholar
- (2012) Dark Markets: Asset Pricing and Information Transmission in over-the-Counter Markets (Princeton University Press, Princeton, NJ).Crossref, Google Scholar
- (2005) Over-the-counter markets. Econometrica 73(6):1815–1847.Crossref, Google Scholar
- (2007) Valuation in over-the-counter markets. Rev. Financial Stud. 20(6):1865–1900.Crossref, Google Scholar
- (2022) A theory of participation in OTC and centralized markets. Rev. Econom. Stud. 89(6):3223–3266.Crossref, Google Scholar
- (2007) Corporate bond market transaction costs and transparency. J. Finance 62(3):1421–1451.Crossref, Google Scholar
- (1997) The round-the-clock market for U.S. Treasury securities. FRBNY Econom. Policy Rev. 3(2):9–32.Google Scholar
- (1999) Price formation and liquidity in the U.S. Treasury market: The response to public information. J. Finance 54(5):1901–1915.Crossref, Google Scholar
- (2019) Over-the-counter market frictions and yield spread changes. J. Finance 74(6):3217–3257.Crossref, Google Scholar
- (2020) Over-the-counter versus limit-order markets: The role of traders’ expertise. Rev. Financial Stud. 33(2):866–915.Crossref, Google Scholar
- (2020) Providing liquidity in an illiquid market: Dealer behavior in US corporate bonds. J. Financial Econom. 135(1):16–40.Crossref, Google Scholar
- (2007) Financial intermediation and the costs of trading in an opaque market. Rev. Financial Stud. 20(2):275–314.Crossref, Google Scholar
- (1992) The informational role of upstairs and downstairs trading. J. Bus. 65(4):509–528.Crossref, Google Scholar
- (2019) Information revelation in decentralized markets. J. Finance 74(6):2751–2787.Crossref, Google Scholar
- (2024) Institutional brokerage networks: Facilitating liquidity provision. Rev. Financial Stud. 37(9):2903–2935.Crossref, Google Scholar
- (1997) Order exposure and parasitic traders. University of Southern California Working paper, University of Southern California, Los Angeles.Google Scholar
- (2015) Click or call? Auction versus search in the over-the-counter market. J. Finance 70(1):419–447.Crossref, Google Scholar
- (2020) Relationship trading in over-the-counter markets. J. Finance 75(2):683–734.Crossref, Google Scholar
- (2021) What is the impact of introducing a parallel OTC market? Theory and evidence from the Chinese interbank FX market. J. Financial Econom. 140(1):270–291.Crossref, Google Scholar
- (2002) The development of alternative trading systems in the UK Gilts market: Lessons and implications. Financial Market Structure Dynamics: Proc. Conf. (Bank of Canada, Ottawa), 29–33.Google Scholar
- (1991) Inferring trade direction from intraday data. J. Finance 46(2):733–746.Crossref, Google Scholar
- 2025) Regulating over-the-counter markets. J. Finance. 80(4):1929–1962.Google Scholar
- (2019) Dealer networks. J. Finance 74(1):91–144.Crossref, Google Scholar
- (1997) In search of liquidity: Block trades in the upstairs and downstairs markets. Rev. Financial Stud. 10(1):175–203.Crossref, Google Scholar
- (2021) Anonymous trading in equities. J. Finance 76(2):707–754.Crossref, Google Scholar
- (2017) Shades of darkness: A pecking order of trading venues. J. Financial Econom. 124(3):503–534.Crossref, Google Scholar
- (2009)
Treasury market, microstructure of the U.S . Meyers R, ed. Encyclopedia of Complexity and System Science (Springer, New York), 9565–9577.Crossref, Google Scholar - (2020) Institutional allocations in the primary market for corporate bonds. J. Financial Econom. 137(2):470–490.Crossref, Google Scholar
- (2021) The electronic evolution of corporate bond dealers. J. Financial Econom. 140(2):368–390.Crossref, Google Scholar
- (1989) Trading volume and asset liquidity. Quart. J. Econom. 104(2):255–274.Crossref, Google Scholar
- (2022) Information chasing versus adverse selection in over-the-counter markets. Bank of England Working Paper No. 971, Bank of England, London.Google Scholar
- (2024) Size discount and size penalty: Trading costs in bond markets. Rev. Financial Stud. 37(7):2156–2190.Crossref, Google Scholar
- (2021) Asymmetric information risk in FX markets. J. Financial Econom. 140(2):391–411.Crossref, Google Scholar
- (2020) Swap trading after Dodd–Frank: Evidence from index CDS. J. Financial Econom. 137(3):857–886.Crossref, Google Scholar
- (1990) Equilibrium block trading and asymmetric information. J. Finance 45(1):73–94.Crossref, Google Scholar
- (1978) The supply of dealer services in securities markets. J. Finance 33(4):1133–1151.Crossref, Google Scholar
- (2020) Back-running: Seeking and hiding fundamental information in order flows. Rev. Financial Stud. 33(4):1484–1533.Crossref, Google Scholar