
Executives in Politics
Abstract
We study the involvement of corporate executives in U.S. politics over the last 40 years. First, we document that the share of business politicians in federal elected office increased from 13.3% in 1980% to 22.6% in 2018, with most of the increase occurring over the last two decades. Second, we find that business politicians enjoy an early fundraising advantage over their opponents, both because they are more likely to self-fund their campaigns and because they receive more campaign contributions from their firms. Third, the election of business politicians benefits their industries and firms, which experience positive abnormal stock returns when their executives win political office. We also show that business politicians, once elected, vote for policies that shift the balance of power toward corporate interests. Using close elections for identification, we show that this policy shift cannot be attributed solely to the changes in the underlying preferences of the electorate. Overall, our results indicate that corporate executives have become more involved in U.S. politics and that this involvement has benefited business interests and affected aggregate legislative outcomes.
This paper was accepted by Gustavo Manso, finance.
Funding: The authors thank the Digital Age Management Research Area at the China Europe International Business School (CEIBS) and Centre for Applied Research on International Markets, Banking, Finance and Regulation (BAFFI CAREFIN) at Bocconi University for financial support. The Area and the Center played no role in study design, data collection and analysis, or preparation of the manuscript.
Supplemental Material: The data files and online appendix are available at https://doi.org/10.1287/mnsc.2022.4595.
1. Introduction
On November 8, 2016, Donald J. Trump won the U.S. Presidency. Although his election was unusual in many respects, Trump is just one of several examples of corporate executives running for political office. Other examples include Michael Bloomberg, a cofounder of Bloomberg L.P., who unsuccessfully ran for U.S. President in 2020, and Jon Corzine, a former chief executive officer (CEO) of Goldman Sachs, who in 2000 was elected U.S. Senator and in 2005 became the governor of New Jersey.1 The growing prominence of business leaders in government has motivated public debate about their effect on policy and raised legitimate concerns that business politicians may unduly shift the balance of power toward corporate interests. To examine whether these concerns are justified, we assemble a novel data set on corporate executives’ involvement in U.S. politics and analyze their impact on firms, industries, and legislative outcomes over the last 40 years.
We start by documenting recent trends in the number of corporate executives elected to federal office. On average, there are 72 business politicians holding federal elected office in any given election cycle between 1980 and 2000, and this average increases to 100 per election cycle in the period from 2002 to 2018. In fact, after staying relatively constant at approximately 13% between 1980 and 2000, the share of business politicians among federal office holders goes up in every election after 2000 and rises above 22% by 2018 (Figure 1).2
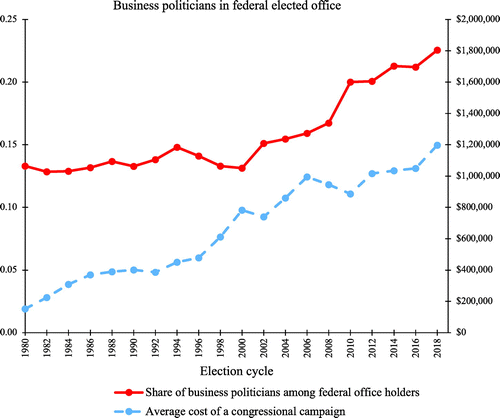
Notes. In this figure, the solid red line (measured against the left vertical axis) depicts, for each election cycle from 1980 to 2018, the share of federal office holders (U.S. Representatives, U.S. Senators, and U.S. Presidents/Vice Presidents) who, prior to being elected, held at least one position as the CEO, president, chairman/chairwoman, or founder/owner of any private or public for-profit nonagricultural firm. The dashed blue line (measured against the right vertical axis) depicts the average cost of a congressional campaign during the same period.
One factor that may have contributed to the increase in the number of business politicians is the rising cost of political campaigns (Figure 1). When campaigns are expensive, candidates who can either self-fund themselves or have access to a network of wealthy donors are likely to have an advantage. Although we cannot establish a causal link between campaign finance and the rise of executives in politics, we present several pieces of evidence suggesting that business politicians have a fundraising advantage over their opponents. First, we find that business politicians are more likely to self-fund their campaigns. In fact, 24% of business politicians contribute at least $1 million of their personal funds to their campaigns compared with 4% of nonbusiness politicians. Second, business politicians outraise their opponents early on in the campaign, which prior research suggests is important for electoral success (Bonica 2017). Finally, we show that some of business politicians’ fundraising advantage comes from their firms, which donate six times more money to their executives running for office than to other political candidates.
In the next set of tests, we examine how the election of business politicians affects their firms, industries, and U.S. legislation more generally. We start by documenting that the election of corporate executives generates material firm-value benefits. Firms whose executives win federal elections experience positive abnormal stock returns of 1.4% within three days of such elections, which translates into a market value increase of approximately $200 million for an average firm in the sample. Furthermore, we find evidence of positive industry spillovers: when a business politician is elected, his/her firm’s industry peers also experience positive abnormal stock returns.
Next, we analyze business politicians’ legislative behavior and their impact on aggregate U.S. policy. Identifying this impact is challenging because the voting behavior of business politicians may reflect the underlying preferences of their constituencies. To separate the policy impact of business politicians from the underlying preferences of their electorate, we perform two sets of tests. First, we compare the voting records of business politicians to the voting records of their predecessors and successors, which enables us to contrast the voting behavior of business politicians with the aggregate long-run preferences of their constituencies. Second, we examine the voting records of politicians who win close elections to identify how business politicians change aggregate policies, even if voters do not necessarily demand those changes. To the extent that the outcomes of close elections are determined by chance, this latter set of tests allows us to separate the legislative impact of business politicians from the contaminating influence of aggregate voter preferences.
In both sets of tests, we find that business politicians are more likely, relative to nonbusiness politicians, to vote for legislation supported by corporate interests and against legislation supported by labor unions. The effects we document are economically important, even after controlling for party affiliation.3 The magnitude of the effect associated with being a business politician is about one-third of the unconditional averages of the different voting record measures that we use. Because this policy shift cannot be attributed entirely to the changes in the underlying voter preferences, our results provide a new perspective on how policy might drift in favor of business interests without voters demanding such a shift.
Our findings indicate that business politicians are systematically different from other politicians and that, once elected, business politicians shift the balance of power toward corporate interests. However, our results are notably silent on executives’ underlying motives for entering politics. One possibility is that executives run for office to advance the greater good but also have preferences and beliefs that are shaped by their prior business experience. For example, business politicians may be particularly receptive to the needs of the industries in which they previously worked. Our results on industry returns support this idea and suggest that business politicians may take actions favorable to their industry even if they do not specifically seek to benefit their firms or themselves personally. It is therefore possible that prior experience of elected politicians at least partly shapes their legislative behavior, suggesting that some political outcomes can be achieved only if voters elect a different set of politicians.
Our paper contributes to the large literature that studies interactions between firms and politicians. This literature explores different ways in which firms participate in politics and argues that such participation may be valuable to firms. For example, state-owned firms may receive more subsidies from the government in exchange for providing excess employment and paying above market wages (Shleifer and Vishny 2004, Bertrand et al. 2018). Non–state-owned firms can invest in political capital by establishing direct connections with legislators (Faccio 2006, Duchin and Sosyura 2012), lobbying (Bertrand et al. 2014, Kang 2016, Bombardini and Trebbi 2020), financing candidates’ political campaigns (Stratmann 1992, Cooper et al. 2010), and influencing political contributions of their employees (Babenko et al. 2020). These activities may create value for shareholders through greater government subsidies, favorable antitrust reviews, preferential allocation of federal contracts, less strict regulation, and lighter taxation.4
Another strand of literature examines firm-value implications of corporate officers’ entry into politics, with a particular focus on countries with weak institutions. Using data on publicly traded firms in 47 countries, Faccio (2006) shows that firms whose officers or large shareholders obtain public office experience positive abnormal stock returns, and this effect is stronger in highly corrupt countries. Gehlbach et al. (2010) show that corporate executives may enter politics to avoid the cost of lobbying elected officials in an environment with weak democratic institutions. Relatedly, Bunkanwanicha and Wiwattanakantang (2009) argue that weak institutions can allow business politicians to engage in rent-seeking activities. They study the entrance of business tycoons into politics around the 2001 election in Thailand and find that market valuations of tycoons’ firms increase substantially when the tycoons get elected. In contrast to this earlier literature, our focus is on the role of business politicians in an environment characterized by relatively strong democratic institutions. In fact, our paper is the first to document an increased involvement of corporate executives in U.S. politics and systematically study the consequences of such involvement not only for their firms but also for aggregate political outcomes.
The rest of this paper is organized as follows. Section 2 describes the data and documents the extent of corporate executives’ participation in politics over the last 40 years. Section 3 analyzes business politicians’ campaign fundraising. Section 4 investigates the effect of corporate executives’ electoral wins on their firms and industries. Section 5 examines the impact of business politicians on legislative outcomes. Section 6 concludes.
2. Data, Sample Selection, and Supply of Business Politicians
We provide details of sample construction, which involves the processing of tens of millions of web searches, in Appendix A. Here, we briefly summarize the main steps in the sample construction process and describe how the number of corporate executives seeking political office has changed over time.
2.1. Data on Business Politicians Based on Official Biographies
For each election cycle between 1980 and 2018, we obtain the official biographies of all members of the U.S. Congress (Representatives and Senators) and U.S. Presidents/Vice Presidents who were elected (or re-elected) in that election cycle (2,045 office holders in total). By reading their official biographies, we identify all federal office holders (i.e., members of Congress and U.S. Presidents/Vice Presidents) who, prior to being elected, held at least one position as the CEO (i.e., chief executive officer), president, chairman/chairwoman, or founder/owner of any private or public for-profit nonagricultural firm. We refer to such federal office holders as “business politicians,” of which there are 390. We also identify firms in which they worked prior to being elected. Table 1, Panel A, reports aggregate summary statistics on the share of business politicians among all federal office holders. Over the 20 election cycles between 1980 and 2018, this share stands, on average, at 15.8% and reaches its maximum of 22.6% in 2018 (Figure 1). On average, 67.4% of business politicians run as Republicans.
|

Table 1. Summary Statistics
| N | Mean | 25th Percentile | Median | 75th Percentile | Standard deviation | |
|---|---|---|---|---|---|---|
| (1) | (2) | (3) | (4) | (5) | (6) | |
| Panel A: Sample based on official biographies | ||||||
| Number of unique federal office holders | 2,045 | — | — | — | — | — |
| U.S. Representatives | 1,711 | — | — | — | — | — |
| U.S. Senators | 323 | — | — | — | — | — |
| U.S. Presidents/Vice-Presidents | 11 | — | — | — | — | — |
| Number of unique federal office holders (business politicians) | 390 | — | — | — | — | — |
| U.S. Representatives | 335 | — | — | — | — | — |
| U.S. Senators | 51 | — | — | — | — | — |
| U.S. Presidents/Vice-Presidents | 4 | — | — | — | — | — |
| Share of business politicians in federal office, per election cycle | 20 | 15.8% | 13.3% | 14.5% | 18.4% | 3.3% |
| Share of business politicians who are Republicans | 390 | 67.4% | ||||
| Panel B: Sample based on BoardEx | ||||||
| Number of unique electoral campaigns by business politicians | 167 | — | — | — | — | — |
| Number of business politicians, per cycle | 19 | 8.8 | 6.0 | 8.0 | 12.0 | 3.1 |
| Share of elections won by business politicians, per cycle | 19 | 67.1% | 60.0% | 71.4% | 77.8% | 23.7% |
| Share of business politicians who are Republicans | 167 | 67.1% | ||||
| Panel C: Campaign contributions | ||||||
| Share of candidates giving $1 million or more of their personal funds to the campaign (all candidates) | 617 | 7.6% | 0.0 | 0.0 | 0.0 | 26.5% |
| Share of candidates giving $1 million or more of their personal funds to the campaign (primary winners only) | 251 | 12.4% | 0.0 | 0.0 | 0.0 | 33.0% |
| Contributions from PACs and individuals (all candidates) | 695 | 1,062.2 | 2.6 | 62.0 | 653.9 | 2,981.7 |
| Contributions from PACs and individuals (primary winners only) | 281 | 2,047.7 | 43.4 | 422.2 | 1,813.6 | 4,237.2 |
| Contributions from firms to politicians | 3,866 | 5.0 | 0.5 | 1.5 | 4.8 | 16.8 |
| Panel D: Committee assignments | ||||||
| Committee assignment indicator | 6,533 | 0.040 | 0 | 0 | 0 | 0.197 |
| Relevant industry indicator | 6,533 | 0.105 | 0 | 0 | 0 | 0.307 |
| Powerful committee indicator | 6,533 | 0.096 | 0 | 0 | 0 | 0.294 |
| Seniority (number of congressional terms) | 6,533 | 4.0 | 2.0 | 3.0 | 6.0 | 2.8 |
| Panel E: Voting records in the sample of close elections | ||||||
| CFA | 255 | 43.3 | 30.6 | 17.0 | 33.0 | 72.0 |
| CCUS | 575 | 71.5 | 24.8 | 55.0 | 79.0 | 92.0 |
| COPE | 562 | 45.3 | 37.3 | 11.0 | 33.0 | 84.0 |
| DW-NOMINATE × 100 | 574 | 13.7 | 35.8 | −22.3 | 24.7 | 43.3 |
Notes. This table reports summary statistics. Panel A is based on official biographies of federal office holders. The data are for election cycles from 1980 to 2018 and includes all federal office holders (U.S. Representatives, U.S. Senators, and U.S. Presidents/Vice Presidents). Panel B is based on the sample of BoardEx executives and covers election cycles from 1980 to 2016. Panel C reports summary statistics on campaign contributions in the sample of firms whose executives run for political office. Panel D reports summary statistics on business politicians’ committee assignments. Panel E reports summary statistics on voting records of winners of close elections (defined as elections won by a margin of 10% or less). Proconsumer ratings are provided by the Consumer Federation of America (CFA). Prolabor ratings are provided by the Committee on Political Education of the AFL-CIO (COPE). Probusiness ratings are provided by the Chamber of Commerce of the United States (CCUS). The ratings are based on the individual voting records of politicians. A higher rating by a given interest group indicates a voting record more aligned with that group’s preferences. The overall liberal/conservative scores (DW-NOMINATE) are developed by Poole and Rosenthal (1991), with a higher score indicating a more conservative voting record; DW-NOMINATE scores are multiplied by 100 to put them on a scale comparable to the other scores. All monetary amounts are in thousands of dollars.
We complement our sample of business politicians with data from a variety of other sources. For all members of Congress elected (or re-elected) between 1980 and 2016, we obtain data on their voting records and the bills that they introduce or cosponsor.5 We also collect campaign finance data for all candidates running for federal office during our sample period, regardless of whether they are ultimately elected or not.
2.2. Data on BoardEx Executives Running for Political Office
Although the sample of business politicians constructed from official congressional biographies enables us to study broad trends in executives’ political participation, it cannot inform us about the differences between business politicians and other politicians at the electoral stage (i.e., prior to becoming members of Congress); neither can it shed light on the extent to which the entry of executives into politics is supply- or demand-driven. To address these issues, we use the sample of corporate executives covered by BoardEx and track the incidence of people from this sample running for political office over time. BoardEx contains detailed biographies of all board members of S&P 1500 firms and provides employment details about all firms where a given individual worked, even if those firms are not part of S&P 1500.
The sample construction at this stage involves an algorithm that enables us to process tens of millions of search results. The details of this algorithm are provided in Appendix A; here we briefly describe the main steps. We start by identifying all people in BoardEx who have held, at any point in their BoardEx employment history, at least one position as the CEO, president, chairman/chairwoman, or founder/owner of any private or public for-profit nonagricultural firm (i.e., we choose the same types of executive positions that we use in constructing the sample of business politicians from official congressional biographies). This procedure leaves us with 61,502 unique individuals. We then build a web crawler to identify all instances in which any of these 61,502 executives run for political office.6 Having downloaded the relevant search results, we process them for keywords and then manually analyze the web pages that contain any mentions of corporate executives from BoardEx running for federal political office. In total, we perform 11,972,754 web searches and analyze 29,908,149 individual search results. Ultimately, we identify 167 campaigns for federal office between 1980 and 2016 in which BoardEx executives run. They win 98 of those 167 campaigns. The aggregate summary statistics for the sample of business politicians based on BoardEx are reported in Panel B of Table 1.
2.3. Supply of Business Politicians
Figure 1, where the solid red line depicts the share of business politicians among federal office holders, shows an increase in the number of such politicians after 2000. On average, there are approximately 72 business politicians holding federal office in any given election cycle between 1980 and 2000, and this average rises to 100 per election cycle in the period from 2002 to 2018. In fact, the share of business politicians among federal office holders has gone up in every election after 2000. Figure 1 also shows that the cost of congressional campaigns has risen during our sample period (the dashed blue line).7 This increase may have created a fundraising advantage for business politicians because they tend to be wealthier than the average citizen and because their rolodex is likely to include wealthy donors. Later in the paper we show that business politicians indeed enjoy a fundraising advantage over their opponents because they are more likely to self-fund their campaigns and because they benefit from contributions made by their firms.
Because the total number of federal office holders is fixed at 537 (435 U.S. Representatives, 100 U.S. Senators, one U.S. President, and one Vice President), the increase in the share of business politicians may have been accompanied by a decrease in the share of politicians with other types of experience. In Online Appendix B, therefore, we analyze three types of nonbusiness experience: service in the military, background in law, and agriculture experience. Although the share of politicians with experience in agriculture remained steady during our sample period, the share of politicians with a background in law and military service decreased (see Figure B.1), suggesting that business politicians replaced politicians with these types of experience.
Although most corporate executives (67.4%) run as Republicans, there are business politicians also among Democrats in every election cycle during our sample period. We explore the party affiliation of business politicians and its evolution over time in Figure 2. The bars in the figure show the share of business politicians among elected federal office holders separately for Republicans (the solid red bars) and Democrats (the shaded blue bars). The share of business politicians among Republicans averages 21.4% in our sample, whereas the share of business politicians among Democrats is 10.2% on average. The lines in the figure depict the share of Republicans among business politicians (the dashed green line) as well as the overall share of Republicans among elected federal office holders (the solid black line). As the figure shows, the recent increase in the number of business politicians cannot be solely attributed to the electoral strength of the Republican party because the share of Republicans in Congress remained fairly stable during our sample period. The share of business politicians, on the other hand, increased both among Republicans and Democrats, with most of the increase happening after 2000. In 1980, the share of business politicians among Republicans was 16.4% compared with 10.8% for Democrats. By 2018, these shares reached 31.7% and 14.4%, respectively.
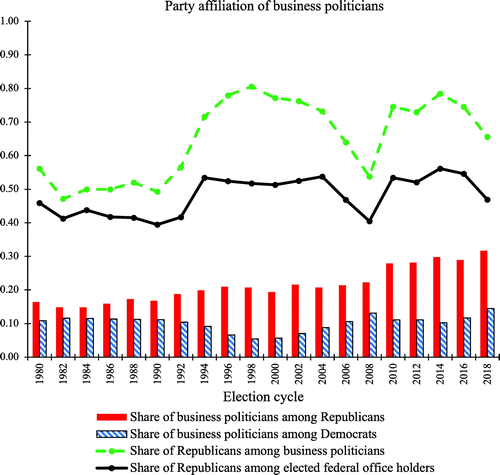
Notes. In this figure, the solid red bars depict, for each election cycle from 1980 to 2018, the share of business politicians among Republican elected federal office holders, whereas the shaded blue bars depict the share of business politicians among Democrat elected federal office holders. The dashed green line depicts the share of Republicans among business politicians elected to federal office whereas the solid black line depicts the overall share of Republicans among federal office holders.
Similar to the increase in the total number of business politicians elected to federal office, we observe an upward shift in the number of BoardEx executives running for office after 2000 (Figure 3). Specifically, the average number of BoardEx executives running for federal office in any given election cycle is about 7 in the period from 1980 to 2000, and this number rises to 11 per election cycle in the period from 2002 to 2016. This difference is statistically significant, suggesting that BoardEx executives are indeed more likely to run for office after 2000.
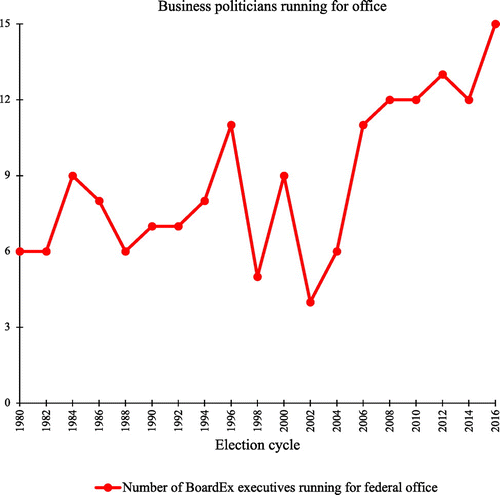
Notes. This figure shows the number of executives from the BoardEx database running for office in a given election cycle. The sample is restricted to BoardEx executives that held at least one position as the CEO, president, chairman/chairwoman, or founder/owner of any private or public for-profit nonagricultural firm prior to being elected.
Is the increase in the share of business politicians supply- or demand-driven? On the demand side, it could be that the preferences of U.S. voters have shifted toward politicians with skills that executives are more likely to possess, such as business acumen, leadership, or the ability to run complex organizations.8 On the supply side, executives may be more likely to seek political office because the rising cost of political campaigns has given them a relative advantage in fulfilling their personal political ambitions or because the benefits from political participation for their firms have increased. In reality, supply and demand are likely to be closely linked. For example, voters may perceive business politicians as being of higher quality than other candidates (thus increasing the demand for business politicians), and this perception may in turn encourage more executives to run for office (thus increasing supply).
We do not attempt to separate supply from demand, both of which may have contributed to the aggregate trends we observe. However, we find some suggestive evidence that supply-side factors (i.e., a higher propensity of business executives to enter politics) have been more important than demand-side factors in explaining the recent rise in the number of business politicians. In particular, corporate executives’ likelihood of winning political office, while remaining high, has decreased over time. This pattern is the opposite of what one would expect had the increase in the number of business politicians been driven entirely by greater demand. Specifically, the likelihood that a BoardEx executive running for political office wins an election averages 77.0% between 1980 and 2000 but then falls to an average of 49.5% between 2002 and 2016. Furthermore, the average number of nonbusiness politicians running for office between 1980 and 2000 is neither economically nor statistically different from the average number of nonbusiness politicians running for office between 2002 and 2016, implying that the increase in the number of executives running for office cannot be explained by a higher overall propensity of ordinary citizens to enter politics.
3. Political Contributions and Business Politicians’ Early Fundraising Advantage
The increase in the number of business politicians running for federal office has coincided with an increase in the cost of political campaigns. Because executives are typically wealthy and have access to a network of wealthy donors, they may be in a better position, relative to nonbusiness politicians, to afford these rising costs. It is also likely that executives’ ability to self-finance their campaigns has increased over time because of a well-documented increase in executive compensation (Edmans et al. 2017).
In this section, we examine whether business politicians have a fundraising advantage over their opponents and the extent to which this advantage comes early in the campaign, which prior literature has shown may be important for electoral success (Bonica 2017).9 Our goal is to compare business and nonbusiness politicians running for office regardless of whether they ultimately win elections.10 Therefore, in this set of tests, we focus on the BoardEx sample because it consistently tracks a set of executives who run for office, regardless of whether they win elections.
Federal election law puts strict limits on campaign contributions. However, these limits do not apply to the funds a candidate donates or lends to his or her own campaign, implying that self-funding by wealthy candidates can potentially create a fundraising advantage. To examine whether there is such an advantage, we compare the extent of self-funding among business politicians and their opponents. We define self-funded candidates as those candidates that give at least $1 million in personal funds to their own campaigns.11 As Panel A of Table 2 shows, self-funding is more prevalent among business politicians than among their opponents. In the sample of all candidates running in a given election, the share of self-funded business politicians is almost seven times higher than the share of self-funded nonbusiness politicians (23.6% compared with 3.5%). When we remove nonviable candidates by restricting the sample to the winners of primary elections, the differences in self-funding among business and nonbusiness politicians continue to persist (21.9% compared with 5.5%).
|
Table 2. Fundraising by Business Politicians and Their Opponents
| Business politicians | N | Nonbusiness politicians | N | t-stat | |
|---|---|---|---|---|---|
| (1) | (2) | (3) | (4) | (5) | |
| Panel A: Self-funding and contributions from PACs and individuals | |||||
| Share of candidates giving $1 million or more of their personal funds to the campaign (all candidates) | 23.6% | 127 | 3.5% | 490 | 8.00*** |
| Share of candidates giving $1 million or more of their personal funds to the campaign (primary winners only) | 21.9% | 105 | 5.5% | 146 | 4.01*** |
| Contributions from PACs and individuals (all candidates) | 1,866.8 | 146 | 848.2 | 549 | 3.70*** |
| Contributions from PACs and individuals (primary winners only) | 1,987.3 | 118 | 2,091.3 | 163 | −0.20 |
| Panel B: Business politicians’ fundraising advantage during the first 90 days of the campaign | |||||
| Contributions received in the first 90 days (all candidates) | 445.4 | 146 | 133.5 | 549 | 6.33*** |
| Contributions received in the first 90 days (primary winners only) | 410.8 | 118 | 223.6 | 163 | 2.32** |
Notes. This table compares campaign fundraising by business politicians and their opponents. Panel A reports the likelihood of self-funding as well the amount of campaign contributions from PACs and individuals other than the candidate running for office. The 1984 election cycle is the first election cycle for which data on the use of candidates’ own funds to finance their campaigns are available; therefore, the sample in the first two lines of Panel A is restricted to candidates running for office in 1984 or afterward. Candidates’ personal funds include both direct personal donations and well as personal loans to the candidates’ own campaigns. Panel B reports the amount of campaign contributions (excluding personal funds) received in the first 90 days from the start of the campaign. For each candidate, we define the earliest filing date of this candidate’s Statement of Candidacy as the start of the campaign. All amounts (excluding ratios) are in thousands of dollars. Standard errors, clustered by politician, are reported in parentheses.
*p < 0.1; **p < 0.05; ***p < 0.01.
Another source of business politicians’ fundraising advantage may come from their professional networks. Indeed, we find that business politicians raise more money from outside sources (i.e., sources that exclude self-funding) than do their opponents. In the sample of all candidates, business politicians receive $1.9 million in contributions from political action committees (PACs) and individuals compared with $848 thousand for nonbusiness politicians. In the sample of primary election winners, however, the total amounts business politicians and their opponents raise from outside sources are virtually identical. It is worth noting that these total amounts may conceal differences between business politicians and their opponents in terms of timing of their campaign fundraising, which is what we turn our attention to next.
To identify the dates when BoardEx executives and their opponents start their political campaigns, we rely on FEC Form 2 (Statement of Candidacy). This form, which has to be manually collected from the FEC website for each candidate, contains basic information about the candidate and the election in which he/she is running. When several Statements of Candidacy are available for the same candidate in the same election (e.g., an amendment is filed), we pick the form with the earliest filing date.
We compute the duration of an electoral campaign as the number of days between the filing date on the Statement of Candidacy and the election day. Based on this duration, we split each campaign into three equal time intervals (or stages): the beginning, middle, and end of campaign. We then collect contributions from PACs and individuals received by business politicians and their opponents during each stage of the campaign. Figure 4 shows that business politicians enjoy an early fundraising advantage over their opponents, both in the sample of all candidates as well as in the subsample of primary election winners. Figure 4 also shows business politicians’ cumulative fundraising advantage at each stage of the campaign, which we compute as the ratio of business politicians’ cumulative campaign contributions to their opponents’ cumulative campaign contributions. In the sample of all candidates, business politicians cumulative fundraising advantage persists throughout the entire campaign. The winners of primary elections, however, eventually catch up with their business politician opponents by the end of the campaign.
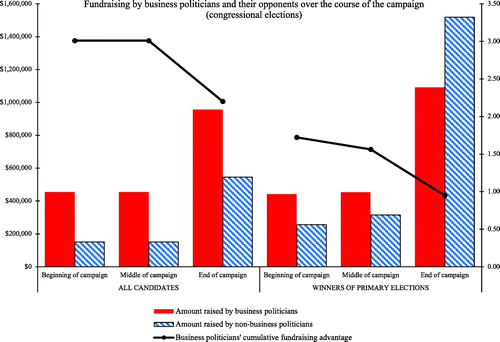
Notes. This figure shows the amounts of campaign contributions raised during different stages of the campaign and the cumulative fundraising advantage of business politicians from BoardEx over their opponents in congressional elections. (Left) All candidates in elections in which at least one business politicians from BoardEx runs for office. (Right) Restricted to the winners of primary elections. In both panels, the bars (measured against the left vertical axis) depict the average total dollar amounts of campaign contributions raised by business politicians (solid red bars) and their opponents (shaded blue bars) during different stages of the campaign (beginning, middle, and end). Beginning of campaign is defined as the first third of the total campaign duration (where campaign duration is measured as the time period from the filing date on the Statement of Candidacy to the election day); middle and end of campaign are defined similarly. In both panels, the solid black lines (measured against the right vertical axis) depict the ratio of the total cumulative campaign contributions raised by business politicians to the total cumulative campaign contributions raised by nonbusiness politicians by the end of the respective stage of the campaign.
In Panel B of Table 2 and in Table 3, we examine business politicians’ early fundraising advantage more closely by analyzing campaign contributions received in the first 90 days after a candidate initiates his/her campaign. In the sample of primary election winners, business politicians enjoy an almost 2:1 fundraising advantage over their opponents in the first 90 days, and this advantage is even bigger in the sample of all candidates. The differences between business politicians and their opponents persist also when we analyze fundraising in a regression framework (in Table 3), which enables us to control for election cycle fixed effects and candidate characteristics such as incumbency and party affiliation.
|
Table 3. Regressions of Campaign Contributions Received in the First 90 Days on the Business Politician Indicator and Controls
| Contributions received in the first 90 days of the campaign | ||||
|---|---|---|---|---|
| All candidates | Primary winners only | |||
| (1) | (2) | (3) | (4) | |
| Business politician indicator | 330.5*** | 264.7*** | 208.4* | 137.9 |
| (112.9) | (84.8) | (124.5) | (84.9) | |
| Incumbency indicator | 128.6 | 83.4 | ||
| (122.6) | (134.8) | |||
| Republican indicator | 25.5 | 101.8 | ||
| (46.4) | (94.4) | |||
| Observations | 695 | 695 | 281 | 281 |
| R2 | 0.10 | 0.11 | 0.12 | 0.13 |
| Election cycle fixed effects | Yes | Yes | Yes | Yes |
Notes. This table reports the results of regressions of campaign contributions received in the first 90 days from the start of the campaign on the business politician indicator and a set of controls. For each candidate, we define the earliest filing date of this candidate’s Statement of Candidacy as the start of the campaign. All amounts are in thousands of dollars. Standard errors, clustered by politician, are reported in parentheses.
*p < 0.1; **p < 0.05; ***p < 0.01.
The ability of business politicians to use their personal networks for fundraising may come from connections with their former firms. To investigate this possibility, we analyze campaign contributions that firms make to their executives running for office. We start with the sample of firms whose former or current executives run for political office at least once during our sample period and collect all campaign contributions made by these firms’ PACs and employees (we exclude candidate self-contributions from this analysis).12 We collect these contributions for all election cycles in our sample, including the cycles in which none of the firm’s executives run for political office.
We find that firms become more politically active (in terms of campaign contributions) when their executives run for office. As Table 4 shows, the total amount of campaign contributions that a firm makes to all political candidates more than doubles (from $41,000 to $85,000) when one of its executives runs for office. This increase in firms’ total campaign contributions can be attributed almost entirely to the contributions they make to their executives’ electoral campaigns. In fact, in 77.6% of the cases when a firm’s executive runs for office, this executive is the firm’s highest supported candidate (i.e., the political candidate receiving the largest dollar amount of total contributions from the firm).
|
Table 4. Campaign Contributions Made by Firms Whose Executives Run for Political Office
| A business politician runs for office | N | No business politician runs for office | N | t-stat | |
|---|---|---|---|---|---|
| (1) | (2) | (3) | (4) | (5) | |
| Total contributions (to all candidates) | 85.2 | 362 | 40.8 | 1,199 | 2.84*** |
| Share of business politicians who are their firm’s highest supported candidate | 77.6% | 362 | — | — | — |
Notes. This table compares the total amount of campaign contributions that firms make when their executives run for political office to the total amount of campaign contributions that firms make when their executives do not run for political office. The sample is limited to firms with at least one former or current executive running for office during our sample period. We retain all observations for such firms, including the observations for those election cycles in which no executive from these firms runs for office. The amounts exclude self-contributions. All amounts (excluding ratios) are in thousands of dollars.
*p < 0.1; **p < 0.05; ***p < 0.01.
We also find that firms provide larger financial support to their executives than to other politicians. On average, business politicians receive $53,000 from their firms (Table 5).13 In contrast, when none of the firm’s executives run for office, the average amount received by the firm’s highest supported candidate is $9 thousand.
|
Table 5. Firms’ Contributions to Business Politicians and to Highest Supported Candidates
| Contributions to the business politician running for office | N | Contributions to the highest supported candidate when no business politician runs for office | N | t-stat | |
|---|---|---|---|---|---|
| (1) | (2) | (3) | (4) | (5) | |
| Contributions from firms to politicians | 52.8 | 362 | 9.4 | 1,199 | 3.33*** |
Notes. This table compares campaign contributions received by business politicians from their firms with campaign contributions received by these firms’ highest supported candidates in election cycles in which business politicians from these firms do not run for office. The sample is limited to firms with at least one former or current executive running for office during our sample period. We retain all observations for such firms, including the observations for those election cycles in which no executive from these firms runs for office. The amounts exclude self-contributions. All amounts are in thousands of dollars.
*p < 0.1; **p < 0.05; ***p < 0.01.
In Table 6, we analyze corporate contributions in a regression framework, which enables us to include firm characteristics and a variety of fixed effects. The unit of analysis in these regressions is firm-candidate-election cycle: that is, we include all candidates that a given firm contributes to in a given election cycle, regardless of whether the candidate is the firm’s executive. The main explanatory variable in these regressions is an indicator set to one if the political candidate is the firm’s executive. This variable is set to zero if the candidate is not a business politician or is a business politician who is a former or current executive of a different firm.
|
Table 6. Regressions of Campaign Contributions on the Business Politician Indicator and Firm Characteristics
| Contributions from firms to politicians | ||||
|---|---|---|---|---|
| (1) | (2) | (3) | (4) | |
| Business politician running for office indicator | 34.3*** | 35.3*** | 35.4*** | 26.6** |
| (12.1) | (11.9) | (11.7) | (11.0) | |
| Firm size (log of 1 + Assets) | 0.8*** | 0.9*** | 2.1*** | |
| (0.2) | (0.3) | (0.7) | ||
| ROA | 14.3*** | 8.3** | 16.4** | |
| (3.8) | (3.3) | (6.8) | ||
| Tobin’s Q | −0.1 | 0.0 | −0.2 | |
| (0.1) | (0.1) | (0.3) | ||
| Capital expenditures | −10.5** | −13.2** | −29.0** | |
| (5.0) | (6.0) | (12.0) | ||
| R&D | −10.2** | −18.7 | 5.4 | |
| (4.4) | (13.2) | (31.8) | ||
| Observations | 3,866 | 3,866 | 3,866 | 3,866 |
| R2 | 0.03 | 0.04 | 0.05 | 0.28 |
| Election cycle fixed effects | Yes | Yes | Yes | Yes |
| Firm fixed effects | — | — | Yes | Yes |
| Politician fixed effects | — | — | — | Yes |
Notes. This table reports the results of regressions of campaign contributions received by a political candidate on firm characteristics and an indicator variable set to 1 if the candidate is the firm’s former or current executive. The sample is limited to firms with at least one former or current executive running for office during our sample period. We retain all observations for such firms, including the observations for those election cycles in which no executive from these firms runs for office. The amounts exclude self-contributions. All amounts are in thousands of dollars. Standard errors, clustered by politician, are reported in parentheses.
*p < 0.1; **p < 0.05; ***p < 0.01.
Regression results show that firms support their executives’ political campaigns even after we include election cycle, firm, and politician fixed effects. The estimates from our most stringent specification that includes the full set of fixed effects and control variables imply that executives receive, on average, $27,000 more from their firms compared with other politicians. This additional amount is more than five times larger than the unconditional sample average. These results are also robust to using a log transformation of campaign contributions (see Online Appendix B).
The financial support that firms provide to their executives’ electoral campaigns is consistent with the idea that these firms expect to benefit from their executives’ political wins. However, there may be other reasons for firms to support their former executives’ electoral campaigns. Such campaigns, for example, may serve as a cheap way to publicize the firm.14 To investigate this possibility, in Online Appendix B, we examine Google Trends that mention the executive’s name in conjunction with his/her firm when this executive announces his/her run for office. Although we do observe a spike in Google searches that mention the executive’s name alone or in conjunction with the name of the firm, this spike is rather transient and disappears almost entirely by the second week after the announcement. Furthermore, there is virtually no observable impact on Google searches for the firm’s name alone, suggesting that executives’ political campaigns generate little additional publicity for their firms. We conclude that this channel alone cannot fully explain firms’ willingness to contribute to their executives’ political campaigns and that there are other benefits that accrue to firms when their executives win political office. We therefore turn our attention to firm-value implications of business politicians’ electoral wins.
4. Firm-Value Implications
To assess firm-value benefits generated by business politicians, we compute cumulative abnormal stock returns (CARs) around the dates on which business politicians win political office. We also investigate if there are any spillovers from business politicians’ electoral wins to other firms in the same industry.
Table 7 reports the CARs for firms in which business politicians worked prior to running for office.15 The average CARs are positive, indicating that the market participants expect firms to benefit from having their former executives in elected office. The returns in our baseline model (reported in Panel A) range from 0.9% to 1.8%. In terms of market capitalization, an average firm in our sample gains approximately $200 million within three days after its executive wins an election.16 In Panel B of Table 7 and in Online Appendix B, we show that these results are robust to winsorization and are similar if we use the Fama-French three-factor model instead of the market model.17 In Online Appendix B, we also provide some evidence that firms whose executives hold large equity stakes experience higher equity returns around elections than firms whose executives hold small equity stakes. This evidence, although indirect, suggests that equity ownership may align the interests of business politicians with the interests of their firms.
|
Table 7. Firm-Value Implications of Business Politicians’ Winning Political Office
| CAR | N | t-stat | |
|---|---|---|---|
| (1) | (2) | (3) | |
| Panel A: CARs of firms whose executives win political office (baseline) | |||
| Event window (−1; +1) | 0.9% | 80 | 1.70* |
| Event window (−1; +3) | 1.4% | 80 | 2.13** |
| Event window (−1; +5) | 1.0% | 80 | 1.13 |
| Event window (−1; +7) | 1.8% | 80 | 1.79* |
| Panel B: CARs of firms whose executives win political office (returns winsorized at 5%) | |||
| Event window (−1; +1) | 0.6% | 80 | 1.90* |
| Event window (−1; +3) | 0.8% | 80 | 1.75* |
| Event window (−1; +5) | 0.8% | 80 | 1.52 |
| Event window (−1; +7) | 1.1% | 80 | 2.02** |
| Panel C: CARs of up to 10 closest firms by market cap in the same four-digit SIC industry (baseline) | |||
| Event window (−1; +1) | 0.6% | 583 | 2.61*** |
| Event window (−1; +3) | 0.6% | 583 | 2.03** |
| Event window (−1; +5) | 0.9% | 583 | 2.72** |
| Event window (−1; +7) | 0.6% | 583 | 1.58 |
| Panel D: CARs of up to 10 closest firms by market cap in the same four-digit SIC industry (returns winsorized at 5%) | |||
| Event window (−1; +1) | 0.5% | 583 | 3.61*** |
| Event window (−1; +3) | 0.4% | 583 | 1.85* |
| Event window (−1; +5) | 0.8% | 583 | 3.42*** |
| Event window (−1; +7) | 0.5% | 583 | 1.97** |
Notes. This table reports cumulative abnormal returns (CARs) around the dates of federal elections for firms whose executives win federal elected office as well as for other firms in the same four-digit SIC industry. Day 0 is the day of the election. CARs are based on the market model estimated over one trading year (255 trading days), with the estimation window ending two months (46 trading days) before the election date; the value-weighted CRSP index is used as the market return. Panel A reports the returns for all public firms in the sample whose executives win federal elected office. Panel B is constructed in the same way as Panel A but uses returns winsorized at 5% to minimize the impact of outliers. Panel C reports the returns for up to 10 closest firms (by market capitalization) in the same four-digit SIC industry as the firm whose executive wins federal elected office (not all four-digit SIC industries have 10 publicly traded firms). Panel D is constructed in the same way as Panel C but uses returns winsorized at 5% to minimize the impact of outliers. The t-statistics reported in this table are calculated by bootstrapping 10,000 samples of the data (with replacement), with bootstrap samples taken independently within each election cycle.
*p < 0.1; **p < 0.05; ***p < 0.01.
Next, we analyze whether the election of business politicians generates spillovers to other firms in the same industry. For each firm where a business politician worked prior to being elected, we identify up to 10 firms in the same four-digit Standard Industrial Classification (SIC) code that are closest to the business politician’s firm in terms of market capitalization.18 We then compute these firms’ CARs around the elections when business politicians win office. Our evidence (reported in Panel C and Panel D of Table 7) points to positive industry spillovers: that is, when a business politician is elected, his/her firms’ industry peers experience positive abnormal stock returns, which range from 0.6% to 0.9% in our baseline specification.
One mechanism through which business politicians, once elected, may generate value for their firms is their service on congressional committees. These committees have wide discretion in determining which bills ultimately become law and perform an important oversight function (Shepsle and Weingast 1987). Committee members, therefore, can have a substantial impact on firm value. For example, stock prices of major health insurance companies dropped by as much as 5% in April 2019 in response to a mere suggestion by Chuck Grassley, the then chair of the Senate Finance Committee, that the committee was considering new laws to regulate the market for prescription drugs.19 Although business politicians’ ability to join their preferred committees is not unlimited, existing congressional procedures give individual members considerable freedom in seeking committee assignments, subject to the constraints of seniority (Schneider 2006).20 Our results, reported in Table 8, suggest that the probability of a business politician joining a congressional committee more than doubles if this committee has jurisdiction over the industries where the business politician worked prior to being elected.21
|
Table 8. Business Politicians’ Service on Congressional Committees
| Committee assignment indicator | ||||
|---|---|---|---|---|
| (1) | (2) | (3) | (4) | |
| Relevant industry indicator | 0.063*** | 0.063*** | 0.061*** | 0.060*** |
| (0.019) | (0.019) | (0.019) | (0.020) | |
| Seniority | −0.001 | |||
| (0.001) | ||||
| Powerful committee indicator | 0.021 | |||
| (0.017) | ||||
| Observations | 6,533 | 6,533 | 6,533 | 6,533 |
| R2 | 0.02 | 0.02 | 0.04 | 0.04 |
| Election cycle fixed effects | Yes | Yes | Yes | Yes |
| Politician fixed effects | — | — | Yes | Yes |
Notes. This table reports the results of regressions of the likelihood that a business politician joins a congressional committee on an indicator variable set to one if the committee has jurisdiction over one of the industries in which the business politician had worked prior to running for office. To construct the sample, we first generate all possible combinations of congressional committees and business politicians. We then construct a dummy variable set to one for all business politician-committee pairs in which the business politician sits on a given committee (committee assignment indicator). Next, for each congressional committee and each business politician in our sample, we construct an indicator variable set to one if this committee has jurisdiction over any of the industries in which the business politician worked prior to being elected (relevant industry indicator). Seniority is the number of congressional terms during which a business politician served. Powerful committee indicator is set to one for the following House committees (in alphabetical order): appropriations, budget, commerce, rules, ways and means, and the following Senate committees (in alphabetical order): appropriations, armed services, commerce, finance, foreign relations. Standard errors, clustered by politician, are reported in parentheses. Note that, because of collinearity, seniority cannot be included in the specification that includes both politician and election cycle fixed effects.
*p < 0.1; **p < 0.05; ***p < 0.01.
Apart from service on congressional committees, business politicians may also affect firm value through legislation, the importance of which has been recognized in the literature (Cohen et al. 2013, Neretina 2019). To explore this possibility, in Online Appendix B, we analyze the CARs around the dates when legislation introduced by business politicians is passed in Congress. Following Neretina (2019), we identify the dates when bills clear the second chamber but are not yet signed into law by the President. Consistent with the idea that business politicians propose legislation favorable to their firms, we find that bill passage is associated with positive stock returns, which range from 1.1% to 2.3%.
Overall, our results indicate that corporate executives’ entry into politics benefits their firms and industries. In addition to firm- and industry-specific effects, however, business politicians may also have an aggregate impact on the U.S. policy and business climate more generally. It is this aggregate impact that we investigate next.
5. Aggregate Impact of Business Politicians on the Legislative Process
Because most politicians (including business politicians) introduce few bills, perhaps the biggest impact they can have on aggregate policy is by voting on bills introduced by others. Our next set of tests, therefore, aims to examine business politicians’ overall voting records.
To quantify politicians’ voting records, we use data on interest group ratings. These ratings provide a numerical score for each politician indicating how closely the politician’s voting record is aligned with the interests of a particular interest group. Probusiness ratings are provided by the Chamber of Commerce of the United States (CCUS); prolabor ratings are provided by the Committee on Political Education of the AFL-CIO (COPE); and proconsumer ratings are from the Consumer Federation of America (CFA). We also collect the overall liberal/conservative scores (DW-NOMINATE) developed by Poole and Rosenthal (1991) and available from the Voteview database (Lewis et al. 2019). Probusiness, proconsumer, and prolabor ratings range from 0 to 100, with a higher score indicating a stronger alignment with the preferences of the given interest group. The original DW scores range from –1 to +1, with a larger (positive) number indicating a more conservative voting record. We multiply DW scores by 100 to make their scale comparable to the other scores.
We are interested in business politicians’ causal impact on legislation. Identifying this impact is challenging because only politicians who ultimately win office can pass legislation. Therefore, the observable voting records may reflect not only business politicians’ own views on legislation but also the aggregate preferences of their voters. It may be, for example, that business politicians are elected as a consequence of aggregate shifts in voter preferences toward the policies advocated by such politicians.22 It is therefore important to separate the preferences of the electorate from the preferences of politicians, especially in light of recent evidence in Matsusaka (2021), who shows that legislators often vote their own preferences when their personal views diverge from the majority of their constituents.
To separate the legislative impact of business politicians from the aggregate preferences of their constituencies, we perform two sets of tests. First, we compare the voting records of business politicians to the voting records of their predecessors and successors. Second, we analyze the voting records of business politicians who win close elections.
To compare business politicians to their successors and predecessors, in Figure 5, we plot the voting patterns within the same constituency before, during, and after a business politician is in office. The figure is constructed in normalized event time to account for the fact that different business politicians serve a different number of terms. Time 0 indicates the first year that a business politician is in office, time 2 indicates the last year that a business politician is in office, and time 1 represents the average of a business politician’s voting score across all years during which he/she is in office. This procedure enables us to consistently compare voting scores of different politicians regardless of how many terms they serve. Time –2 and time –1 show the average voting scores of the business politician’s predecessor, whereas time 3 and time 4 show the average voting scores of the business politician’s successor, all within the same constituency. The figure includes four panels: the top two panels contain liberal voting scores associated with proconsumer and prolabor interest groups, whereas the bottom panels contain conservative voting scores associated with probusiness interest groups and the overall conservativeness of a politician.
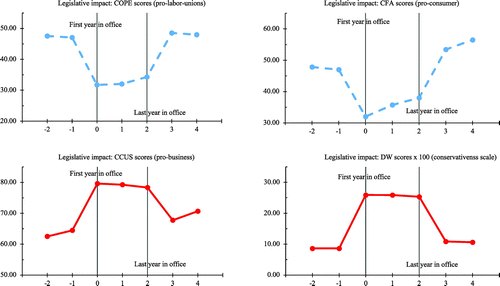
Notes. This figure reports legislative scores before, during, and after a business politician holds office. The time scale is normalized: time 0 is the first year during which a business politician is in office, time 2 is the last year during which a business politician is in office, whereas the value at time 1 represents the average value of a given legislative score over all the years during which a business politician is in office (see text for details). DW scores are multiplied by 100 to put them on a scale comparable to the other scores.
In all four panels in Figure 5, we observe sharp changes in voting scores immediately after a business politician assumes office and immediately after he or she leaves office, which suggests that the voting behavior of business politicians cannot be fully explained by permanent long-run political preferences of their constituencies. Relative to their immediate predecessors and successors, business politicians consistently vote in line with corporate interests and against proconsumer and prolabor interests.23 This evidence suggests that, in addition to generating firm- and industry-specific benefits discussed earlier, business politicians also shape aggregate policies in a way that favors corporate interests.
The graphical evidence in Figure 5 suggests that permanent long-run political preferences of voters cannot fully explain the behavior of business politicians. However, this evidence is not sufficient to rule out the influence of temporary shifts in voter preferences on the behavior of business politicians. Nor does this evidence allow us to isolate the effect of party affiliation. We address these challenges in our next set of tests, in which we compare the voting scores of business and nonbusiness politicians who win close elections (we use the victory margin of 10% to identify close elections).
To the extent that the outcomes of close elections are determined by chance, the policies that the winners of such elections implement cannot be attributed solely to the shifts in aggregate voter preferences. After all, had all voters supported business politicians’ policies, the elections of such politicians would not have been close. Therefore, the differences in voting scores between business and nonbusiness politicians who win close elections should identify the causal effect of business politicians on legislation, free from the contaminating influence of aggregate voter preferences.
In Tables 9 and 10, we regress the voting scores of winners of close elections on the business politician indicator variable as well as party affiliation (i.e., the Republican indicator variable) and election cycle fixed effects.24 Consistent with the graphical evidence presented earlier, we find that business politicians are more likely than nonbusiness politicians to vote against the interests of labor unions and consumers. Business politicians also accumulate a more conservative overall voting record relative to their nonbusiness peers, even after controlling for party affiliation. The effect of business politicians on probusiness policies, although economically sizeable, is not statistically significant in the sample of close elections. In some specifications in Tables 9 and 10, we directly control for aggregate voter preferences by including the Republican vote share as an explanatory variable. This variable never enters significantly, suggesting that our identification strategy is successful at removing the effects of aggregate voter preferences. In Online Appendix B, we show that the results reported in Tables 9 and 10 continue to hold also when we drop cases in which both candidates in the general election are business politicians. We remove such cases to avoid instances in which the election winner is bound to be a business politician regardless of the vote outcome.
|
Table 9. Impact of Business Politicians on U.S. Legislation: Evidence from Close Elections, Liberal Ratings
| CFA | COPE | |||
|---|---|---|---|---|
| (1) | (2) | (3) | (4) | |
| Business politician indicator | −10.7** | −10.8** | −7.1* | −7.2* |
| (4.9) | (5.0) | (3.9) | (3.8) | |
| Republican indicator | −48.7*** | −49.0*** | −65.8*** | −63.4*** |
| (4.6) | (6.2) | (2.3) | (3.2) | |
| Republican vote share | 0.1 | −0.5 | ||
| (0.8) | (0.5) | |||
| Observations | 255 | 255 | 562 | 562 |
| R2 | 0.63 | 0.63 | 0.80 | 0.80 |
| Election cycle fixed effects | Yes | Yes | Yes | Yes |
Notes. This table reports the results of regressions of interest group ratings for U.S. Representatives and U.S. Senators elected (or re-elected) between 1980 and 2016. The sample includes only close elections in which a business politician either narrowly won or narrowly lost by a margin of 10% or less. Proconsumer ratings are provided by the Consumer Federation of America (CFA). Prolabor ratings are provided by the Committee on Political Education of the AFL-CIO (COPE). The ratings are based on the individual voting records of politicians. A higher rating by a given interest group indicates a voting record more aligned with that group’s preferences. Not all ratings are available for all politicians in all years, which explains the varying sample sizes. Standard errors, clustered by politician, are reported in parentheses.
*p < 0.1; **p < 0.05; ***p < 0.01.
|
Table 10. Impact of Business Politicians on U.S. Legislation: Evidence from Close Elections, Conservative Ratings
| Panel B: Probusiness interest group ratings (CCUS), the overall conservative/liberal score (DW-NOMINATE) | ||||
|---|---|---|---|---|
| CCUS | DW-NOMINATE x 100 | |||
| (1) | (2) | (3) | (4) | |
| Business politician indicator | 4.6 | 4.6 | 11.2*** | 11.2*** |
| (4.6) | (4.4) | (3.8) | (3.5) | |
| Republican indicator | 37.7*** | 35.6*** | 66.8*** | 63.4*** |
| (2.4) | (3.5) | (2.5) | (3.7) | |
| Republican vote share | 0.4 | 0.7 | ||
| (0.5) | (0.6) | |||
| Observations | 575 | 575 | 574 | 574 |
| R2 | 0.64 | 0.64 | 0.87 | 0.87 |
| Election cycle fixed effects | Yes | Yes | Yes | Yes |
Notes. This table reports the results of regressions of interest group ratings for U.S. Representatives and U.S. Senators elected (or re-elected) between 1980 and 2016. The sample includes only close elections in which a business politician either narrowly won or narrowly lost by a margin of 10% or less. Probusiness ratings are provided by the Chamber of Commerce of the United States (CCUS). A higher rating indicates a voting record more aligned with business interests. The overall liberal/conservative scores (DW-NOMINATE) are developed by Poole and Rosenthal (1991), with a higher score indicating a more conservative voting record; DW-NOMINATE scores are multiplied by 100 to put them on a scale comparable to the other scores. Not all ratings are available for all politicians in all years, which explains the varying sample sizes. Standard errors, clustered by politician, are reported in parentheses.
*p < 0.1; **p < 0.05; ***p < 0.01.
In addition to the evidence from close elections, we perform similar regressions on the full sample and report the results in Tables 11 and 12. Although the results in Tables 11 and 12 are less well identified than those reported in Tables 9 and 10, the two sets of results are not dissimilar. In the full sample, we find that the propensity of business politicians to favor corporate interests is not only economically but also statistically significant.
|
Table 11. Impact of Business Politicians on U.S. Legislation: Large-Sample Evidence, Liberal Ratings Evidence
| CFA | COPE | |||
|---|---|---|---|---|
| (1) | (2) | (1) | (2) | |
| Business politician indicator | −5.5*** | −5.5*** | −4.6*** | −4.5*** |
| (1.6) | (1.6) | (1.2) | (1.2) | |
| Republican indicator | −45.9*** | −44.5*** | −70.1*** | −65.3*** |
| (1.0) | (1.3) | (0.8) | (1.1) | |
| Republican vote share | −0.0 | −0.2*** | ||
| (0.0) | (0.0) | |||
| Observations | 8,380 | 8,380 | 16,157 | 16,157 |
| R2 | 0.62 | 0.62 | 0.82 | 0.82 |
| Election cycle fixed effects | Yes | Yes | Yes | Yes |
Notes. This table reports the results of regressions of interest group ratings for all U.S. Representatives and U.S. Senators elected (or re-elected) between 1980 and 2016. Proconsumer ratings are provided by the Consumer Federation of America (CFA). Prolabor ratings are provided by the Committee on Political Education of the AFL-CIO (COPE). The ratings are based on the individual voting records of politicians. A higher rating by a given interest group indicates a voting record more aligned with that group’s preferences. Not all ratings are available for all politicians in all years, which explains the varying sample sizes. Standard errors, clustered by politician, are reported in parentheses.
*p < 0.1; **p < 0.05; ***p < 0.01.
|
Table 12. Impact of Business Politicians on U.S. Legislation: Large-Sample Evidence, Conservative Ratings
| CCUS | DW-NOMINATE x 100 | |||
|---|---|---|---|---|
| (1) | (2) | (1) | (2) | |
| Business politician indicator | 3.4*** | 3.2*** | 5.1*** | 4.9*** |
| (0.9) | (0.9) | (1.3) | (1.3) | |
| Republican indicator | 45.2*** | 38.3*** | 73.8*** | 64.6*** |
| (0.6) | (1.0) | (0.9) | (1.2) | |
| Republican vote share | 0.2*** | 0.3*** | ||
| (0.0) | (0.0) | |||
| Observations | 16,568 | 16,568 | 16,569 | 16,569 |
| R2 | 0.70 | 0.71 | 0.86 | 0.87 |
| Election cycle fixed effects | Yes | Yes | Yes | Yes |
Notes. This table reports the results of regressions of interest group ratings for all U.S. Representatives and U.S. Senators elected (or re-elected) between 1980 and 2016. Probusiness ratings are provided by the Chamber of Commerce of the United States (CCUS). A higher rating indicates a voting record more aligned with business interests. The overall liberal/conservative scores (DW-NOMINATE) are developed by Poole and Rosenthal (1991), with a higher score indicating a more conservative voting record; DW-NOMINATE scores are multiplied by 100 to put them on a scale comparable to the other scores. Not all ratings are available for all politicians in all years, which explains the varying sample sizes. Standard errors, clustered by politician, are reported in parentheses.
*p < 0.1; **p < 0.05; ***p < 0.01.
Overall, our evidence suggests that business politicians shift the balance of power toward corporate interests by supporting probusiness legislation and voting against the legislation supported by labor unions. Importantly, this policy shift cannot be attributed entirely to the changes in the underlying voter preferences.
6. Conclusion
We document a rising trend in the number of corporate executives seeking political office in the United States and find evidence that the election of business politicians affects their firms, industries, and aggregate U.S. policy.
At the electoral stage, business politicians enjoy a fundraising advantage over their opponents, especially early on in the campaign. Part of this advantage can be attributed to a greater propensity of business politicians to self-fund their campaigns and to campaign contributions from their firms, which donate six times more to their executives running for office than to other candidates.
We also find that the electoral wins of business politicians are associated with positive stock returns for their firms and industries. Once elected, business politicians are likely to join congressional committees with jurisdiction over their industries.
Finally, we examine business politicians’ aggregate voting records and find that they generally vote in favor of business interests and against the interests of labor unions. Using close elections for identification, we show that business politicians may change aggregate policies, even if voters do not necessarily demand those changes. Overall, the entry of corporate executives into politics appears to have shifted the balance of power toward corporate interests.
The authors thank Gustavo Manso (the editor), an anonymous associate editor, three anonymous referees, Pat Akey, Heitor Almeida, Jonathan Brogaard, Michael Cooper, Andy Eggers, Itay Goldstein, Nandini Gupta, Diana Henriques, Alexander Hertel-Fernandez, Candace Jens, Steve Kaplan, Christopher Malloy, Ronald Masulis, John Matsusaka, Harold Contreras Muñoz, Alexei Ovtchinnikov, Abraham Ravid, Paola Sapienza, Martin Schmalz, Antoinette Schoar, Florian Schulz, Rik Sen, Philip Strahan, Ed Van Wesep, Bernie Yeung, seminar participants at the BI Norwegian Business School, Chinese University of Hong Kong Shenzhen, Florida State University, Fudan University, Imperial College London, Temple University, University of Amsterdam, University of Graz, University of New South Wales, University of Utah, and participants at the 2019 Finance Down Under Conference, 2019 The Financial Intermediation Research Society Conference, 2018 Society for Financial Studies Cavalcade, 2018 Santiago Finance Workshop, 2018 European Finance Association meeting in Warsaw, 2018 Conference on Corporate Political Engagement in Europe and the United States at Oxford University, and 2018 Tel Aviv University Finance conference for useful comments. Giorgia Albertini, Fangfang Du, Andres Vargas Nava, Tingquan Pan, Zachary White, and especially Karolus Sariola provided invaluable research assistance.
Appendix A. Details of Sample Construction
A.1. Sample of Business Politicians Based on Official Biographies
We identify all federal office holders (i.e., U.S. Representatives, U.S. Senators, and U.S. Presidents/Vice Presidents) who were elected (either for the first time or re-elected for a subsequent term) at any point of time between 1980 and 2018. We then obtain their official biographies, available at http://bioguide.congress.gov/biosearch/biosearch.asp (accessed November 27, 2019) and at https://www.govtrack.us (accessed September 24, 2016). We use both sources for our analysis, and the latter one also contains the list of all bills sponsored and co-sponsored by each U.S. Representative and U.S. Senator. In total, we identify 2,045 federal office holders, of which 1,711 are U.S. Representatives, 323 are U.S. Senators, and 11 are U.S. Presidents/Vice-Presidents (the U.S. President and Vice President are always elected simultaneously, with one U.S. Vice President, George H. W. Bush, later becoming President himself).
For each federal office holder identified in the previous step, we read his or her official biography to find all people who, prior to being elected, held at least one position as the CEO, president, chairman/chairwoman, or founder/owner of any private or public for-profit nonagricultural firm. We term such federal office holders “business politicians,” of which we identify 335. In rare cases, a person may obtain executive experience between his/her terms in federal office. For example, Dick Cheney served in the U.S. House of Representatives until 1989, at which point he became the Secretary of Defense (from 1989 to 1993) and later the CEO of Halliburton Company (from 1995 to 2000). He then became the Vice President of the United States in 2000 and served in this capacity until 2008. In such cases, the office holder is termed a business politician during the terms for which he/she was elected after having obtained executive experience and is termed a nonbusiness politician during all other terms. For example, Dick Cheney is considered a nonbusiness politician prior to 1995 and a business politician afterward.
In the next step, we identify the firms in which business politicians worked prior to being elected. We select only those firms that were publicly traded at the time of the election (38 unique firms). For all politicians whose firms have stock returns data available, we obtain, whenever possible, the data on their stockholdings in those firms. The first source of stockholdings data are the DEF 14A filings from the Securities and Exchange Commission (SEC). For each election, we obtain the most recent DEF 14A filing prior to election, when available.25 The second source of stockholdings data are congressional personal finance disclosure forms, which, after 2004, are publicly available from the Senate Office of Public Records and the Office of the Clerk of the House; these forms are also provided in machine readable format by the Center for Responsive Politics (https://www.opensecrets.org/personal-finances) (accessed September 24, 2016). It is not always possible to precisely identify the number of stockholdings of each stock for each politician because politicians are required to report the amount of each of their assets within one of several ranges. In such cases, we use midpoints. However, some politicians provide additional information on the exact holdings of stock in individual firms; we use these more detailed disclosures when available. The SEC electronic data are only available from 1994, and congressional financial disclosures start in 2004, which therefore reduces the sample of office holders for which we have stockholdings data to 20 unique politicians and 33 unique firms.
Furthermore, we obtain data on the legislation introduced by U.S. Representatives and Senators elected (or re-elected) between 1980 and 2016 from https://www.govtrack.us (accessed September 24, 2016). A politician who introduces a piece of legislation is termed the bill’s “sponsor.”26 In total, we analyze 3,299 bills. Because not all bills are signed into law, we also identify, among the bills each legislator sponsors, the ones that ultimately pass (89 bills).
To characterize voting patterns, we obtain data on interest group ratings for all politicians in our sample. Probusiness ratings are provided by the Chamber of Commerce of the United States (CCUS); prolabor ratings are provided by the Committee on Political Education of the AFL-CIO (COPE), and proconsumer ratings are from the Consumer Federation of America (CFA). We also collect the overall liberal/conservative scores (DW-NOMINATE), developed by Poole and Rosenthal (1991). Probusiness, proconsumer, and prolabor ratings run from 0 to 100, with a higher score indicating a stronger alignment with the preferences of the given interest group. The original DW scores run from –1 to +1, with a larger number indicating a more conservative voting record. We multiply DW scores by 100 to make their scale comparable to the other scores. Not all scores are available for all politicians in all years, which generates varying sample sizes.
A.2. Sample of Business Politicians Based on BoardEx
We start by identifying all people in the BoardEx database who held at least one position as the CEO, president, chairman/chairwoman, or founder/owner of any private or public for-profit nonagricultural firm. In particular, we retain all people, who, according to their employment history in BoardEx, held at least one of the following titles: CEO, Chairman/Chairwoman, President, and Founder.27 We also restrict the sample to positions in nongovernment firms located in the United States. This leaves us with 61,502 unique people who hold 152,762 unique positions (i.e., unique person-firm combinations).
For each person identified in the previous step, we build online search queries of the following form: “Person’s name” + “Company name” + “Political office” + “Elect,” where “Political office” denotes a federal elected office. We separately search for each combination of the following: “US/United States” + “House/Senat/Congress/President” (notice that “Senat” represents “Senator”, “Senate”, “Senatorial”, etc.). Furthermore, we perform a separate search for each unique person-firm-office combination, for a total of 1,994,920 unique search queries. An alternative to building a web crawler is to match BoardEx executives with FEC files containing all political candidates. However, this strategy is not viable for two reasons. First, the FEC files provide no data on prior experience or occupation of political candidates. Second, a match between BoardEx and FEC produces a large number of false positives. For example, David Smith (CEO and Chairman of the National Fuel Gas Company) would be matched (based on his name) with at least 14 political candidates from the FEC files, even though he never ran for political office.
Each of the 1,994,920 unique search queries is automatically input into a search engine. Modern search engines employ a variety of search algorithms that may depend on location and the history of prior searches. To ensure that we receive the full range of all possible search results, we perform each unique search on six independent servers. If a search query returns no output (we have 539 such cases), we repeat it again on the six different servers on a different day. In total, we run 11,972,754 search queries that return 29,908,149 unique search results (for each query, we retain top 20 search results, when available, and some search results may overlap because we build multiple searches for each individual in our sample).
Because modern search algorithms do not limit their search results to keywords verbatim, the 29,908,149 search results from the previous step contain many web sources that do not describe electoral campaigns. A common example is company filings that describe board elections, in which case the name of a BoardEx executive may appear in connection with his/her role as the president of the firm or his/her election to the board. Another common example are newspaper articles that describe an executive’s wealth (in which case, for example, the word “House” may be mentioned frequently). We use a two-step procedure to eliminate such extraneous search results. First, we verify that the web pages that the search results provide contain at least one mention of the BoardEx executive and at least one of his/her firms and any of the federal political offices. To do this, we obtain the http source code of each web page in the list of search results and perform a within-web keyword search, where we search for all mentions of the person’s name, firm(s) and office(s). We thus identify 47,783 web pages that contain at least one mention of the BoardEx executive and at least one of his/her firms and any of the federal political offices. In the second step, we hire human research assistants to manually read each of the 47,783 web pages and retain only those pages that contain any mention of political campaigns run by BoardEx executives. For example, research assistants exclude all articles that mention instances of executives making monetary campaign contributions to politicians (but do not mention the incidence of executives running for office themselves). This leaves us with 72 BoardEx executives who run in 167 campaigns for federal office between 1980 and 2016.
1 The phenomenon of corporate executives running for political office (who we refer to as business politicians) is not limited to the United States. Prominent international examples include Silvio Berlusconi (Italy), Yulia Tymoshenko (Ukraine), Saad El-Din Rafik Al-Hariri (Lebanon), Sebastián Piñera (Chile), and Malcolm Turnbull (Australia), among others. In this paper, we focus on U.S. federal office holders (i.e., U.S. Congressmen, Senators, and Presidents/Vice Presidents) who had been senior corporate executives prior to being elected.
2 It may be tempting to link corporate executives’ political participation with the tax benefits from the deferral of capital gains (Section 1043 of the Internal Revenue Code and Subpart J of 5 CFR part 2634). However, tax benefits are unlikely to explain the increasing trend in the number of executives running for office. First, the law granting tax deferral was enacted in 1989 as part of the Ethics Reform Act and has not changed since then. Second, the law only applies to federal employees but does not apply to legislators who constitute the vast majority of our sample.
3 Kempf and Tsoutsoura (2021) show that partisan affiliation may play an important role in how professionals in the financial sector assess future government policies.
4 A number of studies document the positive effect of political activism on firm value (Fisman 2001, Johnson and Mitton 2003, Faccio 2006, Faccio et al. 2006, Claessens et al. 2008, Ferguson and Voth 2008, Cooper et al. 2010, Chaney et al. 2011, Duchin and Sosyura 2012, Amore and Bennedsen 2013, Tahoun 2014, Akey 2015, Acemoglu et al. 2016, Brogaard et al. 2021), Brown and Huang 2020, Mehta et al. 2020). However, moral hazard problems at politically connected firms can also lead to excessive risk taking (Khwaja and Mian 2005, Kostovetsky 2015).
5 There is a time lag between an individual being elected into federal office and his or her voting record (which takes place after the election). Thus, although we have data on the biographies of politicians elected in 2018, their complete voting records are unavailable at the time of this writing.
6 An alternative to building a web crawler is to match BoardEx executives with FEC files containing the names of political candidates. However, this strategy is not viable for two reasons. First, the FEC files provide no data on prior experience or occupation of political candidates. Second, a match between BoardEx and FEC produces a large number of false positives. For example, David Smith (CEO and Chairman of the National Fuel Gas Company) would be matched with at least 14 political candidates from the FEC files, although he never ran for political office. The matches would include the following: H4CA21015 (Smith, David Kent), H6TX26011 (Smith, David Matthew), H0CA13036 (Smith, David Elliott), H0VA07018 (Smith, David M.), H4AZ06037 (Smith, David Burnell), H6WA09025 (Smith, David Adam), H2UT02233 (Smith, David R.), H4TN01060 (Smith, David Randall II), H6OH02219 (Smith, David R.), S6OH00189 (Smith, David Randall II), H0TX02072 (Smith, David Wayne), H0TX32020 (Smith, David), H2NJ09123 (Smith, E. David), H4FL07061 (Smith, David A.).
7 To compute the average cost of a congressional campaign, we calculate the average amount spent in a given election cycle across all congressional committees that file FEC Form 3 (termed the “all candidates” campaign finance files on the FEC’s website).
8 For example, Besley (2005) argues that political competence is a complex mix of skills and too few talented citizens seek political office (see also theories by Caselli and Morelli (2004) and Callander (2008)). Dal Bó et al. (2017), on the other hand, show that Swedish citizens who run for elected office are on average smarter than the population they represent.
9 A fundraising advantage, which is our focus, does not necessarily lead to an electoral advantage. It may be, for example, that business politicians need to raise more money than other candidates because voters generally dislike probusiness candidates, who therefore need to spend more to swing the electorate.
10 We analyze business politicians’ fundraising advantage in congressional elections and presidential elections separately because the average cost of a presidential campaign is almost two orders of magnitude larger than the average cost of a congressional campaign. The results reported here focus on congressional elections, whereas the results for presidential elections are reported in Online Appendix B.
11 We add candidate self-contributions and self-loans together when we compute the total amount of self-funding. Our results remain qualitatively unchanged if, instead, we only consider direct self-contributions (and exclude self-loans). Data on self-funding are available beginning with the 1984 election cycle, when the FEC started reporting the amount of donations and loans from candidates to their own campaigns.
12 Focusing on the firms whose former or current executives run for political office at least once during our sample period restricts the sample to the firms that are most likely to be similar in terms of their overall propensity to participate in politics. However, our results are also robust to including the firms that have no former or current executives running for office during our sample period (see Table B.1 in Online Appendix B).
13 This average includes all cases in which a business politician runs for office, even if he/she is not the firm’s highest supported candidate.
14 It is also possible that firm’s employees and shareholders feel loyal to their former executives or simply are more familiar with them than with other political candidates. Another alternative is that business politicians pressure their firms for financial support. However, the vast majority of business politicians in our sample are former executives who are no longer employed by the firm when they seek political office. Therefore, it seems implausible that they can exert undue influence on how their firms allocate campaign contributions.
15 CARs are based on the market model estimated over one trading year (255 trading days), with the estimation window ending two months (46 trading days) before the election date; the value-weighted CRSP index is used as the market return. We report CARs around all elections won by business politicians who had worked at a publicly traded firm. Most of these elections are not close, which likely underestimates the causal impact of business politicians on firm value—indeed, the CARs we report should reflect only the unexpected component of the market’s reaction to business politicians’ wins. Unfortunately, there is a very small number of close elections with business politicians from public firms, which makes it impossible for us to conduct an event study only around such elections.
16 Taken together with our results from the previous section, it may be tempting to conclude that business politicians generate firm-value benefits in return for campaign contributions from their firms. We caution against this interpretation, however, as firms may donate to their executives because these executives have the firm’s interests at heart and not vice versa. Therefore, our firm-value results are not inconsistent with the recent evidence in Fowler et al. (2020), who find that corporate campaign contributions do not buy significant political favors on average.
17 In unreported results, we also use propensity score matching in the spirit of Acemoglu et al. (2016). We find that firms whose executives win political office experience larger equity returns than the propensity score matched firms.
18 Not all four-digit SIC industries have 10 publicly traded firms on all election dates.
19 See “Sen. Grassley: Pharmacy ‘middlemen’ hearing should lead to a bill to end ‘secrecy’ in drug industry,” CNBC April 9, 2019. Available at https://www.cnbc.com/2019/04/09/grassley-pharmacy-middlemen-hearing-should-spur-ban-on-secrecy.html (accessed April 11, 2019). In another example, Congress held a series of hearings on the use of e-cigarettes by American youths. The hearings were held by the Subcommittee on Economic and Consumer Policy of the House Committee on Oversight and Reform. After the hearings, the Subcommittee’s Chair sent a letter to the Food and Drug Administration (FDA) requesting an investigation into JUUL Labs, Inc., the largest firm in the e-cigarette market, for making false medical claims. Three days after receiving the congressional request, the FDA issued a warning letter to JUUL and cited congressional testimony as the basis for the warning.
20 The power to appoint committee members largely resides with political parties. A panel within each party solicits preferences for committee assignments from party members and then matches these preferences with vacancies on standing committees. The parties typically honor the preferences of individual members, giving priority based on seniority. In fact, the most common justification given by legislators seeking a committee assignment is prior professional experience (Frisch and Kelly 2006).
21 We follow Ovtchinnikov and Pantaleoni (2012) in classifying the industries that fall under the jurisdiction of particular congressional committees. Because we do not have prior industry experience for nonbusiness politicians, such politicians are excluded from the analysis of committee assignments.
22 For example, Lee et al. (2004) find that voters elect (rather than affect) candidates’ policy choices, whereas Fedaseyeu et al. (2019) show that exogenous shifts in voter preferences lead to the replacement of incumbents with politicians who represent the new preferences.
23 That politicians with executive experience are less likely to vote in favor of legislation supported by labor unions is consistent with such politicians’ alignment with the interests of their firms. The economics literature generally finds that rigid labor regulation negatively affects firm performance. For example, Holmes (1998) shows that states which adopt pro-business right-to-work laws experience increases in manufacturing activity, Draca et al. (2011) find that minimum wage increases in the United Kingdom significantly reduce firm profitability, and Lee and Mas (2012) show that unionization has a negative effect on stock prices.
24 Our results are also robust to the inclusion of election cycle × party fixed effects (see Online Appendix B).
25 For example, Darell E. Issa’s holdings in Directed Electronics, Inc. during the 2006 election are available at https://www.sec.gov/Archives/edgar/data/1323630/000095015306001070/p72181def14a.htm (accessed December 5, 2019).
26 A sponsor is the first member of the House of Representatives or Senate to be listed among the possibly numerous lawmakers who introduce a bill or resolution. In Senate, multiple sponsorships are allowed. A sponsor, once designated, is responsible for the handling or processing of the bill in the legislative process.
27 We are careful to remove from consideration assistant positions, such as “Assistant CEO,” by removing role titles containing the following keywords and their variations: “assistant,” “division,” “group,” “emeritus,” “regional,” “deputy,” “acting,” “interim,” “vice,” and “designate.”
References
- (2016) The value of connections in turbulent times: Evidence from the United States. J. Financial Econom. 121(2):368–391.Crossref, Google Scholar
- (2015) Valuing changes in political networks: Evidence from campaign contributions to close congressional elections. Rev. Financial Stud. 28(11):3188–3223.Crossref, Google Scholar
- (2013) The value of local political connections in a low-corruption environment. J. Financial Econom. 110(2):387–402.Crossref, Google Scholar
- (2020) Do CEOs affect employees’ political choices? Rev. Financial Stud. 33(4):1781–1817.Crossref, Google Scholar
- (2014) Is it whom you know or what you know? An empirical assessment of the lobbying process. Amer. Econom. Rev. 104(12):3885–3920.Crossref, Google Scholar
- (2018) The cost of political connections. Rev. Finance 22(3):849–876.Crossref, Google Scholar
- (2005) Political selection. J. Econom. Perspectives 19(3):43–60.Crossref, Google Scholar
- (2020) Empirical models of lobbying. Annu. Rev. Econom. 12(1):391–413.Crossref, Google Scholar
- (2017) Professional networks, early fundraising, and electoral success. Election Law J. 16(1):153–171.Crossref, Google Scholar
- (2021) Political influence and the renegotiation of government contracts. Rev. Financial Stud. 34(6):3095–3137.Crossref, Google Scholar
- (2020) All the president’s friends: Political access and firm value. J. Financial Econom. 138(2):415–431.Crossref, Google Scholar
- (2009) Big business owners in politics. Rev. Financial Stud. 22(6):2133–2168.Crossref, Google Scholar
- (2008) Political motivations. Rev. Econom. Stud. 75(3):671–697.Crossref, Google Scholar
- (2011) The quality of accounting information in politically connected firms. J. Accounting Econom. 51(1–2):58–76.Crossref, Google Scholar
- (2004) Bad politicians. J. Public Econom. 88(3–4):759–782.Crossref, Google Scholar
- (2008) Political connections and preferential access to finance: The role of campaign contributions. J. Financial Econom. 88(3):554–580.Crossref, Google Scholar
- (2013) Legislating stock prices. J. Financial Econom. 110(3):574–595.Crossref, Google Scholar
- (2010) Corporate political contributions and stock returns. J. Finance 65(2):687–724.Crossref, Google Scholar
- (2017) Who becomes a politician? Quart. J. Econom. 132(4):1877–1914.Crossref, Google Scholar
- (2011) Minimum wages and firm profitability. Amer. Econom. J. Appl. Econom. 3(1):129–151.Crossref, Google Scholar
- (2012) The politics of government investment. J. Financial Econom. 106(1):24–48.Crossref, Google Scholar
- (2017)
Executive compensation: A survey of theory and evidence . Hermalin BE, Weisbach MS, eds. The Handbook of the Economics of Corporate Governance (North Holland, Amsterdam), 383–539.Google Scholar - (2006) Politically connected firms. Amer. Econom. Rev. 96(1):369–386.Crossref, Google Scholar
- (2006) Political connections and corporate bailouts. J. Finance 61(6):2597–2635.Crossref, Google Scholar
- 2019, Technology, economic booms, and politics: Evidence from fracking. Working paper, Boston College, Boston.Google Scholar
- (2008) Betting on Hitler: The value of political connections in Nazi Germany. Quart. J. Econom. 123(1):101–137.Crossref, Google Scholar
- (2001) Estimating the value of political connections. Amer. Econom. Rev. 91(4):1095–1102.Crossref, Google Scholar
- (2020) Quid pro quo? Corporate returns to campaign contributions. J. Politics 82(3):844–858.Crossref, Google Scholar
- (2006) Committee Assignment Politics in the US House of Representatives (University of Oklahoma Press, Norman, OK).Google Scholar
- (2010) Business candidates. Amer. J. Political Sci. 54(3):718–736.Crossref, Google Scholar
- (1998) The effect of state policies on the location of manufacturing: Evidence from state borders. J. Political Econom. 106(4):667–705.Crossref, Google Scholar
- (2003) Cronyism and capital controls: Evidence from Malaysia. J. Financial Econom. 67(2):351–382.Crossref, Google Scholar
- (2016) Policy influence and private returns from lobbying in the energy sector. Rev. Econom. Stud. 83(1):269–305.Crossref, Google Scholar
- (2021) Partisan professionals: Evidence from credit rating analysts. J. Finance 76(6):2805–2856.Crossref, Google Scholar
- (2005) Do lenders favor politically connected firms? Rent provision in an emerging financial market. Quart. J. Econom. 120(4):1371–1411.Crossref, Google Scholar
- (2015) Political capital and moral hazard. J. Financial Econom. 116(1):144–159.Crossref, Google Scholar
- (2012) Long-run impacts of unions on firms: New evidence from financial markets, 1961–1999. Quart. J. Econom. 127(1):333–378.Crossref, Google Scholar
- (2004) Do voters affect or elect policies? Evidence from the U. S. House. Quart. J. Econom. 119(3):807–859.Crossref, Google Scholar
- (2019) Voteview: Congressional roll-call votes database. Accessed December 5, 2019, https://voteview.com/.Google Scholar
- (2021) When do legislators follow constituent opinion? Evidence from matched roll call and referendum votes. Working paper, University of Southern California, Los Angeles.Google Scholar
- (2020) The politics of M&A antitrust. J. Accounting Res. 58(1):5–53.Crossref, Google Scholar
- (2019) Lobbying externalities and competition. Working paper, University of Southern California, Los Angeles.Google Scholar
- (2012) Individual political contributions and firm performance. J. Financial Econom. 105(2):367–392.Crossref, Google Scholar
- (1991) Patterns of congressional voting. Amer. J. Political Sci. 35(1):228–278.Crossref, Google Scholar
- (2006) Committee Assignment Process in the U.S. Senate: Democratic and Republican Party Procedures. Congressional Research Service Report 7-5700, University of Washington, Seattle.Google Scholar
- (1987) The institutional foundations of committee power. Amer. Political Sci. Rev. 81(1):85–104.Crossref, Google Scholar
- (2004) Politicians and firms. Quart. J. Econom. 109(4):999–1025.Google Scholar
- (1992) Are contributors rational? Untangling strategies of political action committees. J. Political Econom. 100(3):647–664.Crossref, Google Scholar
- (2014) The role of stock ownership by U.S. members of Congress on the market for political favors. J. Financial Econom. 111(1):86–110.Crossref, Google Scholar

