
Political Heterogeneity and Societal Polarization Impair Individual Performance: Evidence from Random Assignment in Professional Golf
Abstract
We examine how political heterogeneity in groups affects individual performance in settings where people work alongside others. Leveraging the random assignment of golfers to groups in Professional Golfers’ Association Tour tournaments, we find that golfers score 0.2 strokes better per round when playing in politically homogeneous versus heterogeneous groups. This corresponds to a five-rank improvement before the tournament cut and an additional $13,000–$23,400 in tournament earnings. The effect intensifies during periods of high societal political polarization and diminishes when polarization is low. We propose that politically heterogeneous groups create a more stressful and less psychologically safe environment, reducing focus and leading to reduced performance. Consistent with this mechanism, analyses of shot-level data reveal that this effect is strongest during driving and putting shots when players are in close physical proximity. Our study contributes to the understanding of how political heterogeneity in groups affects individual performance in competitive settings, with implications for managing ideological differences in organizations.
This paper was accepted by Sameer Srivastava, organizations.
Funding: The authors appreciate financial help from Yale University and Fox International [fellowship].
Supplemental Material: The online appendix is available at https://doi.org/10.1287/mnsc.2023.01798.
Introduction
Political polarization in the United States has steadily increased since World War II, raising a critical question. How does working in politically heterogeneous groups affect performance? This increased polarization is evident not only in the analysis of daily newspapers (Azzimonti 2018) and voting behavior in the Senate and the House (Voteview 2023) but also in the perceived sentiment of citizens (American National Election Studies 2023). Although people commonly discuss their ideological and political attitudes in various settings (Mutz and Mondak 2006) and political views influence social interaction (Swigart et al. 2020), the impact of political heterogeneity on individual performance remains understudied. Research on affective polarization shows that such differences increasingly spark negative emotions toward ideological out-groups (Iyengar et al. 2012), which can influence interactions, even in nonpolitical tasks.
Building on extensive research examining how different forms of diversity affect organizational outcomes (Williams and O’Reilly 1998, van Knippenberg et al. 2004, Ertug et al. 2022), research investigating how political heterogeneity affects team performance has produced mixed findings. Some studies find negative effects on firm performance when the board of directors (Olthuis and van den Oever 2020, Rockey and Zakir 2020), the top management (Narayan et al. 2021), or the workforce is politically heterogeneous (Anantharaman and Grandey 2021). Conversely, other studies find positive effects when the board of directors or top management is politically heterogeneous (Kim et al. 2013, Lee et al. 2014, Kang et al. 2021). Shi et al. (2019) found that politically heterogeneous teams of Wikipedia authors produced more effective articles. However, these studies examine settings where people actively collaborate toward shared goals, leaving open the question of how political differences affect individual performance in settings where collaboration is absent but where individuals still share physical space and are aware of the presence of others. Moreover, as the groups studied are self-selected, there is a potential endogeneity issue, limiting causal understanding.
Understanding how political differences affect individual performance enhances our knowledge in two key ways. First, by studying settings where outcomes are individual rather than collective, we show that political differences can impair performance, even in the absence of coordination challenges and communication barriers typically studied in team settings. Second, by examining randomly assigned rather than self-selected groups, we can determine whether political differences have a causal effect on performance. These effects could extend beyond collaborative decision making, influencing performance through mere presence—the simple awareness of politically different others in shared spaces, even without direct interaction (Zajonc 1965, Bond 1982). For example, political differences could impact performance in workplace settings, such as open offices or client interactions, where employees work alongside politically diverse colleagues. This issue becomes increasingly significant as political polarization intensifies and shapes social interactions across various contexts. Theories from social psychology and organizational behavior suggest that mere presence effects may operate through psychological mechanisms related to social identity (Tajfel and Turner 1979) and interpersonal attraction (Byrne 1971), affecting individual performance, even in the absence of explicit collaboration.
We analyze the effect of political heterogeneity on individual performance by studying professional golfers who are randomly assigned to groups on the Professional Golfers’ Association (PGA) Tour. Drawing on social identity theory (Tajfel and Turner 1979, Hogg and Terry 2000) and research on comfort and anxiety in performance situations (Baumeister and Showers 1986, Eysenck et al. 2007), we propose that individuals feel more comfortable and less anxious in politically homogenous groups, leading to improved performance. We find that golfers score 0.2 strokes better per round when playing in politically homogeneous versus heterogeneous groups. This effect can increase to 0.55 strokes per round during periods of high political polarization but disappears during periods of low political polarization. Analyses of shot-by-shot data reveal that the performance difference is most pronounced during driving and putting shots—when players are physically closest—providing insight into how proximity moderates the effect of political heterogeneity. Although the absolute effect on strokes may appear small, a 0.2-stroke decline on the PGA Tour equates to a five-rank drop before the tournament cut, resulting in approximately $13,000–$23,400 less in tournament earnings.
Our findings advance organizational theory by revealing three key insights into the role of political differences in the workplace. First, they demonstrate that the behavioral impact of political heterogeneity extends beyond active collaboration, shaping performance through mere proximity. This suggests that political differences permeate organizational life more deeply than previously recognized. Second, identifying physical proximity as a key moderator helps explain the mixed findings in the literature regarding when political differences enhance or hinder performance. Third, by showing how these effects vary with societal polarization, we reveal that organizational boundaries are more permeable to broader social dynamics than existing theories suggest. Together, these insights shift the understanding of political differences from being primarily relevant in collaborative or politically charged settings to a broader social force that shapes behavior even in seemingly neutral organizational contexts.
The study proceeds as follows. First, we present the theoretical background and relevant literature. Next, we describe the setting, data, and variables. We then provide evidence of randomization in group assignments and outline our empirical model. Our main results demonstrate the causal effect of political heterogeneity on performance, including how this effect varies with societal polarization levels. We explore the underlying mechanism through analysis of shot-level data and proximity effects. We conduct extensive robustness checks, including tests for selection effects and alternative specifications. Finally, we discuss the study’s implications and limitations.
Theory and Literature Review
We propose that political heterogeneity influences individual performance in settings where individuals work alongside others. Drawing on social identity theory (Tajfel and Turner 1979) and the similarity-attraction paradigm (Byrne 1971), we argue that this effect operates through psychological mechanisms shaped by group dynamics. Political affiliation often signals shared values and beliefs, fostering in-groups and out-groups that influence psychological security and interpersonal interactions (Billig and Tajfel 1973; Turner et al. 1987; Brewer 1999, 2007). This psychological security derived from alignment with in-group members enhances feelings of safety and comfort (Green et al. 2002). These psychological responses can be triggered even in the absence of explicit interaction, aligning with research on mere presence effects (Zajonc 1965, Bond 1982). Mere presence theory suggests that simply being aware of an out-group member can heighten stress and impair performance, particularly in high-pressure or evaluative environments.
Although extensive research has examined how demographic heterogeneity, such as differences in age, gender, race, or nationality, affects performance (Williams and O’Reilly 1998, van Knippenberg et al. 2004, van Knippenberg and Schippers 2007, Ertug et al. 2022), the effects of political heterogeneity remain underexplored. By focusing on political affiliation as a marker of identity, our study builds on this literature, offering insights into how political heterogeneity impacts individual performance through these psychological pathways.
Research demonstrates systematic effects of political alignment across multiple domains. Individuals are more likely to favor those who share their political affiliation in personal interactions, consumer decisions, or employment contexts (Iyengar et al. 2012, Westfall et al. 2015, Zimmerman et al. 2022, Puryear et al. 2024). For example, Huber and Malhotra (2017) found that partisan alignment increased the likelihood of exchanging messages on a dating platform by 9.5%, whereas McConnell et al. (2018) showed that buyers were willing to pay nearly double for a discounted gift card when the seller shared their political affiliation. In an audit study, Gift and Gift (2015) sent resumes indicating political affiliations to employers in predominantly Democratic and Republican regions. Their findings suggested that Democratic applicants were 2.4 percentage points more likely to receive a callback in Democratic counties, whereas Republican applicants saw a 5.6-percentage-point advantage in Republican counties.
Beyond showing preferential treatment for political in-groups, research in social psychology demonstrates that merely categorizing people into groups can trigger negative affect toward out-groups (Tajfel and Turner 1979). In the political domain, Iyengar et al. (2012) find that partisan animosity stems more from basic group identity processes than from ideological disagreement, with partisans increasingly viewing each other with hostility, even without direct interaction. These findings suggest that simply being aware of political differences can create psychological tension. Social identity theorists posit that such responses intensify when group identities become more salient (Oakes 1987) as occurs during periods of heightened societal polarization.
In groups and organizations, this discomfort induced by heterogeneity often leads to conflict (Mannix 2003, Greer and Dannals 2017, Kimbrough and Sheremeta 2019). Unlike distribution or interest conflicts, which can often be settled through compromise, value-based conflicts—those involving moral, religious, cultural, or political beliefs—are more difficult to resolve (Aubert 1963). These value conflicts are characterized by individuals expressing and attempting to persuade others of their values, often escalating into interpersonal conflicts that impact even those not directly involved in the original disagreement (Chua 2013, Park et al. 2020).
In workplace settings, diverging cultural or value-based views not only lead to interpersonal tensions (Brief et al. 2005; Esteban et al. 2012a, b; Bazzi et al. 2019; Arbatli et al. 2020) but also result in various negative organizational and individual consequences, such as decreased productivity (Kahane et al. 2013, Hjort 2014, Leslie 2017, Lyons 2017), reduced creativity (Chua 2013, Corritore et al. 2020), declining engagement (King et al. 2011, Han et al. 2020, Spenkuch et al. 2023), higher turnover (Han et al. 2020), sabotage (Hjort 2014), and increased communication costs (Mohammed and Angell 2004, Lyons 2017). Although prior research highlights psychological stress and anxiety as a key mechanism (Kammeyer-Mueller et al. 2012, Stosny 2017, Iyengar et al. 2019), the role of political differences in shaping individual performance outcomes remains less understood.
These psychological effects not only disrupt group cohesion but also have downstream consequences for individual performance. Research consistently shows that anxiety impairs cognitive and motor performance, particularly in high-pressure settings, such as competitive sports, high-stakes examinations, and workplace performance evaluations (Eysenck et al. 2007, Derakshan and Eysenck 2009). In contrast, individuals in comfortable environments are more likely to enter “flow” states, where they can perform at their best (Baumeister and Showers 1986, Csikszentmihalyi 1990, Baumeister and Leary 1995). This relationship between interpersonal comfort and performance has been documented across various workplace settings. For instance, Bandiera et al. (2009) found that fruit pickers’ productivity increases when they work alongside amicable coworkers. Such comfort enables them to focus more effectively on the task at hand, leading to improved performance. Applied to our context, we argue that golfers perform better when playing in politically homogenous groups as such groupings reduce anxiety and create psychological safety. This argument builds on prior research showing that anxiety negatively affects professional golfers’ performance (Cook et al. 1983, Hellström 2009) and is further supported by an interview that we conducted (via Zoom; May 16, 2024) with a former PGA Tour golfer.
Research on political heterogeneity has primarily examined team performance, yielding mixed results, but it faces two key limitations. First, much of this work examines team settings where shared goals and task interdependence may complicate the analysis of the effects of heterogeneity. Second, these studies often rely on observational data rather than randomized designs, which makes it difficult to establish causality. For instance, some studies find negative effects of political heterogeneity on firm performance through board composition (Olthuis and van den Oever 2020) or workforce diversity (Anantharaman and Grandey 2021), whereas others document positive effects through enhanced decision making in top management teams (Kim et al. 2013, Lee et al. 2014). These mixed findings likely stem from complex team dynamics, where collaboration and interdependence shape diversity effects. Our study examines a related but different question. How do political differences affect individual performance when people work in proximity but not as a team? Using a randomized design in professional golf, we isolate the impact of mere exposure to politically different others on performance, separate from teamwork and collaboration dynamics.
Only one unpublished study uses randomization to examine the effect of political heterogeneity on individual performance. Rouse et al. (2019) conducted a small experiment to explore how political polarization impacts individual performance. They asked 78 incoming policy graduate students to write an essay on climate policy and then, randomly divided them into groups, resulting in politically homogeneous and politically heterogeneous groups. Within each group, students discussed their essays, after which they were required to rewrite the essays from scratch. Students in politically heterogeneous groups produced significantly lower-quality essays compared with their initial submissions and experienced substantially higher psychological stress and interpersonal conflict than those in politically homogeneous groups. These findings and the above arguments lead to our first hypothesis.
Individual performance is higher in politically homogeneous groups relative to heterogeneous groups.
We further propose that the broader political environment moderates the effect of political similarity on performance. During times of high polarization, individuals become more sensitive to differences in political identity or the presence of political out-groups, experiencing more pronounced psychological discomfort, anxiety, and stress when working in politically heterogeneous groups (Stosny 2017, Azzimonti 2018, McConnell et al. 2018). Psychologists have coined the term “election stress disorder” to describe the increased anxiety and stress that people feel regarding political divisions during highly polarized periods, such as national elections (Gallagher 2020). As Gallagher (2020) explained, during highly polarized periods, “You can even feel anxious about being around certain people who you know have different political views,” illustrating how political polarization can undermine interpersonal comfort. Conversely, during periods of lower polarization, these effects may be muted as political stakes and tensions are reduced.
Prior research has explored the society-level consequences of increased polarization. Azzimonti (2018) demonstrated that rising political polarization in the United States is associated with a decrease in private investments. Hjort (2014) examined the escalation of ethnic conflict following the 2007 elections in Kenya, which led to heightened intercommunity tensions, displacement, and poverty. Shayo and Zussman (2017) found that an increase in conflicts between 2000 and 2004 intensified coethnic bias among Israeli Arab and Jewish judges.
The anxiety arising from political differences appears to be moderated by the broader political climate. During periods of heightened societal polarization, the psychological discomfort of working alongside politically different others intensifies, leading to greater anxiety and reduced attentional control (Schmader and Johns 2003, Eysenck et al. 2007). Evidence for this moderating effect comes from Evans et al. (2025), who studied the same asset management teams over time and found that in highly polarized political climates, ideologically heterogeneous teams perform worse because of increased intrateam conflict. However, during periods of lower societal polarization, these teams outperformed ideologically homogeneous teams. Although the findings of Evans et al. (2025) concern team-level outcomes that may benefit from viewpoint diversity under normal conditions, our focus on individual performance in noncollaborative settings leads us to expect that reduced anxiety during periods of low polarization will merely diminish—rather than reverse—the negative effects of political heterogeneity. This is because individual performance may not benefit from political diversity in the same way that team decision making might. Unlike collaborative tasks, where differing perspectives can enrich discussions, individual performance is more directly shaped by psychological comfort and focus, meaning that lower polarization reduces harm but does not create a performance advantage.
These arguments lead to our second hypothesis.
The performance gap between individuals in politically homogeneous and heterogeneous groups will widen during periods of high political polarization.
Our theory applies best when four conditions are met. (1) Political ideology is a relevant social factor in the setting. (2) Individuals are aware of each other’s political identity. (3) The presence of others is salient during performance. (4) Performance is individually measured and rewarded.
Setting
The PGA Tour is the leading professional golf organization worldwide. Every year, the PGA Tour organizes about 47 tournaments, typically one every week. In each tournament, players aim to complete the 18-hole golf course with the fewest number of strokes. Each tournament consists of four rounds, with total strokes across these rounds determining final rankings and prize allocations. The player who accumulates the fewest strokes over the four rounds wins the tournament.
The PGA Tour provides an ideal context for testing our theory of political heterogeneity’s effect on individual performance as it meets all four scope conditions outlined in our theoretical framework. First, political ideology is a salient social factor among PGA Tour players. Political polarization is widespread within the tour, leading to conflict and shaping social dynamics. For example, a notable incident from 1993 occurred when members of the U.S. team refused an invitation from President Clinton, citing their disagreement with his proposed tax increases and healthcare reform (Feinstein 1995). Second, golfers are generally aware of each other’s political views. The professional golf community is relatively small, with approximately 200–300 regular players on tour each year. Players interact frequently at tournaments, practice rounds, and social events, developing extensive knowledge of their peers’ political views through direct interaction and community networks. Third, players compete in close physical proximity, ensuring the salience of other players during performance. Players in the same group complete the entire course together, with particularly close interaction during driving and putting shots. This physical proximity makes players acutely aware of their group mates throughout the round, even without direct conversation. Fourth, golf provides clear individual performance metrics and rewards. Each player’s score is measured independently, and tournament rankings and prize money are awarded based solely on individual achievement, regardless of group composition. This individual-level measurement allows us to isolate the effect of political heterogeneity on personal performance without confounding group-level outcomes.
A typical PGA Tour tournament field consists of 132–156 players who compete in groups of two or three. By default, the groups consist of three players (three-player groups represent 94% of the groups in our sample) in the first two rounds. In unusual cases, such as when the total number of qualified players for the tournament is not divisible by three or if a player withdraws after the groups are allocated, some players may end up in a group of two (two-player groups make up 6% of all groups in our sample).1 We have excluded the rare cases when a golfer plays alone. We also excluded entire groups for the rounds where a golfer withdraws or is disqualified.2 Although golf is considered a social sport and groups of three (or two) players finish the 18-hole course together, only the individual performance of each player counts. That is, all golfers who qualified for the tournament compete against each other, regardless of whether they play a round together or not.
After the first two rounds of play, a cut is made to reduce the number of players who continue into the final two rounds. The top 65 players (70 before 2019/2020), including ties, make the cut based on their performance in the first two rounds.
At the beginning of a tournament, groups are assigned randomly by a computer program—as our interviewee Tom Alter, Vice President of the PGA Tour, mentioned to us in a personal interview (January 11, 2023): “The computer spits out the groups.” The randomized groups stay together for the first two rounds of the tournament. For rounds 3 and 4, players are regrouped based on their cumulative tournament scores. Because later groupings are based on performance rather than random assignment, we focus only on the first two rounds to test the causal effect of political group composition. The groups are randomized with two constraints. (1) To create variance in viewers’ experiences, players cannot be matched with other players that they were randomly matched with in the previous tournament. (2) Players are divided into four tiers based on the golfer’s past performance, and the randomization happens within each tier to avoid matching players with different skill levels. Although PGA Tour organizers do not publicly share the tier assignments, we use the Official World Golf Ranking (OWGR) Score as a proxy for player quality to control for this aspect of group selection (Official World Golf Ranking 2024). Groups are assigned randomly in almost all PGA Tour tournaments, with a few exceptions (Guryan et al. 2009a, Hickman and Metz 2018). On rare occasions, especially in the “Major” tournaments, organizers may intervene in the randomized groupings and may reshuffle a few groups to create interesting groups for television broadcast. Our interviews with tournament organizers confirm that reshuffling rarely affects the computer-assigned groups. Importantly, we conducted a formal statistical test to demonstrate that groups are truly randomized in terms of political attitudes (as detailed later).
Each golf course on the PGA Tour has 18 holes. Each hole has a par value indicating the expected number of strokes for a skilled golfer to complete it. About 20% of the holes are par 3, indicating that a skilled golfer is expected to take three strokes to get the ball into the hole, whereas about 60% are par 4 holes, and about 20% are par 5 holes. As illustrated in Figure 1, each hole generally requires four different types of shots: (1) driving (or off the tee), (2) approach to the green, (3) around the green, and (4) putting. On a par 3 hole, the off-the-tee shot falls into the approach to the green category. Figure 1 shows that although golfers start next to each other with their driving shots, there can be significant variation in where they take their approach and around the green shots, with obstacles, such as sand bunkers, water, hills, or trees, potentially obscuring players’ views of each other. Once on the green, players are positioned close to one another, with the golfer farthest from the hole playing first. This variance in player proximity across stages allows us to test the mere presence mechanisms; we will show that the performance difference between politically heterogeneous and homogeneous groups occurs primarily during stages where players are physically close.
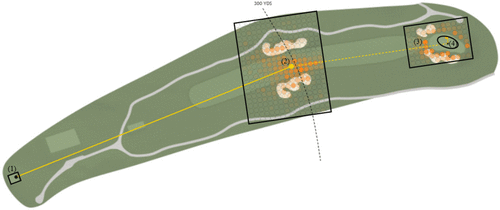
Notes. The figure displays a typical par 4 hole (466 yards) and the four different types of shots: (1) driving, (2) approach to the green, (3) around the green, and (4) putting. The areas indicate where golfers are positioned while taking each shot, illustrating the variance in distance between them. The small dots represent a heat map of shot counts for the approach to the green and around the green shots (DataGolf 2024).
Data and Variables
Data Sources
We analyzed PGA Tour data from 1997 to 2022,3 including Pro-Ams, World Golf Championships (WGCs), Invitationals, Majors, Flagships, and Limited events while excluding team events, Stableford tournaments, the FedEx Cup, and Match Plays.4
Our primary data source was the PGA Tour website. However, at the time of our data collection in 2022, the website’s data were incomplete (particularly for older years), so we needed to gather additional variables, such as tee times for groupings and specific player/tournament data. To fill these gaps and ensure completeness, we consulted additional data sources as detailed below.
Regarding player groupings, the PGA Tour website only contained data for the most recent three years at the time of collection. We supplemented this with historical data from various providers, including Golf Post, SB Nation, The Golf News Net, USA Today, Golf.com, CBS Sports, and Golf Digest, each contributing information about tee times and group compositions for different events. We also incorporated publicly shared data from Guryan et al. (2009a, b), which include grouping information for PGA tournaments from 2002, 2005, and 2006.
Although the PGA Tour website contains most historical data on performance scores (i.e., strokes per round), we supplemented missing values with data from NBC Sports (Golf Channel). Because the PGA Tour website lacks detailed, stage-by-stage tournament performance data, we purchased access to DataGolf, a website providing more comprehensive performance metrics. Although the DataGolf database offers valuable detailed metrics, its coverage only began in 2005 (with limited data for 2004), and data are not available for every tournament. These coverage limitations influenced our analysis strategy; we conduct our main analyses using the general Performance measure (strokes relative to par) available from the PGA Tour website while using the DataGolf data for mechanism tests on the smaller sample where detailed performance data are available.
Tournament characteristics, such as golf course location, event formats, prize distributions, and par data, primarily came from the PGA Tour website. When this information was missing, we supplemented it with data from ESPN and Wikipedia.
To measure political polarization, we use the Partisan Conflict Index, which tracks the degree of political disagreement among U.S. politicians at the federal level by analyzing search terms in major U.S. daily newspapers. The index is available from the Federal Reserve Bank’s website (Federal Reserve Bank of Philadelphia 2023).
For player characteristics, such as age, birth date, race, and nationality, we started with data from the PGA Tour website and Wikipedia. When these data were unavailable, we conducted Google searches to find the missing information where possible. To measure the objective ability of a golfer, we obtained the OWGR Score and ranking from the Official World Golf Ranking website.
To determine golfers’ political views, we looked at each player’s Wikipedia page and Twitter (X) profile when available. We also manually collected donation data from the Federal Election Commission and OpenSecrets. Additionally, we conducted targeted Google searches and reviewed interviews and media coverage where players might have expressed their political opinions. In a later stage of data collection (after gaining access to the voter registration database from L2), we also looked up the voter registration of the 500 players5 who participated in the most tournaments in our database and augmented the player’s political view information with these data (if available). In rare cases where different sources indicated conflicting political affiliations (e.g., the golfer was registered as a Democrat but donated to the Republican party or predominantly followed Republican politicians on Twitter), we classified the political view as unknown. We also used L2 to collect additional information on the player’s education, religiosity, and hobbies where available.
All data sources were matched using golfers’ names (or dates/tournaments when relevant). We first performed exact name matches, and when these failed (for example, because sources differ in their use of middle names or accented characters), we manually matched the records.
Dependent Variable: Player Performance
Our primary dependent variable is the Performance of the golfer. Each golfer plays on an 18-hole course. To make Performance comparable across golf courses, each course has a target score for a round of 18 holes known as par. Par is the number of strokes that it typically takes a “scratch” golfer with a zero handicap to complete a round of the golf course as determined by the golf course architects, governing bodies, or tournament organizers. Par is, therefore, consistent for every player in the tournament. The Performance is measured as the difference between the actual strokes and the par for the 18-hole course.6 For instance, if a player needed 72 strokes to complete the first round and if the average expected score for the course is also 72 strokes, the player has a Performance score of zero. Conversely, a player who needed only 70 strokes would have a Performance score of −2. Thus, a lower Performance score indicates better play, and the player with the lowest score demonstrates the best performance. On average, golfers achieve a Performance score of zero, meaning that they meet the course’s target. Figure A1 in the Online Appendix shows the distribution of the Performance scores. Figure A2 in the Online Appendix illustrates the average Performance gap between the first and second positions, between the second and third positions, and so on up to the 99th and 100th ranks at the end of round 1. On average, a golfer who uses 0.11 fewer strokes per round can improve by two positions (one position in each round) before the cut.
To measure performance precisely across shot stages, the golf community developed a “strokes gained” (SG) metric in the early 2000s. For each shot, SG measures how many strokes better or worse a player performs compared with the PGA Tour average from similar situations (e.g., similar distance, lie conditions). These shot-level measurements sum to Total SG for the round. Although our primary Performance score measures strokes relative to par per round (where higher values indicate poorer performance), a higher Total SG indicates better performance. Although the absolute values of the Performance score and Total SG differ, they correlate strongly (r = −0.88).
To gain further insights into our mechanism, we take advantage of this detailed performance assessment of various types of golf shots. Specifically, to analyze performance across these different stages of play, we acquired data from DataGolf, a provider that offers breakdowns of Total SG into SG measures for each stage: Driving (“off the tee”), Approach to the Green, Around the Green, and Putting. Driving is further subdivided into Distance (yards) and Accuracy (percentage of fairways hit). Analyzing data from these stages is particularly valuable because the physical proximity between players varies, allowing us to address heterogeneous treatment effects. Typically, players are closer together during the “Driving” and “Putting” stages, whereas they are farther apart in the “Off the Green” stage depending on prior shots. The detailed performance metrics also allow us to identify Great Rounds and Poor Rounds (overall and for each stage), with a Great Rounds performance defined (by DataGolf) as the top 5% of SG values within each category and within a tournament round and a Poor Rounds performance defined as the bottom 5% in each category for every tournament round. Additionally, DataGolf offers Moving SG Averages for the last 10 rounds played (overall, for each stage, and for Great Rounds and Poor Rounds).
Primary Independent Variable: Heterogeneity of Political Ideology
As described above, we collected data on golfers’ political attitudes using public donation registries (Federal Election Commission and OpenSecrets), articles, public interviews, Twitter, and political registration data provided by L2. We use L2 data only for golfers who voted in states that register voters by party. For the Twitter data, we assigned a political attitude only to those golfers who exclusively follow politicians of one party or if at least 70% of the followed politicians belong to one party.
Politically Heterogeneous Group is a dummy variable that indicates whether a group of golfers contains players from different political parties. Groups were coded as politically homogeneous when all players supported the same party (e.g., three Republican golfers) and as heterogeneous when at least two golfers supported different parties (e.g., one Democrat and one Republican or two Republicans and one Democrat). We excluded three-player groups where two players shared the same political affiliation but the third player’s affiliation was unknown as these groups could not be definitively categorized as either politically homogenous or heterogeneous. Similarly, we excluded groups where the political affiliation of only one or none of the players was known.
Primary Moderator: Political Polarization over Time
To measure political polarization, we use the Partisan Conflict Index (Azzimonti 2018), which tracks the monthly degree of political disagreement among U.S. politicians at the federal level. The index measures political disagreement by tracking the frequency of newspaper articles containing terms related to political disagreement and conflict between political parties (such as “gridlock,” “filibuster,” and “partisan fight”) in major U.S. daily newspapers. As shown in Figure A3 in the Online Appendix, the Partisan Conflict Index was particularly high during the 2013 government shutdown and following the Trump–Clinton election in early 2017. To simplify interpretation of the results, we standardized the Partisan Conflict Index.7
Additional Control Variables
We collected a large set of variables to serve as controls and to investigate the effect of heterogeneity in groups. As detailed below, some of these variables are at the player level, some of these variables are at the tournament level, and some of these variables are at the player-group level (calculated from the player-level variables). We note that because all our models include fixed effects for players and tournaments, our regressions primarily include time-varying individual and group variables. The other variables described below are used in sensitivity checks and heterogeneity analyses.
The first set of variables includes player-level data on Race, Nationality, Language, and Age. To determine Age, we gathered players’ birth dates and calculated their Age in years on the first day of the tournament. We derived the Language from the player’s Nationality, choosing the official language of the respective country. We then created dummy variables for Nationality and Language. Nationality was categorized as either United States (about 66%) and non-United States, whereas Language was divided into English (about 85%) and non-English. Regarding Race, we collected headshots of the golfers using the official images from the PGA and analyzed these images using the “Kairos Face Recognition” program, which employs artificial intelligence-based technology to provide a probability distribution indicating whether a person is White, Black, Hispanic, or Asian. Similar to the other control variables, we classified players as either White (about 89%) or non-White. Although women are allowed to compete in PGA Tours, it is practically a male tournament.8 Of the 711 PGA tournaments in our sample, there are only two instances where a female golfer enrolled and qualified. In 2006, Michelle Wie West competed in the 84 LUMBER Classic, and in 2018, Brittany Lincicome competed in the Barbasol Championship. Because 99.95% of the groups in our sample contain solely male players, we do not control for a group’s gender composition in the analyses that we report.
We coded Nationality Heterogeneous Group as one for groups containing both U.S.-born and non-U.S.-born golfers and zero for groups composed entirely of either U.S.-born or non-U.S.-born golfers as nationality differences may influence cultural familiarity or comfort during play.9 Language Heterogeneous Group is coded as one for groups with non-English-speaking countries of origin, recognizing that language barriers might affect communication or group dynamics. Age Heterogeneity is measured using the standard deviation of Age in years at the group level given that generational differences can shape interaction styles and performance. Racially Heterogeneous Group is coded as one if the group is not exclusively composed of White golfers and zero otherwise to account for potential effects of racial diversity on group dynamics.
For players who we could match with L2, we obtained additional golfer-level data, including information on religion, education, and other personal attributes, such as pet ownership, gun ownership, and various personal interests like fishing or sailing. L2 collects these data based on credit card usage. For example, gun ownership is identified through subscriptions to gun magazines, purchasing firearms or ammunition, or making payments at a gun range. However, these data were incomplete for most golfers because of limited L2 matching and sparse credit card records. Therefore, we only use these variables in robustness checks.
To account for familiarity among golfers, we measured the Total Times Played with Others in Group by counting previous group pairings.
In addition, we use an objective ability measure—OWGR Score—to control for the time-varying “quality” of the golfers (Broadie and Rendleman 2013). The OWGR Score has been compiled weekly since 1987. The highest ever OWGR Score in our data set was achieved by Tiger Woods in March 2008 (21.751). Before 2008, the OWGR Scores were published for the top 200 players, and since then, they have been published for the top 300 players. Figure A4 in the Online Appendix shows the distribution of the Raw OWGR Scores in our sample. To represent players not included in the ranking, we have assigned them a score of zero (OWGR Score). Additionally, DataGolf offers a weekly objective performance measure called the DG Index, which is similar to the OWGR Score. Although the OWGR Score has its own units, the DG Index represents a golfer’s expected next performance in units of strokes gained relative to the average PGA Tour golfer accounting for the last 150 rounds, with greater weight on recent performance.
To control for potential peer effects for the overall quality of golfers (Avg. Peer Ability), we calculated the average OWGR Score of the other players in the group. To measure peer effects on actual performance on the day of a tournament round, we calculated the average Performance score of the other players in the group (Avg. Peer Performance).
The Round variable indicates whether the game took place in round 1 or round 2. It is a binary variable, where zero represents round 1 and one represents round 2.
Tournament-level variables (specific tournament-year pairs; e.g., the 2015 Player’s Championship) include course location, prize money, and the political leaning of the tournament state (tournament fixed effects also allow us to control for other statewide influences, such as the local political climate or economic conditions). Political leaning of the tournament state is coded as one if the state voted Republican in the election prior to the focal tournament and zero otherwise.
Sample Construction Limitations and Missing Data
Originally, we collected data for 713 PGA Tour tournaments between 1997 and 2022, comprising 175,070 player-tournament-rounds from 2,601 unique players.10 However, not all player-tournament-rounds from these 713 PGA Tour tournaments were included in our final analysis sample. The primary reason for the loss of many observations is our inability to unambiguously code the political affiliation of numerous players. This occurs either because the players are not registered as Democrats or Republicans or because we could not find reliable information through public sources, such as interviews, Twitter statements, articles, or donation records, to clearly determine their political affiliation. Additionally, some players are non-U.S. citizens. Overall, we identified 519 players (20%) as either Republican or Democrat. Although this represents a modest proportion of the total players,11 these identified players account for 66,115 (38%) of the 175,070 player-tournament-rounds.
Because Politically Heterogeneous Group is measured at the group level, our final analysis included only rounds where the group’s political composition could be clearly determined. Specifically, for groups of three golfers, we included configurations such as DDD, RRR, RDD, RRD, and RDX (X stands for “unknown”). For groups of two golfers, we included DD, RR, and RD. Groups such as DDX, RRX, DXX, RXX, XXX, DX, RX, and XX were excluded. As a result, our database includes 711 tournaments, encompassing 8,718 groups (4,425 in round 1 and 4,293 in round 2) and 25,332 player-tournament-rounds from 858 unique golfers, of whom we could identify the ideology of 360 players (82 Democrats and 278 Republicans).12 To address potential selection biases, we conducted multiple robustness checks (see the Additional Analysis and Robustness Checks section).
Table 1 displays the summary statistics, including performance data for different shot stages, whereas Table 2 presents the correlations among our main variables.
|

Table 1. Summary Statistics for the PGA Tour Data
| Variable | Level of obs. | Obs. count | Mean | SD | Min | Max |
|---|---|---|---|---|---|---|
| Number of strokes needed to complete round | Player-tournament-round | 25,332 | 71.153 | 3.347 | 59 | 92 |
| Performance (number of strokes – par) | Player-tournament-round | 25,332 | 0.007 | 3.311 | −11 | 22 |
| Rank | Player-tournament-round | 25,332 | 57.34 | 39.44 | 1 | 156 |
| OWGR Score (raw) | Player-tournament-round | 16,944 | 2.117 | 1.694 | 0.5 | 21.8 |
| OWGR Score | Player-tournament-round | 25,332 | 1.416 | 1.706 | 0 | 21.8 |
| Round (0 for round 1 and 1 for round 2) | Player-tournament-round | 25,332 | 0.491 | 0.500 | 0 | 1 |
| Avg. Peer Performance (in Current Tournament Round) | Player-tournament-round | 25,332 | 0.007 | 2.648 | −10 | 16 |
| Avg. Peer Ability (OWGR Score of Other Players) | Player-tournament-round | 25,332 | 1.416 | 1.503 | 0 | 14 |
| Total Times Played with Others in Group | Player-tournament-round | 25,332 | 2.717 | 1.785 | 1 | 15 |
| Age (in years) | Player-tournament-round | 25,324 | 35.436 | 7.201 | 17 | 73 |
| Cut | Player-tournament-round | 22,355 | 0.591 | 0.492 | 0 | 1 |
| Purse Share | Player-tournament-round | 22,355 | 0.987 | 2.367 | 0 | 18 |
| Total SG | Player-tournament-round | 22,618 | 0.035 | 2.976 | −18.0 | 10.2 |
| Driving Accuracy | Player-tournament-round | 22,145 | 0.616 | 0.158 | 0.1 | 1 |
| Driving Distance | Player-tournament-round | 22,071 | 290.36 | 17.67 | 204 | 373.5 |
| Driving SG | Player-tournament-round | 19,055 | 0.005 | 1.101 | −7.7 | 4.0 |
| Approach to the Green SG | Player-tournament-round | 19,055 | 0.037 | 1.675 | −11.3 | 6.4 |
| Around the Green SG | Player-tournament-round | 19,055 | −0.013 | 1.084 | −8.1 | 4.3 |
| Putting SG | Player-tournament-round | 19,055 | 0.012 | 1.740 | −7.5 | 6.5 |
| DG Index | Player-tournament-round | 23,606 | 0.230 | 0.712 | −1.8 | 3.8 |
| Politically Heterogeneous Group (1: yes, 0: no) | Group | 8,718 | 0.704 | 0.457 | 0 | 1 |
| Politically heterogeneous = 1 | Group | 6,134 | ||||
| One Democrat and One Republican | Group | 4,778 | ||||
| One Democrat and Two Republicans | Group | 1,083 | ||||
| Two Democrats and One Republican | Group | 273 | ||||
| Politically heterogeneous = 0 | Group | 2,584 | ||||
| Three Republicans | Group | 2,029 | ||||
| Two Republicans | Group | 506 | ||||
| Three Democrats | Group | 21 | ||||
| Two Democrats | Group | 28 | ||||
| Racially Heterogeneous Group (1: yes, 0: no) | Group | 8,718 | 0.189 | 0.391 | 0 | 1 |
| Nationality Heterogeneous Group (1: yes, 0: no) | Group | 8,718 | 0.531 | 0.499 | 0 | 1 |
| Language Heterogeneous Group (1: yes, 0: no) | Group | 8,718 | 0.194 | 0.396 | 0 | 1 |
| Age Heterogeneity (SD of Age in Group) | Group | 8,710 | 5.783 | 3.190 | 0 | 22.8 |
| Indicator for Ideology | Player | 858 | ||||
| Unknown | Player | 498 | ||||
| Democrat | Player | 82 | ||||
| Republican | Player | 278 | ||||
| Race (1: White, 0: Non-White) | Player | 858 | 0.887 | 0 | 1 | |
| Nationality (1: United States, 0: Non-United States) | Player | 858 | 0.657 | 0 | 1 | |
| Language (1: English, 0: Non-English) | Player | 858 | 0.851 | 0 | 1 | |
| Partisan Conflict Index (standardized) | Month | 204 | −0.165 | 0.993 | −1.8 | 3.5 |
Notes. The summary statistics include only the variables relevant to the Main Results section. We specify whether the number of observations is reported at the player-tournament-round level (25,332 observations), group level (8,718 observations), player level (858 observations), or month level (204 observations). The Raw OWGR Score contains missing values because players ranked above position 200 or 300 in the OWGR did not receive a score. To address this, we assigned a value of zero to these players (OWGR Score). We were unable to find the birth date or age for four players, resulting in slightly fewer observations for Age at the player-tournament-round level and Age Heterogeneity at the group level. The SG data from DataGolf, including variables such as Cut, Purse Share, Total SG, and DG Index, as well as all shot-specific data are based on a smaller sample, which does not match the overall PGA observations. Additionally, the DataGolf SG data do not provide complete information for all variables. Avg., average; Obs., observations; SD, standard deviation.
|
Table 2. Correlation Matrix of Key Variables in PGA Tour Data
| 1 | 2 | 3 | 4 | 5 | 6 | 7 | 8 | 9 | 10 | 11 | 12 | 13 | 14 | 15 | 16 | 17 | 18 | 19 | 20 | 21 | 22 | 23 | 24 | 25 | 26 | 27 | |
|---|---|---|---|---|---|---|---|---|---|---|---|---|---|---|---|---|---|---|---|---|---|---|---|---|---|---|---|
| 1. Performance | |||||||||||||||||||||||||||
| 2. Rank | 0.83* | ||||||||||||||||||||||||||
| 3. Cut | −0.51* | −0.61* | |||||||||||||||||||||||||
| 4. Purse Share | −0.32* | −0.34* | 0.35* | ||||||||||||||||||||||||
| 5. OWGR Score | −0.11* | −0.20* | 0.23* | 0.29* | |||||||||||||||||||||||
| 6. Age | 0.06* | 0.05* | −0.06* | −0.06* | −0.16* | ||||||||||||||||||||||
| 7. Round (0 for round 1 and 1 for round 2) | −0.01 | −0.00 | −0.01 | −0.01 | −0.00 | 0.00 | |||||||||||||||||||||
| 8. Avg. Peer Performance (in Current Tournament Round) | 0.29* | 0.07* | −0.04* | −0.03* | −0.02* | 0.01* | −0.01 | ||||||||||||||||||||
| 9. Avg. Peer Ability (OWGR Score of Other Players) | −0.02* | −0.12* | 0.14* | 0.17* | 0.60* | −0.06* | −0.00 | −0.10* | |||||||||||||||||||
| 10. Total Times Played with Others in Group | −0.07* | −0.09* | 0.11* | 0.13* | 0.38* | 0.03* | −0.00 | −0.07* | 0.42* | ||||||||||||||||||
| 11. Total SG | −0.88* | −0.92* | 0.57* | 0.36* | 0.23* | −0.07* | −0.01 | −0.03* | 0.15* | 0.11* | |||||||||||||||||
| 12. Driving Accuracy | −0.25* | −0.22* | 0.14* | 0.08* | −0.00 | 0.09* | −0.01* | −0.07* | −0.02* | 0.03* | 0.21* | ||||||||||||||||
| 13. Driving Distance | −0.13* | −0.08* | 0.08* | 0.07* | 0.12* | −0.22* | 0.02* | −0.07* | 0.06* | 0.03* | 0.09* | −0.13* | |||||||||||||||
| 14. Driving SG | −0.37* | −0.39* | 0.27* | 0.17* | 0.17* | −0.10* | −0.01 | −0.02* | 0.10* | 0.08* | 0.43* | 0.48* | 0.22* | ||||||||||||||
| 15. Approach to the Green SG | −0.54* | −0.56* | 0.36* | 0.23* | 0.16* | −0.02* | −0.00 | −0.01 | 0.10* | 0.09* | 0.61* | 0.06* | 0.03* | 0.08* | |||||||||||||
| 16. Around the Green SG | −0.34* | −0.34* | 0.21* | 0.12* | 0.09* | 0.02* | 0.00 | −0.02* | 0.06* | 0.05* | 0.38* | 0.01 | −0.02* | −0.00 | 0.02* | ||||||||||||
| 17. Putting SG | −0.55* | −0.56* | 0.32* | 0.20* | 0.06* | −0.03* | −0.00 | −0.02* | 0.04* | 0.02* | 0.60* | 0.00 | −0.00 | 0.01 | 0.01 | 0.00 | |||||||||||
| 18. DG Index | −0.13* | −0.22* | 0.25* | 0.27* | 0.80* | −0.14* | −0.00 | −0.01 | 0.49* | 0.34* | 0.25* | 0.03* | 0.10* | 0.19* | 0.17* | 0.09* | 0.07* | ||||||||||
| 19. Politically Heterogeneous Group (1: yes, 0: no) | 0.04* | 0.04* | −0.03* | −0.02* | 0.03* | −0.15* | −0.00 | 0.05* | 0.03* | 0.03* | −0.02* | −0.07* | 0.04* | −0.01 | −0.02* | −0.01 | −0.01 | 0.00 | |||||||||
| 20. Racially Heterogeneous Group (1: yes, 0: no) | −0.02* | −0.01 | 0.02* | 0.04* | 0.07* | −0.13* | −0.00 | −0.03* | 0.08* | 0.04* | 0.02* | −0.04* | 0.06* | 0.02* | 0.01 | 0.01 | −0.01 | 0.04* | 0.22* | ||||||||
| 21. Nationality Heterogeneous Group (1: yes, 0: no) | 0.04* | −0.00 | 0.03* | 0.02* | 0.15* | −0.07* | −0.00 | 0.05* | 0.17* | 0.05* | 0.03* | −0.06* | 0.03* | 0.01 | 0.01 | 0.03* | −0.00 | 0.12* | 0.41* | 0.25* | |||||||
| 22. Language Heterogeneous Group (1: yes, 0: no) | 0.01 | −0.01 | 0.02* | 0.03* | 0.08* | −0.12* | −0.00 | 0.01 | 0.09* | 0.04* | 0.02* | −0.04* | 0.06* | 0.01 | −0.01 | 0.01 | 0.01 | 0.05* | 0.29* | 0.47* | 0.46* | ||||||
| 23. Age Heterogeneity (SD of Age in Group) | 0.04* | 0.03* | −0.03* | −0.01 | −0.02* | 0.11* | −0.00 | 0.05* | −0.03* | −0.09* | −0.02* | 0.02* | −0.04* | −0.01 | −0.00 | −0.01 | −0.02* | 0.00 | 0.03* | 0.02* | 0.02* | 0.01 | |||||
| 24. Race (1: White, 0: Non-White) | 0.01 | −0.00 | −0.01 | −0.02* | −0.05* | 0.14* | 0.00 | 0.02* | −0.05* | −0.00 | −0.01 | 0.03* | −0.04* | −0.01 | −0.02* | −0.01 | 0.02* | −0.00 | −0.12* | −0.56* | −0.14* | −0.28* | −0.01 | ||||
| 25. Nationality (1: United States, 0: Non-United States) | −0.01* | 0.02* | −0.04* | −0.02* | −0.16* | 0.06* | 0.00 | −0.04* | −0.11* | −0.02* | −0.03* | 0.05* | −0.03* | −0.00 | −0.02* | −0.04* | −0.00 | −0.12* | −0.24* | −0.15* | −0.52* | −0.29* | −0.02* | 0.25* | |||
| 26. Language (1: English, 0: Non-English) | −0.00 | 0.01 | −0.02* | −0.01 | −0.06* | 0.14* | 0.00 | −0.00 | −0.05* | −0.00 | −0.01 | 0.04* | −0.06* | −0.01 | 0.01 | −0.01 | −0.01 | −0.02* | −0.16* | −0.27* | −0.26* | −0.56* | 0.00 | 0.49* | 0.49* | ||
| 27. Partisan Conflict Index (standardized) | −0.04* | 0.05* | 0.00 | 0.02* | 0.06* | −0.13* | −0.00 | −0.05* | 0.07* | 0.15* | −0.00 | −0.04* | 0.07* | 0.04* | −0.02* | −0.01 | 0.00 | 0.04* | 0.19* | 0.19* | 0.11* | 0.15* | 0.01* | −0.11* | −0.07* | −0.09* | |
| 28. Ideology (1: Republican, 0: Democrat) | −0.02* | −0.02* | 0.01 | 0.01 | −0.02* | 0.18* | 0.00 | −0.03* | −0.01 | −0.01 | 0.01 | 0.06* | −0.04* | 0.03* | 0.01* | 0.00 | −0.01 | 0.03* | −0.47* | −0.12* | −0.23* | −0.17* | −0.01 | 0.22* | 0.42* | 0.29* | −0.12* |
Notes. The table displays the pair-wise correlations of the variables relevant to the Main Results section based on the player-tournament-round-level observations (n = 25,332). Statistical significance is indicated with asterisks. Avg., average; SD, standard deviation.
*p < 0.05.
Evidence of Randomization
Before discussing the results, we provide evidence in Figure 2 that the groups are indeed randomized in terms of political affiliation. Specifically, we conducted a permutation test of political affiliation by calculating the mean standard deviation for political ideology within each group in round 1. Then, within a tournament and considering that golfers are allocated into four tiers13 based on past performance, we randomly reallocated players and calculated whether these newly created groups are politically heterogeneous or homogenous. We repeated this process 2,000 times and finally compared the randomized values with the original distribution. We find that the observed proportion is within the 95% range of the average of the simulated values, indicating that there is no systematic sorting into groups.
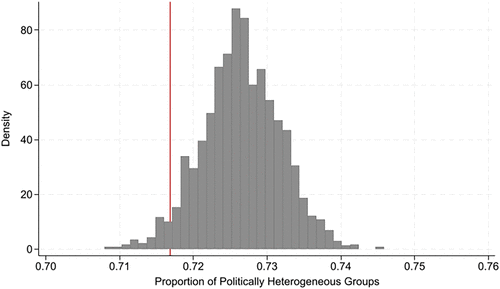
Note. The figure provides evidence supporting the randomization of individual players regarding political ideology based on permutation tests that compare the mean of the original distribution (vertical line) with the mean heterogeneity values after 2,000 random reallocations.
Methodology and Estimation Model
Although randomization within tournaments and tiers eliminates the need for controls at those levels, our crosstournament analysis requires control variables. The inclusion of controls is also important because randomization occurs at the player level, but political views slightly correlate with other sociodemographic variables at the player level. In other words, randomization does not eliminate correlations between attributes within a person.14 To address this issue, we control for within-group heterogeneity across various variables, including age, race, and nationality heterogeneity, to mitigate these correlations as much as possible.
Generally, we estimate Ordinary Least Squares (OLS) regressions to analyze the effect of Political Heterogeneity on the Performance of each player i in group k:
In our regressions, we include individual player and tournament fixed effects. The regressions also control for Player Ability (OWGR Score), Average Peer Performance, Average Peer Ability, Total Times Played with Others (), and whether the play took place in the first or second round. Tournament fixed effects (e.g., “2021 Augusta National”) account for time trends, making separate year controls redundant. is the idiosyncratic error term. Because even within a tournament, each group may face different conditions (regarding weather, green, or audience), we cluster the standard errors at the group level (Moulton 1990).
Main Results
First, we present descriptive evidence of performance differences between politically heterogeneous and homogeneous groups without controls. As shown in Figure 3, we observe systematic differences in performance scores relative to par between these groups.
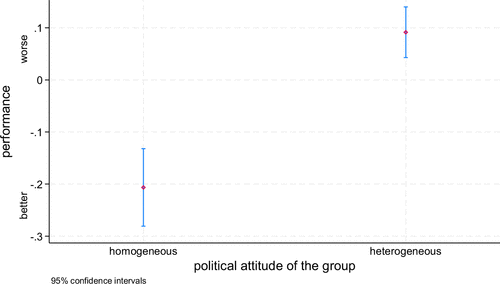
Notes. The figure shows the performance (number of strokes − par) for politically homogeneous and heterogeneous groups. The higher the score is, the worse the performance is.
Effects of Political Heterogeneity Moderated by Political Polarization on Golf Performance
Next, we provide regression evidence of the performance effects associated with political heterogeneity. Table 3 summarizes the regression results for the impact of Political Heterogeneity on Performance. All models include individual golfer and tournament fixed effects and control for the Round (whether the performance is from round 1 or round 2 in the tournament). Column (1) in Table 3 shows a performance difference of approximately 0.2 strokes per round between politically heterogeneous and homogeneous groups. This effect is highly significant at the 0.01% level.
|
Table 3. Effects of Politically Heterogeneity—Moderated by Political Polarization—on Golf Performance
| Performance | ||||||
|---|---|---|---|---|---|---|
| (1) | (2) | (3) | (4) | (5) | (6) | |
| Politically Heterogeneous Group (0/1) | 0.195*** | 0.206*** | 0.184** | 0.169** | 0.169** | 0.196*** |
| (0.056) | (0.058) | (0.058) | (0.055) | (0.055) | (0.056) | |
| Politically Heterogeneous Group × Partisan Conflict Index | 0.100* | |||||
| (0.050) | ||||||
| Racially Heterogeneous Group (0/1) | −0.111 | −0.103 | −0.100 | −0.099 | −0.100 | |
| (0.073) | (0.073) | (0.069) | (0.069) | (0.069) | ||
| Language Heterogeneous Group (0/1) | 0.015 | 0.011 | 0.015 | 0.014 | 0.009 | |
| (0.073) | (0.072) | (0.069) | (0.069) | (0.069) | ||
| Age Heterogeneity (SD of Age in Group) | 0.030*** | 0.020** | 0.017* | 0.016* | 0.017* | |
| (0.007) | (0.007) | (0.007) | (0.007) | (0.007) | ||
| Age | −0.002 | −0.003 | 0.001 | −0.001 | 0.002 | |
| (0.069) | (0.069) | (0.069) | (0.069) | (0.069) | ||
| OWGR Score | −0.254*** | −0.248*** | −0.246*** | −0.246*** | ||
| (0.018) | (0.019) | (0.019) | (0.019) | |||
| Round (0/1) | −0.056 | −0.057 | −0.056 | −0.052 | −0.052 | −0.052 |
| (0.038) | (0.038) | (0.038) | (0.035) | (0.035) | (0.035) | |
| Avg. Peer Performance (in Current Tournament Round) | 0.077*** | 0.077*** | 0.077*** | |||
| (0.012) | (0.012) | (0.012) | ||||
| Avg. Peer Ability (OWGR Score of Other Players) | 0.009 | 0.014 | 0.015 | |||
| (0.018) | (0.019) | (0.019) | ||||
| Total Times Played with Others in Group | −0.020 | −0.020 | ||||
| (0.014) | (0.014) | |||||
| Individual fixed effects | Yes | Yes | Yes | Yes | Yes | Yes |
| Tournament fixed effects | Yes | Yes | Yes | Yes | Yes | Yes |
| Observations | 25,327 | 25,303 | 25,303 | 25,303 | 25,303 | 25,303 |
| Adj. R2 | 0.223 | 0.222 | 0.228 | 0.231 | 0.231 | 0.231 |
Notes. The table presents the regression of Performance (number of strokes – par) on Political Heterogeneity while accounting for Round, player, and tournament fixed effects in column (1). In column (2), we introduce additional control variables, including group-level heterogeneity based on Race, Language, and Age, as well as player Age. Column (3) further incorporates the individual OWGR Score for each player. In column (4), we extend the regression by adding control variables for Peer Performance and Peer Ability. Column (5) also considers the total number of times that each player has previously competed with their peers. Finally, in column (6), we include the interaction between Political Heterogeneity and our moderator, the standardized Partisan Conflict Index. Standard errors are clustered at the group level (shown in parentheses). Statistical significance is indicated with asterisks. Adj., adjusted; Avg., average; SD, standard deviation.
*p < 0.05; **p < 0.01; ***p < 0.001.
In column (2) in Table 3, we extend the regression by including individual- and group-level control variables. These additional variables account for players’ Age as well as group-level heterogeneity in Race and Language.15 Although most golf tournament studies do not include these controls (Guryan et al. 2009a, Flynn and Amanatullah 2012, Hickman and Metz 2018), our approach draws from the broader literature on homophily, where it is standard to consider heterogeneity in Race, Age, Nationality, and Language when studying social dynamics and performance. This approach prevents confounding by other more visible forms of heterogeneity. The regression indicates a performance gap of 0.21 strokes per round between politically heterogeneous and homogeneous groups, consistent with our baseline analysis.
Age Heterogeneity shows a systematic negative effect, with players in age-heterogeneous groups performing worse. This effect remains significant in subsequent models. However, we do not observe significant performance effects for Race or Language Heterogeneity. Although this may seem surprising given the existing literature, these noneffects likely reflect both the limited variance in our sample and the possibility that demographic distinctions are less salient than political views in the PGA Tour setting. The language variable, coded based on country of birth, may not capture actual language proficiency because most PGA Tour golfers are fluent in English regardless of origin. Similarly, with 89% of players being White and the prominence of top non-White players, like Tiger Woods and Vijay Singh, our sample offers limited racial variance.16
To account for variations in players’ objective abilities over time, column (3) in Table 3 includes the most recent OWGR Score as an objective measure of quality along with the controls from column (2) in Table 3. The magnitude of the effects remains unchanged, showing a statistically significant difference in performance of 0.18 strokes per round for players in politically heterogeneous versus homogeneous groups. The OWGR Score performs as expected; higher scores correlate with fewer strokes, reflecting better performance.17
Given that prior research suggests that a focal individual’s performance may be influenced by their peers’ performance (Flynn and Amanatullah 2012, Hickman and Metz 2018), we included peer control variables in column (4) in Table 3. Using the OWGR Score to measure general peer skill levels showed no significant effects, whereas controlling for peers’ performance in the focal tournament-round revealed positive peer effects, suggesting that actual performance in the specific context matters more than expected skill levels. Despite these additional controls, our main results remain robust, with a 0.17-stroke difference in performance per round for golfers in politically heterogeneous groups.
In column (5) in Table 3, we assess the impact of familiarity by including the total number of times that a golfer has previously played with their group members. Surprisingly, this variable does not significantly affect performance. However, this measure may be insufficiently granular, missing familiarity from excluded tournament rounds or informal social interactions. To ensure robustness, we tested alternative familiarity measures, such as the sequence of times that golfers played together, prior interactions within our sample, and prior-year participation rates. None of these produced significant effects (see Table A4 in the Online Appendix), reinforcing our primary results.
To test Hypothesis 2, we leverage external variation in political polarization in the United States. For a precise measure of political disagreement, we use the monthly varying Partisan Conflict Index as a moderator. In column (6) in Table 3, we regress Performance on Political Heterogeneity and include an interaction term between the standardized Partisan Conflict Index and Political Heterogeneity. We also control for Race, Language, and Age Heterogeneity at the group level as well as the individual Age of the golfers. Furthermore, we include the objective ability score (OWGR Score), Peer Performance, Peer Ability, and the total number of times that a golfer has played with other players in their group. The dummy variable for politically heterogeneous groups remains significant, indicating that golfers in these groups require approximately 0.2 additional strokes per round. The interaction term with the Partisan Conflict Index is significant (p < 0.05), supporting Hypothesis 2; the performance difference increases during periods of heightened political disagreement. At the maximum observed level of political polarization in our data, the performance difference between heterogeneous and homogeneous groups increases to 0.55 strokes, whereas at its minimum, it diminishes to 0.02 strokes.
Heterogeneous Treatment Effects
To investigate our mechanism more thoroughly, we acquired additional data from DataGolf, a golf data provider that categorizes player performance across four stages of play as illustrated in Figure 1: (1) driving, which is the initial shot from the tee box aimed at covering the greatest distance; (2) approach to the green, which are longer shots from the fairway or rough aimed at reaching the green; (3) around the green, which are shorter precision shots taken near the green to set up a putt; and (4) putting, which are strokes made on the green to finish the hole. These stages differ not only in technique but also in the physical proximity of players to one another. Players are closer during the driving and putting stages—critical moments in performance—whereas they are typically more dispersed during the approach to the green and around the green stages depending on shot outcomes. Figure 1 highlights these differences by showing the typical positioning of players for each type of shot on a par 4 hole using a heat map to represent shot locations. Figure A6 in the Online Appendix shows the distribution of SG DataGolf Performance scores across stages, demonstrating that low- and high-proximity stages exhibit similar variations.
In column (1) in Table 4, we replicate our main analysis using Total SG instead of Performance as our dependent variable. The sample is smaller than our main analysis because DataGolf data are only available after 2004. Using the DG Index instead of OWGR Score as our control for player ability because it is measured in compatible strokes-gained units, we find that golfers in politically heterogeneous groups have a Total SG difference of −0.21 strokes (p < 0.001). The interaction with the Political Polarization Index is weaker (p < 0.10), likely because of the smaller sample.
|
Table 4. Heterogeneous Treatment Effects Using SG Golf Data for Various Performance Stages
| Total SG | Drive Acc. | Drive Dist. | Drive SG | App. SG | Arg. SG | Putt SG | |
|---|---|---|---|---|---|---|---|
| (1) | (2) | (3) | (4) | (5) | (6) | (7) | |
| Politically Heterogeneous Group (0/1) | −0.209*** | −0.005* | −0.326 | −0.032 | −0.065 | −0.010 | −0.097* |
| (0.061) | (0.003) | (0.258) | (0.022) | (0.036) | (0.023) | (0.038) | |
| Politically Heterogeneous Group × Partisan Conflict Index | −0.097 | −0.004 | 0.070 | −0.043* | −0.011 | −0.032 | −0.045 |
| (0.056) | (0.002) | (0.257) | (0.020) | (0.035) | (0.022) | (0.036) | |
| Racially Heterogeneous Group (0/1) | 0.146 | 0.004 | 0.137 | 0.029 | 0.043 | 0.029 | −0.005 |
| (0.076) | (0.003) | (0.330) | (0.027) | (0.045) | (0.029) | (0.045) | |
| Language Heterogeneous Group (0/1) | 0.006 | −0.002 | 0.145 | 0.007 | −0.056 | 0.017 | 0.040 |
| (0.074) | (0.003) | (0.322) | (0.027) | (0.045) | (0.028) | (0.045) | |
| Age Heterogeneity (SD of Age in Group) | −0.020** | 0.000 | −0.064 | −0.003 | −0.002 | 0.000 | −0.012** |
| (0.008) | (0.000) | (0.034) | (0.003) | (0.004) | (0.003) | (0.005) | |
| Age | −0.057 | 0.006 | 0.146 | 0.030 | 0.043 | −0.047 | −0.067 |
| (0.072) | (0.003) | (0.280) | (0.027) | (0.042) | (0.028) | (0.046) | |
| OWGR Score | −0.001 | −0.129 | −0.018* | −0.041** | −0.003 | −0.035** | |
| (0.001) | (0.081) | (0.008) | (0.013) | (0.008) | (0.013) | ||
| DG Index | 0.734*** | ||||||
| (0.049) | |||||||
| Round (0/1) | −0.042 | −0.005** | 0.516** | −0.039** | −0.016 | 0.004 | −0.024 |
| (0.039) | (0.002) | (0.175) | (0.014) | (0.022) | (0.015) | (0.024) | |
| Avg. Peer Performance (in Current Tournament Round) | 0.004 | −0.001** | −0.030 | −0.006 | 0.007 | −0.000 | 0.010 |
| (0.012) | (0.000) | (0.040) | (0.004) | (0.006) | (0.004) | (0.007) | |
| Avg. Peer Ability (OWGR Score of Other Players) | 0.008 | −0.001 | 0.061 | −0.006 | 0.003 | 0.007 | −0.009 |
| (0.020) | (0.001) | (0.082) | (0.007) | (0.012) | (0.008) | (0.012) | |
| Total Times Played with Others in Group | 0.019 | 0.001 | 0.085 | 0.002 | 0.012 | −0.004 | −0.008 |
| (0.015) | (0.001) | (0.062) | (0.005) | (0.009) | (0.006) | (0.009) | |
| Moving Average (last 10 rounds DV SG) | 1.023*** | 0.948*** | 1.010*** | 1.003*** | 1.026*** | 1.061*** | |
| (0.018) | (0.017) | (0.022) | (0.023) | (0.025) | (0.023) | ||
| Individual fixed effects | Yes | Yes | Yes | Yes | Yes | Yes | Yes |
| Tournament fixed effects | Yes | Yes | Yes | Yes | Yes | Yes | Yes |
| Observations | 21,078 | 21,805 | 21,731 | 18,631 | 18,631 | 18,631 | 18,631 |
| Adj. R2 | 0.065 | 0.386 | 0.611 | 0.232 | 0.154 | 0.135 | 0.131 |
Notes. The table presents regression results of golfer SG performance (number of strokes of an average PGA player – number of strokes of the focal player) on Political Heterogeneity; the interaction between Partisan Conflict Index (moderator) and Political Heterogeneity; group-level heterogeneity in Race, Language, and Age; player Age; ability (OWGR Score); Peer Performance; Peer Ability; and the total number of times that each golfer has competed with others in the group. The analysis also accounts for Round, player, and tournament fixed effects. Column (1) analyzes the Total SG as the dependent variable (DV) using the DG Index instead of the OWGR Score to measure player ability. Columns (2), (3), and (4) investigate Driving Accuracy (Acc.; percentage of fairways hit), Driving Distance (Dist.; in yards), and Driving SG performance, respectively, incorporating a moving average of SG performance over the last 10 rounds for each DV. Columns (5), (6), and (7) assess SG performance in Approach to the Green (App.), Around the Green (Arg.), and Putting, respectively, while controlling for average SG performance from the last 10 rounds for each corresponding DV. Standard errors are clustered at the group level (in parentheses). Statistical significance is indicated with asterisks. Adj., adjusted; Avg., average; SD, standard deviation.
*p < 0.05; **p < 0.01; ***p < 0.001.
Columns (2), (3), and (4) in Table 4 focus on the Driving stage. In each of these regressions, we include a variable indicating average past performance—based on the last 10 rounds played—in the specific stroke category used as the dependent variable. Consistent with insights from the interviews that we conducted with golfers, it is not Driving Distance (yards from tee to landing spot) (column (3) in Table 4) but Driving Accuracy (percentage of times that the ball lands on the fairway) (column (2) in Table 4) that suffers when playing in politically heterogeneous groups. Golfers experience a 0.5-percentage-point decrease in fairway hits with their drive, indicating a slight deviation in their swing. At a combined SG level for Driving (column (4) in Table 4), the interaction between Political Heterogeneity and the moderator suggests that golfers lose up to 0.15 strokes in Driving during highly polarized periods.
Columns (5) and (6) in Table 4 explore performance effects during the Approach to the Green and Around the Green stages, where golfers are generally farther apart from each other. As before, we include a control variable for each golfer’s past performance in these stages. In both cases, we do not find a significant difference between politically homogeneous and heterogeneous groups. The absolute effect for Approach to the Green strokes appears relatively large because on par 3 courses, the first stroke—where golfers are in close proximity—counts as an Approach to the Green stroke. Unfortunately, we are unable to separate this stage into par 4 and par 5 versus par 3 Approach to the Green strokes.
In column (7) in Table 4, we use SG performance in Putting as the dependent variable and include the average individual Putting performance from the last 10 rounds in our model. In this stage, where players experience closer proximity, we once again find that political heterogeneity has an effect. Golfers playing with group members who have differing political ideologies require about 0.1 strokes more than the average golfer. The Putting stage accounts for approximately half of the strokes lost over the Total round. This pattern supports our proposed mechanism and highlights the conditions under which political heterogeneity impacts performance.
“Economic” Effects of Political Heterogeneity
In Table 5, we analyze alternative performance measures as dependent variables, including Rank (measured for round 1 and round 2, respectively), whether a golfer made the Cut, and the Purse Share earned (based on the official finishing positions in tournaments). Column (1) in Table 5 shows that golfers in politically heterogeneous groups rank approximately 2.5 positions lower per round compared with those in politically homogeneous groups. This gap widens further (increasing to 3.9 positions per round) during periods of peak political polarization. In column (2) in Table 5, we find that the probability of making the Cut is about 5.3% lower for players in politically heterogeneous groups. This effect becomes even more pronounced during periods of high societal polarization, rising to 7.7% (significant at the 1% level). Players who fail to make the cut do not receive any prize money, whereas those who make the cut earn, on average, $171,000 in tournaments with average prize money or $308,000 in tournaments with high prize money.
|
Table 5. “Economic” Effects of Political Heterogeneity
| Rank | Cut | Purse Share | |
|---|---|---|---|
| (1) | (2) | (3) | |
| Politically Heterogeneous Group (0/1) | 2.520*** | −0.053*** | −0.117* |
| (0.750) | (0.010) | (0.046) | |
| Politically Heterogeneous Group × Partisan Conflict Index | 1.430* | −0.024** | −0.055 |
| (0.681) | (0.009) | (0.053) | |
| Racially Heterogeneous Group (0/1) | −1.450 | 0.024* | 0.122* |
| (0.921) | (0.011) | (0.055) | |
| Language Heterogeneous Group (0/1) | 0.390 | 0.003 | 0.067 |
| (0.914) | (0.011) | (0.055) | |
| Age Heterogeneity (SD of Age in Group) | 0.208* | −0.003** | −0.009 |
| (0.087) | (0.001) | (0.006) | |
| Age | 0.196 | −0.008 | −0.111* |
| (0.883) | (0.011) | (0.055) | |
| OWGR Score | −2.970*** | 0.044*** | 0.300*** |
| (0.239) | (0.003) | (0.023) | |
| Round (0/1) | −0.526 | −0.000 | −0.003 |
| (0.460) | (0.006) | (0.027) | |
| Avg. Peer Performance (in Current Tournament Round) | 0.297* | 0.002 | 0.025*** |
| (0.146) | (0.002) | (0.007) | |
| Avg. Peer Ability (OWGR Score of Other Players) | −0.231 | −0.001 | 0.014 |
| (0.236) | (0.003) | (0.018) | |
| Total Times Played with Others in Group | −0.225 | 0.005* | 0.009 |
| (0.185) | (0.002) | (0.014) | |
| Individual fixed effects | Yes | Yes | Yes |
| Tournament fixed effects | Yes | Yes | Yes |
| Observations | 25,303 | 22,347 | 22,347 |
| Adj. R2 | 0.124 | 0.167 | 0.135 |
Notes. The table examines alternative performance measures as dependent variables: Rank (column (1); measured for rounds 1 and 2), the probability of making the Cut (column (2); based on official tournament finishing positions), and the Purse Share earned (column (3); based on official tournament finishing positions). Control variables include Political Heterogeneity; group-level heterogeneity in Race, Language, and Age; player Age; ability (OWGR Score); Peer Performance; Peer Ability; and the total number of times that each player has competed with others in the group. The standardized Partisan Conflict Index is used as a moderator and is interacted with the main independent variable, Political Heterogeneity. The analyses also include Round, player, and tournament fixed effects. Standard errors are clustered at the group level (shown in parentheses). Statistical significance is indicated with asterisks. Adj., adjusted; Avg., average; SD, standard deviation.
*p < 0.05; **p < 0.01; ***p < 0.001.
To more precisely estimate the difference in final prize money, we use Purse Share as the dependent variable. This metric is calculated as the percentage of the purse that each player receives based on their final ranking at the end of the tournament (column (3) in Table 5). Our analysis shows that, on average, players in heterogeneous groups receive a 0.12% lower purse share than those in homogenous groups. Given that the total price pool of a tournament typically ranges from $10 million to $20 million, this difference translates to a financial loss of approximately $13,000 or $23,400 in tournaments with average or high prize money, respectively.
To conclude, our analysis provides strong support for both hypotheses. First, we find a consistent and economically meaningful performance gap of 0.2 strokes per round between politically homogeneous and heterogeneous groups. Second, this performance difference more than doubles to 0.55 strokes during periods of high political polarization while virtually disappearing (decreasing to 0.02 strokes) during periods of low polarization. Shot-level data show that these effects occur primarily when players are in close proximity—during driving and putting shots—but not in other stages of play. This proximity pattern combined with the moderating effect of societal polarization offers compelling evidence for our proposed anxiety-based mechanism through which political differences affect individual performance.
Additional Analysis and Robustness Checks
Overview of the Section
In this section, we present a comprehensive set of robustness checks and additional analyses to evaluate the sensitivity of our results. All regressions used for these analyses are based on our primary model introduced in column (6) in Table 3. We test alternative variable specifications, interaction effects, relationship ties between players, shot-level performance patterns, and potential selection issues. We also explore the role of additional player characteristics and perform sensitivity analyses for unobserved variables. Throughout these analyses, our primary findings remain remarkably consistent, reinforcing the robustness of our main conclusions.
Exploring Effect Heterogeneities and Alternative Model Specifications
Adding Additional Control Variables to the Main Model.
In Table A1 in the Online Appendix, we test the robustness of our main findings by incorporating additional controls for nationality composition and group size. Column (1) in Table A1 in the Online Appendix replaces language heterogeneity with national heterogeneity to more accurately capture cultural and communication differences. Column (2) in Table A1 in the Online Appendix adds a control for group size (two-player groups versus three-player groups), whereas column (3) in Table A1 in the Online Appendix limits the analysis to three-player groups. Across all specifications, the effect of political heterogeneity remains stable at approximately 0.19 strokes (p < 0.001), and its interaction with the Partisan Conflict Index remains significant. Age heterogeneity consistently exhibits a small but significant negative effect, whereas nationality heterogeneity does not show any significant impact. The stability of these results across different specifications underscores the robustness of our main findings. The differential effects between political and demographic heterogeneity in our study likely reflect that political differences directly signal divergent values and beliefs in the PGA Tour context, overriding demographic differences that do not provoke the same strong anxiety response.
Adding Interaction Effects to the Main Model.
In Table A5 in the Online Appendix, we extend our main model by analyzing various interaction terms. In column (1) in Table A5 in the Online Appendix, we compare the effects of political heterogeneity between the first and second rounds of tournaments. Our analysis shows that the performance difference between politically homogeneous and heterogeneous groups remains consistent across both rounds. This stability suggests that the effect is not a transient phenomenon limited to the initial round but rather, a persistent influence throughout the competition.
In column (2) in Table A5 in the Online Appendix, we investigate whether the political leaning of the state where the tournament occurs influences the impact of political heterogeneity. We categorized states as blue or red based on the results of the most recent presidential election preceding the tournament and interacted the focal player’s political affiliation with the state’s political leaning to determine if playing in a politically aligned or nonaligned state affected the golfer’s performance. We found no evidence to indicate that alignment between the focal player’s political orientation and the state’s political leaning modifies the influence of political heterogeneity on performance. This conclusion holds even when we consider a model that interacts the focal player’s political views with the partisanship of the sitting U.S. president (results not shown here).
In column (3) in Table A5 in the Online Appendix, we explore the interaction effect between political heterogeneity and the ideology of the focal player. Although the main effect of political heterogeneity remains stable, the interaction between political heterogeneity and the standardized Partisan Conflict Index becomes insignificant at the 5% level, achieving significance only at the 6% level.
Finally, in column (4) in Table A5 in the Online Appendix, we assess whether higher-ranked golfers respond differently to politically heterogeneity by interacting our main variable with the OWGR Score. Our primary results become more pronounced, revealing a performance difference of 0.28 strokes per round for players in heterogeneous groups compared with those in homogeneous groups (a 43% increase from our base model). However, the negative interaction coefficient (−0.06, p < 0.05) indicates that more skilled players are less affected by the political composition of their group. Because our analysis already focuses on top PGA players, we remain cautious about overinterpreting these findings.
In column (5) in Table A5 in the Online Appendix, we conduct an additional specification where all measures of diversity (e.g., age, race, and language) are interacted with the polarization index. The results show that these interactions are not statistically significant. Notably, the interaction between political heterogeneity and the polarization measure remains marginally significant at p = 0.07.
Across all specifications, the main effect of political heterogeneity remains significant, ranging from approximately 0.18 to 0.28 strokes (p < 0.01), whereas the control variables display consistent effects. Both the OWGR Score (−0.20 to −0.25) and peer performance (approximately 0.08) exhibit stable influences across all models.
Adding Measurements for Relationships to the Main Model.
Table A6 in the Online Appendix incorporates various control variables to measure relationship ties between golfers in our main model. We explored several approaches, including known friendships based on online searches (column (1) in Table A6 in the Online Appendix) and residential proximity at the state level (column (2) in Table A6 in the Online Appendix), city level (column (3) in Table A6 in the Online Appendix), and specific golfing hub level (such as Jupiter and Orlando in Florida or Scottsdale in Arizona) (column (4) in Table A6 in the Online Appendix). Our analysis did not find significant effects for any of these relationship measures, nor did controlling for these variables alter our main outcomes. The effect of political heterogeneity remained stable at approximately 0.195 strokes (p < 0.001) across all specifications.
Because golfers rarely discuss their enemies publicly and because there is often confusion between being competitive rivals and personal enemies, we collected data on players generally perceived as unpopular or disliked (column (5) in Table A6 in Online Appendix) on the PGA Tour. However, instances of such perceptions were limited, and we did not observe any significant effects. Recognizing that slow play is another common source of frustration as mentioned by our interviewees, we conducted an additional analysis by creating a dummy variable for golfers grouped with players known for slow play (column (6) in Table A6 in the Online Appendix). This analysis also showed no significant effects. Notably, across all specifications, the effect of political heterogeneity remained stable at approximately 0.195 strokes (p < 0.001).
Adding Additional Dependent Variables for the Shots Data.
In Table A7 in the Online Appendix, we present additional analyses using the SG data. The detailed performance metrics from DataGolf allow us to identify great and poor rounds (both overall and for each stage), with great performance defined as the top 5% of SG values in each category and poor performance defined as the bottom 5%, as well as a moving average of great or poor rounds for the last 10 rounds played. Columns (1), (2), and (3) in Table A7 in the Online Appendix examine whether a golfer played an overall good round, had a good driving round, or had a good putting round, respectively. Golfers in politically heterogeneous groups are 4.7% less likely to have great overall rounds (p < 0.01) and 3.1% less likely to have great putting rounds (p < 0.001), whereas driving performance shows no significant difference. Columns (4), (5), and (6) in Table A7 in the Online Appendix evaluate whether a golfer had a bad round overall, had a bad round in driving, or had a bad round in putting, respectively. Players in heterogeneous groups are 5.3% more likely to have poor overall rounds (p < 0.01; sharply increasing during periods of high polarization, p < 0.001) and 2.0% more likely to have poor putting rounds (p < 0.05). For driving, there is no significant overall effect, but the interaction with political polarization shows a positive trend (1.3%, p < 0.05), indicating a higher likelihood of poor driving performance during periods of intense polarization. Column (7) in Table A7 in the Online Appendix shows that players in politically heterogeneous groups are 0.3% more likely (p < 0.05) to withdraw after making the cut (made cut, did not finish (MDF)).
Investigating Whether Being Political Minorities and Majorities Influences Performance.
In Table A8 in the Online Appendix, we conducted a series of robustness checks. First, for groups with a 2:1 political composition, we tested whether a Democrat performs differently when they are with two Republicans versus when they are with another Democrat (and vice versa for Republicans). As shown in column (1) in Table A8 in the Online Appendix, no significant differences emerged, indicating that being part of a political majority or minority does not affect individual performance. We further examined whether the performance of the minority player in politically heterogeneous groups—defined as either the lone Democrat among Republicans or the lone Republican among Democrats—differed from the performance of majority players. The results in column (2) in Table A8 in the Online Appendix suggest that minority status does not significantly impact performance, and the interaction terms for focal player ideology were not significant.
In both columns (1) and (2) in Table A8 in the Online Appendix, the political affiliation of all group members was known. However, in previous analyses throughout the paper, groups were classified as heterogeneous even if one player’s political affiliation was unknown, provided that the affiliations of the other two members were different. Column (3) in Table A8 in the Online Appendix focuses exclusively on groups where all three players’ political affiliations are known. This robustness check confirms that the results remain consistent, reinforcing the validity of our findings. Furthermore, column (4) in Table A8 in the Online Appendix includes only players who have competed in both homogeneous and heterogeneous groups. This within-player design controls for individual characteristics, isolating the effect of political heterogeneity. The performance effect remains significant and consistent in magnitude, reinforcing the reliability of our findings. However, it is worth noting that for both columns (3) and (4) in Table A8 in the Online Appendix, the interaction term between Politically Heterogeneous Group and the Partisan Conflict Index is slightly reduced and only significant at the 6% level.
We expanded our analysis further in Table A9 in the Online Appendix to explore the role of the rare non-U.S. born players that we coded as Democrats or Republicans. In these analyses, we first categorized the political ideology of non-U.S.-born players as unknown and re-examined the impact of Politically Heterogeneous Group on performance outcomes (column (1) in Table A9 in the Online Appendix). In columns (2) and (3) in Table A9 in the Online Appendix, we restricted the sample to U.S.-born players only or focused on groups consisting entirely of U.S.-born golfers, respectively. The main effects remain robust, although the interaction term between Politically Heterogeneous Group and the Partisan Conflict Index becomes slightly smaller and is only significant at the 7% level in some specifications. In column (4) in Table A9 in the Online Appendix, we recoded Politically Heterogeneous Group after categorizing the political ideology of non-U.S. players as unknown. In this case, our results become even slightly stronger than our baseline results. These analyses help ensure that the presence of non-U.S. players with political ideology does not drive our observed effects.
Finally, Table A10 in the Online Appendix examines the potential impact of playing with golfers of unknown political ideology, distinguishing between U.S. and non-U.S. players. In column (1) in Table A10 in the Online Appendix, we divided Politically Heterogeneous Groups into those where the ideology of all players is known, those where the ideology of one player is unknown and that player is a U.S. player, and those where one golfer has an unknown political ideology and is a non-U.S. player. Although the performance effect seems to be largest for the group with one unknown ideology of a non-U.S. player, there is no significant difference except for the difference to the homogeneous baseline group.
In columns (2) and (3) in Table A10 in the Online Appendix, we assessed whether playing with a player with unknown ideology influences performance differently for Democrats and Republicans, respectively, using group constellations of DDX, RRX, DX, and RX. We also tested more complex group compositions (DXX and RXX) where both players with unknown ideologies are either both U.S. golfers or both non-U.S. golfers. Across these additional robustness checks, we did not find any significant effects, indicating that the presence of a U.S. or non-U.S. player with unknown political ideology does not materially impact performance outcomes for Democrats or Republicans.
Using Additional L2 Data to Control for Further Player Characteristics.
Although groups are randomized, that randomization occurs at the player level rather than at the attribute level, which does not eliminate correlations between certain attributes. Although we control for heterogeneity across various variables, there may still be concerns about unobserved characteristics that have not been captured or accounted for. To address this, we collected additional data on the golfers. Specifically, we obtained information from L2 on golfers’ religion, education, hobbies, and other personal attributes, such as pet ownership, gun ownership, and interest in home improvement (as described above, L2 collects these data based on credit card usage).
We include these variables as controls in columns (1), (2), (3), and (4) in Table A11 in the Online Appendix, progressively adding more detailed characteristics. Column (1) in Table A11 in the Online Appendix includes confounders for education and interest in religion. Column (2) in Table A11 in the Online Appendix additionally incorporates basic consumer and hobby data, whereas columns (3) and (4) in Table A11 in the Online Appendix add increasingly comprehensive sets of variables measuring personal characteristics and interests. For these L2 variables, which are mostly binary indicators (e.g., gun owner = 0/1, home improvement interest = 0/1), we measure group-level heterogeneity using the standard deviation of these binary variables within each group. This approach captures the dispersion in these characteristics among group members. For example, if all players in a group have the same characteristic (e.g., if all own guns or if none own guns), the standard deviation would be zero, indicating homogeneity. If there is variation in the characteristic within the group, the standard deviation would be positive, indicating heterogeneity. We apply this measurement approach consistently across all binary consumer and hobby characteristics, creating a comprehensive measure of lifestyle and interest heterogeneity within groups.
Although these data are available for only 37% of golfers (reducing our sample to 15,253 observations), the effect of political heterogeneity remains significant and stable (ranging from 0.22 to 0.27 strokes, p < 0.001) across all specifications. The interaction with the Partisan Conflict Index also remains consistent (0.111–0.130; but is slightly above the p < 0.05 significance level for most specifications). This robustness to extensive additional controls, including various dimensions of lifestyle heterogeneity, reinforces the conclusion that our main findings are not driven by underlying lifestyle differences that might correlate with political views.
Konfound Analysis.
To further strengthen our findings, we conducted a sensitivity analysis (the so-called Konfound test) to determine whether any unobserved variable might threaten the validity of our main result. This test examines how strong the correlation would need to be between an unobserved variable, X, and political heterogeneity for the coefficient estimate of our primary variable to become insignificant when controlling for heterogeneity along X. Specifically, we created an artificial variable that correlates with performance at the same level as political heterogeneity (4%) and systematically increased its correlation with political heterogeneity until our main effect disappeared.
Column (4) in Table A11 in the Online Appendix shows that even with an artificial variable correlated at 55% with political heterogeneity, our main effect remains marginally significant (0.12, p < 0.10), and the interaction with the Partisan Conflict Index remains stable (0.10, p < 0.05). The main effect would only become insignificant if an unobserved variable’s variance was correlated above 55% with political heterogeneity—equivalent to an individual-level correlation of 74% or higher. This high threshold for correlation suggests that even if highly divisive variables (such as views on abortion) were available and controlled for, they would likely not affect the primary results. No known variable correlates this strongly with political views; even abortion, one of the most divisive political issues, correlates with political affiliation at only 35%. Therefore, even if we had data on golfers’ views on abortion, controlling for it would likely not render the main effect insignificant.
Heterogeneity Across Time, States, and Tournament Types: Investigating and Controlling for Possible Selection-into-Sample Issues.
Our coding of group-level political heterogeneity results in unequal sampling probabilities for homogeneous and heterogeneous groups. For example, if the first player in a group is a Republican and the second is a Democrat, the group is coded as politically heterogeneous regardless of the third player’s affiliation, and thus, it enters our sample. However, if both the first and second players are Republican, the group only enters our sample if the third player’s affiliation is known.
An analysis of player composition (Table A12 in the Online Appendix) indicates that the player age remained stable (34–35 years old) over time. Additionally, the proportions of Democrats and Republicans remain relatively consistent at 20:80 across various tournament types, locations, and time periods. However, as shown in Figure A7 in the Online Appendix, the proportion of U.S. players with identifiable party affiliations has decreased over time, possibly reflecting reduced political disclosure in an increasingly polarized climate. Additionally, the proportion of Republican-affiliated players has declined, whereas the percentage of non-U.S. players has increased, aligning with broader internationalization trends in professional golf. This sampling issue warrants investigation.
Our empirical strategy addresses many of these compositional concerns by including tournament-by-year fixed effects (e.g., the 2019 Masters or the 2016 Farmers Insurance Open), meaning that each tournament in a given year is treated as its own fixed effect. These fixed effects control for any tournament-specific factors, such as prestige; prize money; course difficulty; weather conditions; and the composition of the overall player pool in that specific year and tournament, such as changes in the proportion of U.S. players, the proportion of players with identified political affiliations, or the share of Republicans among them at that specific point in time. By focusing on within-tournament variation, we effectively compare the performance of players in heterogeneous versus homogeneous groups (Hypothesis 1) who are competing under identical conditions. This approach helps isolate the effect of political heterogeneity from other potential confounding factors that vary across tournaments or over time.
However, we recognize that Hypothesis 2 (the interaction between Political Heterogeneity and the Partisan Conflict Index) is more susceptible to time trends because it relies on across-tournament variation in polarization levels over time. If the increasing Partisan Conflict Index correlates with selection processes, such as a growing reluctance of moderate players to disclose their political affiliations, this could potentially bias the interaction effect. To address this concern, we conducted several additional robustness tests.
In column (1) in Table A13 in the Online Appendix, we replaced tournament fixed effects with year fixed effects, which absorb any general time trend. Because this specification removes within-year tournament variation, we also include controls for tournament types (e.g., majors, alternate events, WGC events, flagship events). The main effect of Political Heterogeneity remains stable at 0.24 strokes, and the interaction with the Partisan Conflict Index remains statistically significant at p < 0.08. Although the precision of the estimate is slightly reduced compared with our baseline model, this result suggests that broad time-trend controls do not eliminate the effect.
For the analysis in column (2) in Table A13 in the Online Appendix, we divided the data into two equal parts based on observation count (resulting in a pre-2013 and post-2013 split) and added a dummy variable indicating whether a given tournament is in the first or second part of the sample. We then interacted this dummy variable with the Political Heterogeneity and Partisan Conflict Index interaction to account for potential time trends. We find that the performance gap between politically heterogeneous and homogeneous groups remains significant, and the interaction of Political Heterogeneity with the Partisan Conflict Index slightly increases in magnitude, although it becomes marginally significant (p < 0.07). The interaction of the post-2013 dummy with Political Heterogeneity and the Partisan Conflict Index shows no significant differences between the two periods. This suggests that the observed effect is not driven solely by late-period polarization or early-period political disclosure patterns.
Finally, to further rule out the possibility that changes in the composition of tournaments over time drive our findings, we created multiple matched sets of tournaments that had similar compositions in terms of the proportions of U.S. players, identified political partisans, and Republican players among the partisans but occurred at different points in time with different Partisan Conflict Index levels. For the analysis in column (3) in Table A13 in the Online Appendix, we matched tournaments into eight groups based on whether the tournament’s composition was above or below the median for each key characteristic. In column (4) in Table A13 in the Online Appendix, we did the same but within each presidential cycle (e.g., 2017–2020), whereas column (5) in Table A13 in the Online Appendix matches tournaments within individual years. In columns (6) and (7) in Table A13 in the Online Appendix, we use Sturge’s rule to create finer tournament bins using either all three composition measures or just two (proportion of U.S. players and identified Republican players among the partisans) to avoid excessive correlation.
Across all specifications, the interaction between Political Heterogeneity and the Partisan Conflict Index remains significant and stable around our original estimate, with estimates ranging from approximately 0.08 to 0.10 (p < 0.05).
Nevertheless, to formally address potential selection bias from our coding approach, we implemented two-stage Heckman selection models as shown in columns (5) and (6) in Table A11 in the Online Appendix. The first specification includes basic controls, such as year fixed effects, ideology fixed effects, U.S. player status, and OWGR Score. The second specification adds state fixed effects and peer characteristics. For each model, we generated predicted values to calculate the inverse Mills ratio for each player. The inverse Mills ratios from both specifications are statistically insignificant, suggesting that selection bias does not threaten our results. Moreover, our main effects remain stable across specifications (0.20 strokes, p < 0.001). This robustness aligns with the literature on selection effects, which indicates that selection on independent variables primarily affects standard errors rather than the validity of coefficient estimates.
Imputing Missing Political Affiliation Values
As described in the Data and Variables section, many observations were dropped because we did not have information on the players’ political affiliation. To address this limitation, we implemented a predictive model to estimate players’ likely affiliations based on observable characteristics, such as education, religion, age, and race. Using a logistic regression model trained on U.S. players with known affiliations, we classified players as Republican or Democrat only when the predicted probability exceeded 90% or fell below 10%, respectively. This conservative threshold ensured high confidence in our imputations while acknowledging the uncertainty of political self-identification in professional sports. We also tested different cutoffs (e.g., 80% and 95%) to verify the stability of our results and observed no significant deviations, indicating that our findings are robust to variations in the threshold.
Using these imputed values, we recalculated the political heterogeneity in our sample (column (7) in Table A11 in the Online Appendix). In this expanded data set of 45,492 observations—nearly double our original sample size—the effect of political heterogeneity remains significant at 0.12 strokes (p < 0.01), and its interaction with the Partisan Conflict Index also stays significant (0.068, p < 0.05). The consistency of these results, despite the substantial increase in sample size and the use of imputed values, provides additional support for our main findings.
Discussion
Our study shows significant performance differences between professional golfers in politically homogeneous and heterogeneous groups on the PGA Tour. Specifically, we find a consistent performance gap of 0.2 strokes per round, which translates to a 5.3% lower probability of making the cut and to approximately $13,000–$23,400 in reduced earnings per tournament. This finding supports our prediction that political heterogeneity can impair individual performance, even in a seemingly nonpolitical environment (Swigart et al. 2020). This performance effect nearly disappears (0.02 strokes) during low-polarization periods but more than doubles (0.55 strokes) during high polarization, indicating that broader political contexts influence workplace dynamics (Azzimonti 2018, Swigart et al. 2020). These findings indicate that organizational boundaries are more permeable to societal political dynamics than existing theories suggest, reinforcing that workplace behavior does not operate in isolation from broader ideological tensions.
Our causal identification relies on the random assignment of PGA Tour golfers to groups. To ensure the robustness of our findings, we conducted extensive sensitivity analyses, controlling for various potential confounding variables, such as age, race, religion, education, hobbies, and other individual attributes. Our results remain remarkably stable across these specifications, with even an artificially constructed variable requiring an unrealistic high 55% correlation with political views to nullify the effect. The consistency of our results across these analyses underscores the reliability of the performance effects associated with political heterogeneity.
Our analysis suggests anxiety as the primary mechanism through which political heterogeneity influences performance (Eysenck et al. 2007, Derakshan and Eysenck 2009). This aligns with prior research on the mere presence effect, which shows that simply being around out-group members can heighten stress and impair performance (Zajonc 1965, Bond 1982). Several pieces of empirical evidence support this interpretation. First, political heterogeneity affects accuracy more than distance in driving shots, suggesting a cognitive effect rather than purely physical one. This aligns with research showing that anxiety typically impairs precision while sparing power-based performance (Eysenck et al. 2007).
Second, our performance data show that differences between politically heterogeneous and homogeneous groups arise only during the driving and putting stages when players are in close proximity but not during the off-the-green stage when they are more dispersed. These patterns reinforce the argument that anxiety peaks when players are in each other’s immediate presence, supporting the idea that political differences disrupt performance through heightened stress. This is consistent with social identity theory, which suggests that individuals experience discomfort and reduced cognitive resources when surrounded by perceived out-group members (Tajfel and Turner 1979). This proximity pattern persists even after controlling for various relationship measures, including friendship ties, residential proximity, and prior game history—none of which showed significant effects.
Although proximity-driven anxiety provides the most consistent explanation for our findings, alternative mechanisms—such as overt conflict or active interaction between players—cannot be entirely ruled out. However, the absence of performance differences in low-proximity stages suggests that these alternatives are less likely to drive the observed patterns than the psychological discomfort triggered by mere presence. We address these possibilities further in the Limitations and Future Research section.
These findings align with research demonstrating that anxiety impairs both cognitive and motor performance, particularly in high-pressure settings (Cook et al. 1983, Van der Doef and Maes 1999, Hellström 2009). They also parallel recent work by Ranganathan and Das (2023), which found that female singers in India perform better when recording asynchronously (without the male-dominated orchestra present) than when performing synchronously (surrounded by the orchestra). Interviews with a professional golfer and a golf coach support this mechanism. A retired PGA Tour player explained in the interview: “Players feel more relaxed when they’re with guys they know share their views.”
Scope Conditions and Generalization to Other Settings
Our theory applies best in contexts where three key conditions are met, helping identify organizational settings where political heterogeneity is most likely to impact performance. The first scope condition is that political ideology is a salient social factor. Political ideology, as we discussed at the outset, is becoming more central in societies because of the rise of polarization. Therefore, we believe that this scope condition is met in many settings and contemporary societies. The second scope condition is that individuals must be aware of each other’s political identities, similar to professional golfers who learn about each other’s political views through repeated interactions, social media presence, and general discussions. This awareness typically develops in smaller organizations or close-knit professional communities with regular, long-term interactions, such as regional sales offices, professional service firms (e.g., banks), universities, and government organizations. Emerging research shows that politics is frequently discussed in U.S. workplaces. For example, a 2022 survey by the Society for Human Resource Management reveals that 26% of U.S. workers engage in political discussions with their colleagues (Society for Human Resource Management 2022).
The third scope condition of our theory is that the presence of others must be salient during simultaneous performance. Our findings on proximity effects suggest that this condition is crucial; political differences have the most impact when individuals work in close quarters. This is particularly relevant in settings like open-plan offices where financial professionals work together, collaborative sales environments where representatives work side by side while handling individual accounts, or team spaces where traders interact while managing digital portfolios. Similarly, real estate agencies where agents share common spaces between showings or medical practices where professionals perform individual procedures in shared facilities also meet this condition. In university settings, faculty members who share office spaces or common areas may experience stronger effects than those who work primarily in separate locations. This proximity effect might explain why some organizations observe that political differences have a greater impact in certain departments or physical locations than in others (Swigart et al. 2020). The performance effects are less likely to occur in remote work settings or environments where employees do not work in close proximity. Furthermore, in-person settings are more likely to satisfy the first scope condition; employees who work fully in person are more likely to engage in political discussions with their coworkers (30%) than hybrid workers (24%) and fully remote workers (19%) (Society for Human Resource Management 2022).
The fourth scope condition of our theory is that performance must be measured and rewarded on an individual basis. This condition applies to many professional contexts, including sales organizations measuring quotas, professional services firms tracking billable hours, and financial services firms monitoring portfolio performance. Our findings are less directly applicable in settings that rely primarily on team-based metrics or where individual performance is difficult to measure objectively. This is why our golf setting, with its clear individual performance metrics, serves as an ideal test case for our theory.
Theoretical Contributions
Prior research has examined political heterogeneity’s impact on team outcomes (Shi et al. 2019, Evans et al. 2025), but we show that working alongside politically different peers impairs individual performance through anxiety rather than coordination challenges or communication barriers (van Knippenberg et al. 2004).
The performance effects that we document are amplified during periods of high societal polarization (Azzimonti 2018), illustrating how broader social trends can penetrate organizational boundaries and influence workplace dynamics. Although previous research has shown that political polarization influences economic decisions (McConnell et al. 2018) and team performance (Evans et al. 2025), our study demonstrates how societal-level political tensions modulate individual performance. This finding helps explain why similar levels of political heterogeneity might have different organizational impacts across time periods or societal contexts.
Our clean empirical setting also helps reconcile mixed findings in the diversity literature about when viewpoint differences help or harm performance (Antonio et al. 2004, Duarte et al. 2015). Although diversity can enhance idea generation and planning, our results suggest that it may be detrimental during execution phases where focus and comfort are crucial for performance.
By identifying specific conditions under which political differences most strongly affect workplace outcomes—particularly the roles of physical proximity and societal context—we provide a more nuanced understanding of how political heterogeneity operates in organizations (Swigart et al. 2020, Spenkuch et al. 2023). This framework helps explain why some organizations observe stronger political effects in certain departments or physical locations compared with others.
Although our results highlight the salience of political diversity, other forms of heterogeneity, such as race or nationality, can also create anxiety or tension (Williams and O’Reilly 1998, van Knippenberg and Schippers 2007). Although we do not find systematic effects of these demographic attributes in our sample, we acknowledge that limited variance and lower salience for race or nationality may be at play here, and this does not mean that they cannot trigger similar mechanisms in other settings. It may be that political ideology is especially value laden in the PGA Tour context, overshadowing other identities. Prior research that finds negative effects of race or nationality diversity may have overlooked whether political ideology underlies or amplifies those effects. In many contexts, political views correlate with demographics, such as religion, race, or home country, suggesting that some studies might benefit from explicitly measuring and separating political alignment from demographic differences. Future work could examine whether controlling for political ideology reduces or modifies the effects of demographic heterogeneity.
Practical Implications
Our findings reveal a clear performance cost of political heterogeneity when individuals work closely together during periods of high societal polarization. However, we caution against interpreting our results as advocating a simplistic and permanent policy of political homogeneity. Such an approach would reinforce organizational silos and could unintentionally sacrifice benefits of viewpoint diversity, such as enhanced creativity and innovation. Although this study does not explore strategic solutions for mitigating the costs of political heterogeneity, we suggest that managers adopt flexible, context-specific strategies. These may include temporarily adjusting workspace proximity or enhancing psychological safety during polarized periods. By doing so, organizations could mitigate short-term performance impairments while preserving the broader, long-term advantages of diversity. Because performance impacts arise mainly during close interactions, spatial solutions hold particular promise. For example, sales environments with side-by-side representatives might benefit from strategic seating arrangements, trading floors could implement layouts that maximize personal space while maintaining essential communication channels, and professional service firms could separate individual work zones from shared spaces without compromising necessary collaboration (Swigart et al. 2020). Beyond spatial strategies, which may be impractical or problematic in certain settings, organizations could consider interventions to reduce individual anxiety. Practices cultivating psychological safety, encouraging individuation among coworkers, or offering structured crossperspective dialogue could buffer the negative performance effects of political heterogeneity. Proactively addressing workplace stressors and reinforcing a shared professional identity can counteract performance losses and promote a more inclusive environment.
Changes in the political climate demand flexible management approaches. During elections or periods of heightened societal polarization, organizations may need to enhance inclusion initiatives or modify work arrangements to maintain performance (Bellemare et al. 2010). For instance, investment firms might find that their trading floors require heightened attention during politically charged periods, sometimes necessitating temporary adjustments to physical spacing or additional structural supports. We do not advocate organizational homogeneity; instead, our findings suggest that leaders can mitigate anxiety by carefully structuring workplaces, especially during peak polarization.
Although our research demonstrates clear performance differences between politically homogeneous and heterogeneous groups in certain contexts, organizations should carefully balance these gains against the broader advantages of viewpoint diversity. Rather than defaulting to political clustering, successful organizations design environments and workflows that minimize discomfort while capturing the benefits of diverse perspectives for innovation and long-term adaptability (Corritore et al. 2020). This could mean concentrating diversity in creative and planning phases while providing more individual space during execution-focused work.
Limitations and Future Research
Our study demonstrates that political heterogeneity affects performance and that this effect varies with societal polarization. Although the PGA Tour setting offers several advantages for testing these relationships, including randomized player assignments, high performance incentives, and objectively measurable individual performance, we acknowledge important limitations in definitively establishing all causal pathways. These limitations, which point to valuable directions for future research, warrant careful discussion.
First, although random assignment helps establish causality, we cannot definitively rule out the possibility that unobserved variables correlated with political views may influence our results (Angrist 2014, Bramoullé et al. 2020). To minimize this possibility, we collected additional data on golfers’ religion, education, interests, and other attributes, finding that our results remain robust when controlling for these factors. Our sensitivity analysis suggests that any unobserved variable would need to correlate with political heterogeneity at unrealistically high levels (55% or higher) to nullify our findings. Nevertheless, future research should explore additional individual characteristics that might correlate with political views and impact performance.
Second, our measure of political attitudes has two key limitations. We identified political affiliations for only about 42% of players. Although selection analyses suggest limited bias from incomplete coverage, future research would benefit from more comprehensive data. Additionally, we limited our study to a simplified Democrat versus Republican polarization measure, missing more nuanced political views highlighted by prior research (Bonomi et al. 2021). Future studies could examine how these additional dimensions of political ideology shape workplace interactions.
Third, although our results suggest that anxiety reduction is the primary mechanism through which political homogeneity affects performance, we cannot directly observe this mechanism. Our evidence—including the proximity effect found in the DataGolf analysis and insights from interviews—supports this interpretation, but we cannot definitively rule out that active interactions between players, rather than mere presence alone, drive some of these effects. Although players typically maintain silence during shots, they may engage in conversation between holes or while walking the course. These direct interactions with politically different others could create additional tension beyond the anxiety from mere presence. Future research could utilize more direct measures of anxiety and stress in workplace settings (Eysenck et al. 2007). Laboratory studies with detailed physiological or psychological measurements could further elucidate the precise mechanisms at play and help distinguish between the effects of mere presence versus active interaction.
Fourth, our study focuses on political polarization in the United States, which may limit its generalizability to countries with different political structures. Future research should explore the effects of political heterogeneity in societies with other types of political divisions (Esteban et al. 2012a, Arbatli et al. 2020).
Fifth, although our analyses provide strong evidence that our findings are not driven by selection biases or time trends, we acknowledge that Hypothesis 2 does not benefit from the same level of causal identification as Hypothesis 1. Because polarization levels are not randomly assigned, we cannot completely rule out the possibility that unobserved factors correlated with polarization are influencing our results. However, the fact that our findings remain stable across multiple methods, including subsetting, year fixed effects, and matching, suggests that the widening performance gap in polarized periods is not an artifact of selection trends and is likely to reflect a true underlying relationship.
Finally, although we find that political homogeneity benefits individual performance in execution-focused tasks, future research should investigate its effects in other types of work. For example, political heterogeneity might enhance performance in tasks requiring creative problem-solving or diverse perspective taking (Corritore et al. 2020). Understanding these contingencies could help organizations better manage the trade-offs between the comfort benefits of homogeneity and the potential advantages of diversity. Additionally, we call for future research on effective strategies for organizations and managers, such as spatial solutions, efforts to reduce individual anxiety, and the cultivation of psychological safety, to mitigate the negative effects of political heterogeneity on individual performance, particularly during periods of high polarization.
Conclusion
Our study reveals how political differences among peers can affect individual performance, even in settings where politics seems unrelated to the task. The finding that political heterogeneity impairs performance primarily when individuals work in close proximity—and especially during periods of high societal polarization—has important implications for understanding workplace dynamics. Organizations face a complex challenge: balancing the performance benefits of political homogeneity in certain contexts with the broader advantages of viewpoint diversity and workplace inclusion. Solving this challenge requires nuanced approaches rather than simplistic solutions. Future research building on these findings will be especially valuable as workplaces worldwide navigate increasing political polarization and its implications for employee interactions and performance.
The authors are grateful for feedback on earlier versions of the manuscript by Jen Dannals, Gregory Huber, Iris Wang, Dennis Jacobsen, Gábor Békés, Abishek Nagaraj, Glenn Carroll, Taylor Holdaway, Doris Kwon, Uri Zak, Emily Erikson, Gael Le Mens, Alex Tyulyupo, Katja Görlitz, Natalia Danzer, Jan Marcus, and Anja Krisch. The authors benefited from feedback during presentations at Yale University and the Research in Economics Using Sports Data Conference at Central European University. The authors used generative artificial intelligence tools (Claude and ChatGPT) for language editing. The authors also appreciate the time that the golfers and coaches spent interviewing with them. The authors are especially grateful to Kurt W. Rotthoff and Todd McFall for providing additional information on groupings from 2004 to 2013 based on tee times from ShotLink data. The authors also thank Department Editor Sameer Srivastava and the anonymous associate editor and reviewers for their constructive feedback.
1 In additional analyses, we verified that group size is not related to players’ race, nationality, or gender. Results remain robust when analyzing only three-player groups (Table A1 in the Online Appendix).
2 Further analysis shows no relationship between group political heterogeneity and withdrawals/disqualifications in these initial rounds.
3 Our data set excludes a few tournaments for which data are not available through the PGA or other golf data providers; in particular, the years 1997–2001 are incomplete.
4 We excluded team events to focus exclusively on individual performance. Stableford tournaments use a different scoring system and therefore, offer different incentives (e.g., more aggressive play). The FedEx Cup differs from other tournaments because it consists of different tournaments (playoffs), and the players start with different prerequisites (points). We also excluded Match Play events because players often do not complete the 18 holes, making the recorded scores less accurate.
5 We focused on these more well-known players because locating individuals in the L2 data requires knowing identifiers, such as the exact name (including middle names), birth date, and at least the state of residence.
6 We note that whether we subtract the course’s par value from the actual performance score or not does not really affect our results given that all of our models include tournament fixed effects. The only cases where this makes a difference are when a tournament in a given year takes place on multiple courses with varying par values, such as the AT&T Pebble Beach Pro-Am, which uses Pebble Beach (par 72), Spyglass Hill (par 72), and Monterey Peninsula (par 71). Consequently, our model estimates remain very similar in both setups. We retained the “par” setup and terminology because this is how golfers typically discuss performance.
7 In alternative models not shown, we tested election-related specifications, including an election year dummy and Google Trends data for “elections,” which confirmed our results presented later. We chose the Partisan Conflict Index because of its continuous nature and longer time series (Google Trends data are only available from 2004). Azzimonti (2014) shows the index increases significantly in presidential election years and spikes sharply during both presidential and midterm election months.
8 There is a separate tournament series for female golfers named the Ladies Professional Golf Association.
9 Approximately one third of the players in our sample are non-U.S. born, representing about 22% of the player-round observations, and they are not included in the L2 data. An additional 2% of players are non-U.S. born but have become U.S. citizens, accounting for 2% of the performance observations.
10 The distribution of tournaments played by each player is highly skewed (see Figure A5 in the Online Appendix). Brian Gay participated in the most tournaments, with 414 appearances, whereas Tiger Woods, for instance, competed in 168 tournaments. In our database, 971 players played only one tournament, 370 players played two tournaments, 168 players played three tournaments, and 100 players played four tournaments.
11 Given the labor-intensive process of collecting political data and the scarcity of available political information on lesser-known players, including missing identifiers such as birth date, full name, and state of residence, it is especially challenging to locate these golfers in the L2 voter registration data.
12 Articles with anonymous polls make the ratio of about 80% Republican golfers in our sample realistic (GolfDigest 2012, Golf 2016, The Versed 2016, Off the Ball 2021).
13 Given that the performance-tier data used by the PGA Tour are not available publicly (we only know that they use four tiers based on prior performance), in these randomization models, we allocated players into four equal-sized tiers based on their OWGR Score.
14 This potential multicollinearity may inflate standard errors but does not affect causal inference if estimates remain statistically significant.
15 In Table A1 in the Online Appendix, we demonstrate that when Nationality Heterogeneity is used instead of Language Heterogeneity, the results remain robust.
16 In Table A2 in the Online Appendix, we tested alternative measures of racial heterogeneity, including racial shares; unique race counts; the Herfindahl Index; and indicators for Tiger Woods, Vijay Singh, or Jason Day. No significant race effects emerged, and the main results remained robust.
17 Table A3 in the Online Appendix shows that results remain consistent when assigning different scores (e.g., 0.5 instead of 0) to golfers outside the OWGR ranking.
References
American National Election Studies (2023) The ANES guide to public opinion and electoral behavior: Affective polarization of ideologues: In-group and out-group feelings. Accessed April 8, 2023, https://electionstudies.org/data-tools/anes-guide/anes-guide.html?chart=affective_polarization_idelogues.Google Scholar- (2021) Does political diversity predict organizational dissatisfaction? Salience of presidential elections. Acad. Management Proc. 2021(1):12171.Crossref, Google Scholar
- (2014) The perils of peer effects. Labour Econom. 30:98–108.Crossref, Google Scholar
- (2004) Effects of racial diversity on complex thinking in college students. Psych. Sci. 15(8):507–510.Crossref, Google Scholar
- (2020) Diversity and conflict. Econometrica 88(2):727–797.Crossref, Google Scholar
- (1963) Competition and dissensus: Two types of conflict and of conflict resolution. Conflict Resolution 7(1):26–42.Crossref, Google Scholar
- (2014) Partisan conflict. Working Paper No. 14-19, Research Department, Federal Reserve Bank of Philadelphia, Philadelphia.Google Scholar
- (2018) Partisan conflict and private investment. J. Monetary Econom. 93:114–131.Crossref, Google Scholar
- (2009) Social connections and incentives in the workplace: Evidence from personnel data. Econometrica 77(4):1047–1094.Crossref, Google Scholar
- (1995) The need to belong: Desire for interpersonal attachments as a fundamental human motivation. Psych. Bull. 117(2):497–529.Crossref, Google Scholar
- (1986) A review of paradoxical performance effects: Choking under pressure in sports and mental tests. Eur. J. Soc. Psych. 16(4):361–383.Crossref, Google Scholar
- (2019) Unity in diversity? How intergroup contact can foster nation building. Amer. Econom. Rev. 109(11):3978–4025.Crossref, Google Scholar
- (2010) Peer pressure, incentives, and gender: An experimental analysis of motivation in the workplace. Labour Econom. 17(1):276–283.Crossref, Google Scholar
- (1973) Social categorization and similarity in intergroup behaviour. Eur. J. Soc. Psych. 3(1):27–52.Crossref, Google Scholar
- (1982) Social facilitation: A self-presentational view. J. Personality Soc. Psych. 42(6):1042–1050.Crossref, Google Scholar
- (2021) Identity, beliefs, and political conflict. Quart. J. Econom. 136(4):2371–2411.Crossref, Google Scholar
- (2020) Peer effects in networks: A survey. Annual Rev. Econom. 12:603–629.Crossref, Google Scholar
- (1999) The psychology of prejudice: Ingroup love or outgroup hate? J. Soc. Issues 55(3):429–444.Crossref, Google Scholar
- (2007) The importance of being we: Human nature and intergroup relations. Amer. Psych. 62(8):728–738.Crossref, Google Scholar
- (2005) Community matters: Realistic group conflict theory and the impact of diversity. Acad. Management J. 48(5):830–844.Crossref, Google Scholar
- (2013) Are the Official World Golf Rankings biased? J. Quant. Anal. Sports 9(2):127–140.Google Scholar
- (1971) The Attraction Paradigm (Academic Press, New York).Google Scholar
- (2013) The costs of ambient cultural disharmony: Indirect intercultural conflicts in social environment undermine creativity. Acad. Management J. 56(6):1545–1577.Crossref, Google Scholar
- (1983) Relationship among competitive state anxiety, ability, and golf performance. J. Sport Psych. 5(4):460–465.Crossref, Google Scholar
- (2020) Duality in diversity: How intrapersonal and interpersonal cultural heterogeneity relate to firm performance. Admin. Sci. Quart. 65(2):359–394.Crossref, Google Scholar
- (1990) Flow: The Psychology of Optimal Experience (Harper & Row, New York).Google Scholar
DataGolf (2024). Accessed January 25, 2025, https://datagolf.com/.Google Scholar- (2009) Anxiety, processing efficiency, and cognitive performance: New developments from attentional control theory. Eur. Psych. 14(2):168–176.Crossref, Google Scholar
- (2015) Political diversity will improve social psychological science. Behav. Brain Sci. 38:e130.Crossref, Google Scholar
- (2022) What does homophily do? A review of the consequences of homophily. Acad. Management Ann. 16(1):38–69.Crossref, Google Scholar
- (2012a) Ethnicity and conflict: An empirical study. Amer. Econom. Rev. 102(4):1310–1342.Crossref, Google Scholar
- (2012b) Ethnicity and conflict: Theory and facts. Science 336(6083):858–865.Crossref, Google Scholar
- (2025) Identity, diversity, and team performance: Evidence from U.S. mutual funds. Management Sci. 71(4):3026–3051.Link, Google Scholar
- (2007) Anxiety and cognitive performance: Attentional control theory. Emotion 7(2):336–353.Crossref, Google Scholar
Federal Reserve Bank of Philadelphia (2023) Partisan conflict index. Accessed January 25, 2025, https://www.philadelphiafed.org/surveys-and-data/macroeconomic-data/partisan-conflict-index.Google Scholar- (1995) A Good Walk Spoiled: Days and Nights on the PGA Tour (Little, Brown and Company, Boston).Google Scholar
- (2012) Psyched up or psyched out? The influence of coactor status on individual performance. Organ. Sci. 23(2):402–415.Link, Google Scholar
- (2020) Quoted in a 2020 interview. Accessed May 12, 2023, https://web.archive.org/web/20201010011214/https://www.health.com/condition/stress/election-stress-disorder.Google Scholar
- (2015) Does politics influence hiring? Evidence from a randomized experiment. Political Behav. 37(3):653–675.Crossref, Google Scholar
Golf (2016) SI anonymous player poll: PGA, champions, LPGA pros sound off. Accessed February 25, 2023, https://golf.com/news/si-anonymous-player-poll-pga-champions-lpga-pros-sound-off/.Google ScholarGolfDigest (2012) When it comes to politics, most tour players lean right. Accessed April 8, 2023, https://www.golfdigest.com/story/when-it-comes-to-politics-most-tour-players-lean-right.Google Scholar- (2002) Partisan Hearts and Minds: Political Parties and the Social Identities of Voters (Yale University Press, New Haven, CT).Google Scholar
- (2017)
Conflict in teams . Salas E, Rico R, Passmore J, eds. The Wiley Blackwell Handbook of the Psychology of Team Working and Collaborative Processes, 1st ed. (John Wiley & Sons, New York), 317–344.Crossref, Google Scholar - (2009a) Peer effects in the workplace: Evidence from random groupings in professional golf tournaments. Amer. Econom. J. Appl. Econom. 1(4):34–68.Crossref, Google Scholar
- (2009b) Replication data for: Peer effects in the workplace: Evidence from random groupings in professional golf tournaments. American Economic Association Data Archive (October 12), https://doi.org/10.3886/E113575V1.Google Scholar
- (2020) Creating mutual gains to leverage a racially diverse workforce: The effects of firm-level racial diversity on financial and workforce outcomes under the use of broad-based stock options. Organ. Sci. 31(6):1515–1537.Link, Google Scholar
- (2009) Psychological hallmarks of skilled golfers. Sports Medicine 39(10):845–855.Crossref, Google Scholar
- (2018) Peer effects in a competitive environment: Evidence from the PGA Tour. Econom. Inquiry 56(1):208–225.Crossref, Google Scholar
- (2014) Ethnic divisions and production in firms. Quart. J. Econom. 129(4):1899–1946.Crossref, Google Scholar
- (2000) Social identity and self-categorization processes in organizational contexts. Acad. Management Rev. 25(1):121–140.Crossref, Google Scholar
- (2017) Political homophily in social relationships: Evidence from online dating behavior. J. Politics 79(1):269–283.Crossref, Google Scholar
- (2012) Affect, not ideology: A social identity perspective on polarization. Public Opinion Quart. 76(3):405–431.Crossref, Google Scholar
- (2019) The origins and consequences of affective polarization in the United States. Annual Rev. Political Sci. 22:129–146.Crossref, Google Scholar
- (2013) The effects of coworker heterogeneity on form-level output: Assessing the impacts of cultural and language diversity in the National Hockey League. Rev. Econom. Statist. 95(1):302–314.Crossref, Google Scholar
- (2012) The psychic cost of doing wrong: Ethical conflict, divestiture socialization, and emotional exhaustion. J. Management 38(3):784–808.Google Scholar
- (2021) How ideological diversity within top management teams influences strategic dynamism. Acad. Management Proc. 2021(1):14225.Crossref, Google Scholar
- (2013) Corporate boards’ political ideology diversity and firm performance. J. Empirical Finance 21:223–240.Crossref, Google Scholar
- (2019) Theories of conflict and war. J. Econom. Behav. Organ. 159:384–387.Crossref, Google Scholar
- (2011) Why organizational and community diversity matter: Representativeness and the emergence of incivility and organizational performance. Acad. Management J. 54(6):1103–1118.Crossref, Google Scholar
- (2014) Birds of a feather: Value implications of political alignment between top management and directors. J. Financial Econom. 112(2):232–250.Crossref, Google Scholar
- (2017) A status-based multilevel model of ethnic diversity and work unit performance. J. Management 43(2):426–454.Crossref, Google Scholar
- (2017) Team production in international labor markets: Experimental evidence from the field. Amer. Econom. J. Appl. Econom. 9(3):70–104.Crossref, Google Scholar
- (2003) Editor’s comments: Conflict and conflict resolution—A return to theorizing. Acad. Management Rev. 28(4):543–546.Crossref, Google Scholar
- (2018) The economic consequences of partisanship in a polarized era. Amer. J. Political Sci. 62(1):5–18.Crossref, Google Scholar
- (2004) Surface- and deep-level diversity in workgroups: Examining the moderating effects of team orientation and team process on relationship conflict. J. Organ. Behav. 25(8):1015–1039.Crossref, Google Scholar
- (1990) An illustration of a pitfall in estimating the effects of aggregate variables on micro units. Rev. Econom. Statist. 72(2):334–338.Crossref, Google Scholar
- (2006) The workplace as a context for cross-cutting political discourse. J. Politics 68(1):140–155.Crossref, Google Scholar
- (2021) From attention to action: The influence of cognitive and ideological diversity in top management teams on business model innovation. J. Management Stud. 58(8):2082–2110.Crossref, Google Scholar
- (1987)
The salience of social categories . Turner JC, Hogg MA, Oakes PJ, Reicher SD, Wetherell MS, eds. Rediscovering the Social Group: A Self-Categorization Theory (Blackwell, Oxford, UK), 117–141.Google Scholar Off the Ball (2021) “Trump is them and they are him.” Donald Trump’s relationships with PGA Tour golfers. Accessed February 25, 2023, https://www.offtheball.com/golf/trump-toxic-pga-tour-golfers-1133425.Google ScholarOfficial World Golf Ranking (2024). Accessed January 25, 2025, https://www.owgr.com/.Google Scholar- (2020) The board of directors and CSR: How does ideological diversity on the board impact CSR? J. Cleaner Prod. 251:119789.Crossref, Google Scholar
- (2020) A network conceptualization of team conflict. Acad. Management Rev. 45(2):352–375.Crossref, Google Scholar
- (2024) People believe political opponents accept blatant moral wrongs, fueling partisan divides. PNAS Nexus 3(7):pgae244.Crossref, Google Scholar
- (2023) Marching to her own beat: Asynchronous teamwork and gender differences in performance on creative projects. Amer. Sociol. Rev. 88(5):901–937.Crossref, Google Scholar
- (2020) When two tribes go to work: Board political diversity and firm performance. Sci. Adv. 63:1–25.Google Scholar
- (2019) The impact of ideological diversity on educational performance: A pilot study. Working paper, Princeton University, Princeton, NJ.Google Scholar
- (2003) Converging evidence that stereotype threat reduces working memory capacity. J. Personality Soc. Psych. 85(3):440–452.Crossref, Google Scholar
- (2017) Conflict and the persistence of ethnic bias. Amer. Econom. J. Appl. Econom. 9(4):137–165.Crossref, Google Scholar
- (2019) The wisdom of polarized crowds. Nature Human Behav. 3(4):329–336.Crossref, Google Scholar
Society for Human Resource Management (2022) SHRM study reveals 20% of workers mistreated due to political views. Accessed January 25, 2025, https://www.shrm.org/about/press-room/shrm-study-reveals-20-workers-mistreated-due-to-political-views.Google Scholar- (2023) Ideology and performance in public organizations. Econometrica 91(4):1171–1203.Crossref, Google Scholar
- (2017) He once called it “election stress disorder.” Now the therapist says we’re suffering from this. Washington Post (February 6), https://www.washingtonpost.com/news/inspired-life/wp/2017/02/06/suffering-from-headline-stress-disorder-since-trumps-win-youre-definitely-not-alone/.Google Scholar
- (2020) Working while liberal/conservative: A review of political ideology in organizations. J. Management 46(6):1063–1091.Crossref, Google Scholar
- (1979)
An integrative theory of intergroup conflict . Austin WG, Worchel S, eds. The Social Psychology of Intergroup Relations (Brooks/Cole, Monterey, CA), 33–47.Google Scholar The Versed (2016) I find it strange that one of golf’s most liberally-minded players is a Republican. Accessed February 25, 2023, https://web.archive.org/web/20201024171918/https://www.theversed.com/62519/i-find-it-strange-that-one-of-golfs-most-liberally-minded-player-is-a-republican/#.lRLtRLyBaP.Google Scholar- (1987) Rediscovering the Social Group: A Self-Categorization Theory (Blackwell, Oxford, UK).Google Scholar
- (1999) The job demand-control (-support) model and psychological well-being: A review of 20 years of empirical research. Work Stress 13(2):87–114.Crossref, Google Scholar
- (2007) Work group diversity. Annual Rev. Psych. 58:515–541.Crossref, Google Scholar
- (2004) Work group diversity and group performance: An integrative model and research agenda. J. Appl. Psych. 89(6):1008–1022.Crossref, Google Scholar
Voteview (2023). Accessed April 8, 2023, https://voteview.com.Google Scholar- (2015) Perceiving political polarization in the United States: Party identity strength and attitude extremity exacerbate the perceived partisan divide. Perspectives Psych. Sci. 10(2):145–158.Crossref, Google Scholar
- (1998) Demography and diversity in organizations: A review of 40 years of research. Res. Organ. Behav. 20:77–140.Google Scholar
- (1965) Social facilitation. Science 149(3681):269–274.Crossref, Google Scholar
- (2022) Political coherence and certainty as drivers of interpersonal liking over and above similarity. Sci. Adv. 8(6):1–14.Crossref, Google Scholar

