
Data-Driven at Sea: Forecasting and Revenue Management at Molslinjen
Abstract
Molslinjen, one of the world’s largest operators of fast-moving catamaran ferries, based in Denmark, adopted a focus on digitalization to profoundly change its operations and business practices. Molslinjen partnered with Halfspace, a data, analytics, and artificial intelligence (AI) company based in Copenhagen, Denmark, to support that transition. Halfspace and Molslinjen jointly developed and deployed a successful forecasting and revenue management toolbox for the data-driven operation of ferries in Denmark since 2020. This has resulted in $2.6–3.2 million yearly savings (and a total of $5 million savings as of December 2023), a significant reduction in the number of delayed departures and average delays, and a 3% reduction in fuel costs and emissions. This toolbox relies on some of the latest advances in machine learning for forecasting and in analytics approaches to revenue management. The potential for generalizing our toolbox to the global ferry industry is significant, with an impact on both revenues and environmental, societal, and governance criteria.
Introduction
Transportation has always been a key application area within operations research and management science, as exemplified by the recent review paper of Petropoulos et al. (2024). In principle, though, when referring to transportation, one mainly thinks of routing, assignment, and scheduling problems. Most importantly, emphasis is most often placed on road and air transportation, and passenger trains and freight, to a lesser extent. Obviously, there are also many maritime applications; examples include applications related to optimal network design (Christiansen et al. 2020), bin-packing (Trivella and Pisinger 2016), and stowage planning (van Twiller et al. 2024), for shipping companies like Maersk and Hapag-Lloyd. In contrast, the body of work related to optimal management and operations of passenger ferries is much more limited.
In many countries with islands (e.g., Greece and Denmark), and geographical areas easily connected through maritime transport (e.g., Scandinavia and Southeast Asia), passenger ferries are deemed a practical and economical solution. They are also an enjoyable travel experience, as supported by numerous traveller and customer satisfaction surveys around the world. The passenger ferry market size was valued between $12 and $15 billion at the end of 2023, with a number of passengers similar to that of the airline industry (i.e., between four and five billion passengers per year). That market is expected to grow substantially in the coming decade. Passenger ferry operators are embracing the change toward more sustainable and efficient operations, by rethinking their fleet, their routes, and their approach to operations. Some recent and representative examples are the development of models to predict fuel consumption based on contextual variables, the control of autonomous ships, as well as online booking systems.
Operating ferries involves many decision-making tasks, including scheduling and routing, vehicle packing (also referred to as loading), staff planning, and procurement. These tasks are traditionally and still commonly addressed based on experience, expert knowledge, and pragmatic decision making. However, with the increasing availability of data and the process of digitalization in many areas of our industries and societies, passenger ferry operators also have the opportunity to rethink their operational practice. The pace has been slow compared with other industries, because of its specifics (e.g., very localized and highly regulated); Wergeland (2013) provides an overview. Molslinjen, a leading passenger ferry operator based in Denmark, decided to engage in that digitalization process in the late 2010s by partnering with Halfspace, a Denmark-based company focusing on data, analytics, and artificial intelligence (AI) solutions. In the case of Molslinjen, AI-based solutions for both forecasting and dynamic pricing approaches were developed, through state-of-the-art machine learning methods and algorithms. The objective of this paper is to introduce and describe the development and result of this partnership, which consists in practical analytics solutions, for forecasting passenger demand (number and types) as input to packing and other decision-making processes, as well as revenue management and dynamic pricing. Beyond these tools, this partnership has had a broader and profound impact on Molslinjen, which has now become a front-runner in the digitalization of the passenger ferry business worldwide. Molslinjen has seen positive impacts on revenue and environmental, social, and governance (ESG) criteria like emissions, as well as change management, in the organization.
Digitalizing Passenger Ferry Operations
To set the scene, we introduce the role of Molslinjen as a passenger ferry operator in Denmark, its operational challenges, as well as the way it has engaged with the digitalization of operations since 2019. Emphasis is placed on describing the status quo prior to the developments covered in the remainder of the paper. We also present some specifics of vehicle packing for passenger ferries.
Passenger Ferries in the Danish Context
Molslinjen (www.molslinjen.com) is one of the world’s largest operators of fast-moving catamaran ferries, serving nine routes in Denmark, with the main route crossing Kattegat to connect Western and Eastern Denmark. These ferries can transport up to 1,200 passengers and 400 vehicles, at speeds of up to 70 kilometers per hour (km/h), when fully loaded. Denmark is a relatively small country in Scandinavia with approximately 1,400 islands, 70 of which are populated. Ferries are the most convenient method of moving people and goods between the mainland and islands, or between islands. Molslinjen provides this transportation service on a commercial basis, though under regulatory constraints, while also aiming to reduce its environmental footprint.
The strategic partnership with Halfspace was launched in 2019, initially with a focus on optimizing the loading plans for the ferries, at each departure, to drive efficient operations. It quickly became clear that building a state-of-the-art forecasting engine was necessary to provide input to the packing optimization algorithm. Previously, all forecasts and operational decisions were based on expert knowledge and heuristics only. The basic quantities to be predicted consisted of both the expected vehicle count and the mix of vehicles (e.g., bikes, cars, trucks). Such forecasts were produced up to a year in advance (of a given ferry departure), and then updated at regular intervals up to the actual packing of the ferry at departure time. In 2021, when Molslinjen was acquired by EQT Partners, a revenue management system was added with a focus on dynamic pricing. The aim of the revenue management approach was to bring additional flexibility to the pricing strategy and to better accommodate the various categories of clients (i.e., business, standard, and low-fare customers).
The initial contact between Molslinjen and Halfspace occurred after the launch of a new website and of a dedicated application for bookings. Digitalization was focused initially solely on the user interface/user experience (UI/UX), and not on operations. Both the CCO and CEO of Molslinjen at the time came from the airline industry (Scandinavian Airlines (SAS)). They had witnessed how revenue management had changed the industry in the 1990s. The CCO had a vision that Molslinjen should make good use of all data it was collecting and should become a digital champion in the passenger ferry industry. This was the start of a fruitful collaboration between Molslinjen and Halfspace, and the subsequent development and deployment of an optimal packing algorithm, a forecasting engine, and a revenue management platform.
Operational Challenges in Passenger Ferry Operations
A passenger ferry company needs to make strategic planning decisions about the routes to serve, the ferries to be built or purchased, and the timing for departures. These planning decisions are crucial to its business, and are made under deep uncertainty; however, these are not the type of decisions we focus on here. We concentrate on operational decisions instead. These decisions mainly relate to the demand (in terms of the number of passengers and of vehicles) to be accommodated under capacity constraints. The demand varies significantly throughout the year, with seasonality, special event (e.g., holiday), and weather effects. Such variations differ in terms of magnitude (i.e., the overall number of passengers and vehicles), but also in terms of the type of vehicles. Some departures involve many vans and trucks, whereas other departures may involve small cars only. This is important because all these vehicles will be packed into the cargo area. Packing these vehicles rapidly and efficiently might be the most significant, and recurrent, operational challenge faced by a passenger ferry operator like Molslinjen. It is like playing a life-size game of Tetris under time pressure.
Passenger ferries operate continuously during the daytime (with up to 20–30 departures per day for the main routes), every day of the year. This translates to a schedule with back-to-back departures, and with very limited time between arrival at the harbour and the next departure—typically between 20 and 30 minutes. During that period, all passengers have to disembark and all the vehicles have to leave the ferry. All incoming vehicles then have to drive onto the cargo area of the ferry and be packed following the chosen packing plan, while passengers and pedestrians board the ferry. If a departure is delayed, this delay will most likely affect all subsequent departures that day. This will force the ferry captain to try to catch up by increasing speed and therefore fuel consumption and related emissions. The consequences are both economical (higher operating costs due to increased fuel consumption) and environmental (increased fuel consumption yields additional emissions).
Let us describe the packing problem in more detail. Passenger ferries are built for a specific capacity, both in terms of passengers and of vehicles onboard. However, in reality, the vehicle capacity is not measured in terms of number of vehicles, but in terms of the space they use in the cargo area. The vehicle deck is divided by two rows of pillars, leaving a three-row section in which to pack the vehicles. Because this area is divided into lanes, the vehicle capacity is then expressed in lane meters. When the ferry is not close to capacity, vehicles are packed beside each other, in a “2-by-2” configuration (see Figure 1(a)). However, if there are many vehicles to pack, it may be necessary to pack them as tightly as possible. This so-called “zipper” configuration, although allowing more vehicles onboard, requires more time for packing, because all vehicles have to be guided precisely to be positioned a few centimeters from each other. A fully loaded ferry uses the zipper configuration on all sections in the ferry (see Figure 1(b)). There are additional considerations related to the spatial weight distribution, which may affect the balance and buoyancy of the ferry, and resulting fuel consumption.
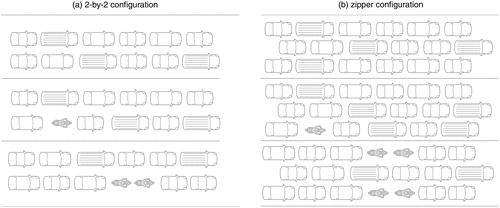
Note. The zipper configuration allows for nearly 50% more vehicles to be packed in the cargo area of the passenger ferries.
The Changes Digitalization Brings
Before Molslinjen engaged in the digitalization process, all operations were based on expert knowledge and simple, yet proven, heuristics. For instance, to estimate the number of upcoming vehicles for the next target departure, the tool would use a rough estimate based on historical statistics, with some expert-based adjustments. The packing process relied on the expert knowledge of the staff members responsible for packing. This required radio-based communication during the process, and also led to on-the-fly corrections. For example, vehicles may have been packed too tightly, or the spatial weight distribution may have needed to be adjusted. Additionally, heavy vehicles must be packed in the front and middle parts of the cargo area, in order to minimize additional fuel consumption and to more evenly divide weight across the loading space. All these factors resulted in potential time delays, additional stress for the staff members involved, and in extreme cases, declined boarding for some vehicles. The quality of service and customer experience was affected.
The first step in digitizing the packing process was for the staff to be able to visualise in advance the portfolio of vehicles that were expected, as well as the alternative options for the packing plan. They eventually were given recommendations for optimal packing for each departure. They would then know whether the ferry would have to be packed following a plan that is loose (i.e., which requires adequate spatial weight distribution), normal, tight, or extremely tight; tight or extremely tight plans use a zipper configuration in one or more lanes. A side benefit of the tool was an increased consistency in the packing process because it was based on recommendations instead of expert knowledge only. This resulted in higher quality of service and increased customer satisfaction.
The optimal packing algorithm and related tools (e.g., visualisations and recommendations) were the first solution developed. This was followed by the development of the forecasting engine, which has been operational since 2020, and of the revenue management system, which was rolled out in 2022.
Forecasting for Bookings and Arrivals
One of the key challenges for Molslinjen is to predict demand, in terms of (1) number of passengers and (2) number of vehicles of different types. Forecasts are needed at different lead times and as input to various types of decision problems, from planning and staffing to packing of vehicles in the cargo area. In addition to these operational problems, forecasts are also used for marketing and sales in order to manage advertising campaigns in a timely and efficient manner.
We first describe the forecasting setup, as well as the data and the pipeline used to produce operational forecasts. We then explain the forecasting methodology, as well as aspects related to estimation, reestimation, and forecast verification. Finally, we give an overview of the outcome, both in terms of the capabilities of the forecasting platform and of actual forecast quality.
Decision-Making Context
Molslinjen has to make decisions at different time scales and for different purposes. Because we restrict ourselves to operational problems only, all decision-making processes are to be understood as conditional to a fixed set of ferries and open routes in the area served by Molslinjen.
The forecasting and decision-making context for passenger ferry operations differs from that of other applications. Typically, we see forecasts being issued iteratively, with the forecast horizon sliding accordingly. Weather forecasts are an example. A forecast is issued on a given day at a given time (e.g., March 1 at 6 a.m.) with hourly resolution for the following 72 hours. At the next forecast update, the following day for instance (e.g., March 2 at 6 a.m.), the forecast window is still 72 hours, but has slid by 24 hours. In contrast, our approach to forecasting focuses on a given event of interest (i.e., a ferry departure on a given date and time—for example, April 15 at 9:30 a.m.), which is fixed. Our objective is to predict its characteristics at different points in time prior to that event.
At present, these points in time are (1) more than one month (and up to a year) in advance, (2) one month in advance, (3) seven days in advance, and (4) one hour in advance. Note that these are representative times only, because the forecasts are continuously updated until immediately before ferry departure.
The first longer-term predictions (more than one month in advance) are there to give an initial estimate of a departure’s demand based purely on historical data. Such historical data include numbers of passengers, vehicles, and vehicle types for each departure. This initial forecast is static and relies on long-term statistics only. Its main purpose is to inform the process of planning the number of daily departures on a given route (e.g., between 12 and 14 on the Odden-Aarhus link, the main route operated by Molslinjen).
In parallel, the iteratively updated predictions (from one month in advance to a few hours in advance) inform both operational and revenue-focused decision processes. The main driver for these iterative updates is the continuous recording of reservations (and of their specifics). It serves as an early warning system for departures that are performing unconventionally, potentially weeks in advance, based on reservation patterns. Unconventional performance is defined based on significant deviations between recorded reservations and expectations (based on long-term statistics) for given departures. As a general indication for the timeline of reservations, in 2023 12% of reservations were made 30 days in advance, 46% were made the prior week, and 7% were made in the final hour prior to departure.
During that period prior to target departure, examples of decisions that must be made based on these forecasts include the following:
Number of crew onboard must be determined, such that the projected number of passengers can be safely transported. Changing the planned crew within the final week of a departure can be especially costly;
A pricing strategy is defined early in the process (i.e., nearly a year in advance), but overperforming or underperforming departures may require changes to ensure they are optimal for the business;
Capacity must be reserved on each departure for business-class customers, who do not need to book in advance. If a business-relevant departure, such as early weekday mornings, exhibits increased interest from nonbusiness customers, it has to be monitored to ensure obligations to business customers are fulfilled.
Eventually, the so-called “real-time” predictions primarily inform operational crews. For the final hour prior to departure, the forecasts inform those who are managing the packing of the ferry and the staff onboard about expected vehicle arrival times and the number of vehicles that might arrive late. The one-hour mark is especially important for decision making, because this is the time at which the operational manager has to determine the ferry packing strategy. Because very few vehicles are expected to arrive one hour prior to the departure (most vehicles arrive between 15 and 60 minutes prior to departure), the decision is fully based on the forecast. If the ferry is in high demand, the operational manager must spend additional time to ensure that each vehicle is loaded as efficiently as possible (following the zipper configuration), and changing this strategy midway through is difficult.
In addition to the operational manager, the hands-on-deck crew on the dock directing traffic to the ferry team in charge of packing require an understanding of the process so that both teams coordinate well with each other. In that respect, business customers are especially important, because we have to adjust our prediction within the final hour, so that the loading crew knows whether all business customers have arrived. If we expect business customers to arrive at the last minute, the ferry crew must ensure that they can still receive their benefits, such as being able to arrive only five minutes prior to departure, and being loaded in a way that allows them to disembark quickly.
An overview of the forecasting philosophy, timeline, and types of decisions is depicted in Figure 2.
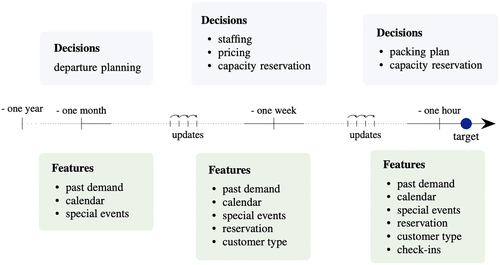
Note. The information about past demand and reservations becomes more abundant as the target departure time nears.
Data: Explanatory and Target Variables
To illustrate the characteristics of demand for Molslinjen passenger ferries, let us look at the data from 2023. Over that year, forecasts were produced for different routes in Denmark, for a total of 8,675 departures. Taking the example of the departure port of Odden in Sjællands Odde (Zealand), Figure 3 depicts the evolution of the number of passengers and vehicles over 2023. Focusing on that departure port only, the Molslinjen staff had to generate forecasts for 4,337 departures (i.e., an average of 12 departures per day).
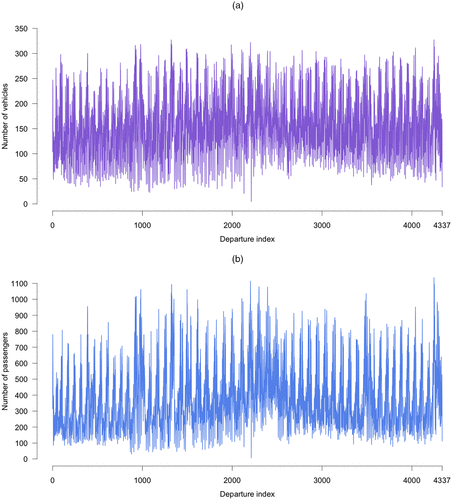
Notes. During 2023, 4,337 passengers and vehicles originated at Odden, Sjællands Odde in Zealand, Denmark. This represents an average of 12 departures per day. For instance, Easter is around the departure index 1000, and the summer holiday in Denmark is between departure indices 2200 and 2600. (a) Vehicles. (b) Passengers.
Over that period, the average numbers of vehicles and passengers per departure were 154 and 381, respectively. However, the variability around these averages is significant, and was driven by calendar and seasonal events such as holidays and special events. The number of passengers varied from 7 to 1,136 per single departure, whereas the number of vehicles varied from 5 to 327. The variability in the number of passengers (i.e., in terms of the variance of the time-series) is more pronounced than the variability in the number of vehicles. Focusing on passengers only, in Figure 3(b), one clearly observes the effect of Easter in Denmark (around departure index 1000), the summer holiday (departure indices between 2200 and 2600), the fall holiday (around departure index 3500), and the Christmas holiday (from departure index 4200 onwards). Passenger ferries are very popular among Danes (and tourists) for commuting between different parts of the country.
These numbers of passengers and vehicles are aggregates only, in order to illustrate the temporal evolution of the target variables of interest. However, in practice, these time-series are to be disaggregated if our objective is to look at the actual target variables that are modeled and predicted. For the vehicles, there are nine types of customer groups (eight types of vehicles, and one pedestrian group). Each group has five subgroups of interest: number of reservations, go-shows (arrivals without reservations), no-shows (reservations without arrivals), passengers, and cancellations. Obviously, these various subgroups do not have the same importance in decision processes. For instance, because business customers do not have to make reservations, accurate prediction of the number who will show is crucial. Similarly, predicting the number of reservations is key; this number is a key input to the process of determining the capacity to be reserved for business customers.
The forecasting engine, which we describe in the Forecasting Engine section, relies on supervised learning to model nonlinear relationships between a set of explanatory variables (also referred to as input features) and the target variables mentioned above. Some of these features are classical ones to consider for calendar effects, for example, time of year, day type (e.g., normal, vacation), and dummy variables for special events. Others inform about past demand in similar conditions (i.e., analogs). Additional input features concentrate on the route specifics (e.g., route identification (ID), departure origin, vehicle group). We could also consider other features. Examples include features related to the weather and to the status of other transport infrastructures in Denmark (e.g., bridges). However, we found that they either did not have a substantial effect (e.g., only extreme weather events would affect the willingness of people to use ferries) or were more difficult to obtain (e.g., the predicted and real-time usage of Danish bridges).
In Figure 2, we illustrate how we use different explanatory variables as input to our forecasts at various times.
Forecasting Engine
At the core of the forecasting engine is a regression approach relying on eXtreme Gradient Boosting (XGBoost). XGBoost was originally proposed and described by Chen and Guestrin (2016). In addition, the use of such an approach and underlying algorithm regularly yielded top performance (in the sense of ranking high in leaderboards) in data science and forecast competitions (Chen and Guestrin 2016, Bojer and Meldgaard 2021). The code and related material are open source and available on GitHub (github.com/dmlc/xgboost), and are now available as packages (e.g., in Python, R).
The basic concept of XGBoost is that it relies on, and generalizes, Gradient-Boosted Trees (GBTs). In turn, the concept of gradient boosting was proposed in 2001, as a basis to obtain universal function approximators (Friedman 2001). This approach is then tailored to the case of regression trees. This yields a tree ensemble, which is seen as an ensemble of weak learners, for which the final prediction is the sum of the predictions from the individual trees. An introduction to XGBoost is available in the form of a tutorial (XGBoost Developers 2022).
Based on the decomposition we describe above, we generate 135 models to train in parallel. Relative to other supervised learning approaches, XGBoost models can be readily fitted based on training data, which consist of a set of past examples (i.e., pairs of input features and corresponding target variable values). However, XGBoost has many hyper-parameters to fine-tune. Based on our empirical investigation using historical data, as well as expert knowledge, the five hyper-parameters deemed most important are selected based on k-fold cross-validation (with k = 5). These five hyper-parameters, from the most important to the least important, include
the number of trees that comprise the ensembles (or, equivalently, rounds of boosting),
the maximum depth of the trees,
the learning rate,
the L1 regularization parameter, and
the subsampling ratio for each feature when constructing the trees.
For both training and cross-validation, the criterion to be minimized is a quadratic criterion, consistent with the idea of predicting the conditional expectation of demand for the departures of interest. As an addition to these training and cross-validation exercises, we also test the alternative models, with various sets of competitive hyper-parameters, over a data set with five years of past data, for which 90% of the data are used for training and 10% for testing. Finally, to compare the updated and retrained model with that in production, we implement a form of A/B testing based on the last month of data, in order to assess the potential improvements brought about by the retrained and updated models. These last-month data are saved for this final step only, and never used for any model selection or training. The retraining of the models and updating of the hyper-parameters are performed on a quarterly basis, unless special events and identified concept drifts (i.e., changes in the characteristics and dynamics of the data, as induced by COVID-19, for instance) motivate dedicated retraining and hyper-parameter tuning.
When used for forecasting, the models generate forecasts that are updated each time new information becomes available. For instance, each time a new reservation is made and recorded, all models update their forecasts for the relevant departure.
From an operational point of view, all the analytics run on the cloud (i.e., on the Molslinjen cloud system), with a user interface (web-based/Microsoft Power BI) that allows us to visualise relevant data, outputs, and metrics. Finally, the forecasts are pushed downstream into their proprietary systems, for further decision making related to operations.
Forecast Verification
Halfspace and Molslinjen have issued forecasts since 2020, both offline for model selection and parameter tuning, as well as operationally. Based on the timeline depicted in Figure 2, from one year before the specific departure of interest until the actual departure, specific lead times are singled out to assess the quality of the forecasts. The quality of the forecasts is to be understood as the objective ability to inform about future events (e.g., assessed based on scores and diagnostic tools). In contrast, the value of the forecasts is about the additional benefits resulting for their use in further decision making. The lead times that are used include six months ahead, one month ahead, one week ahead, and one hour ahead. Note that the forecasts for lead times between six months and one year ahead are the same, because they rely on long-term statistics only (or they rely on the same departure as the previous year for the baseline models). In terms of forecast verification, we follow best-practice principles for the evaluation of our predictions, as Bergmeir (2023) discusses.
The two scores that were agreed upon (between Molslinjen and Halfspace) to assess the quality of the forecasts are the mean absolute error (MAE) and mean absolute percentage error (MAPE). These are common scores to assess forecast quality, as recently reviewed by Petropoulos et al. (2022). We acknowledge that this is not fully aligned with the approach to training the models (i.e., relying on a quadratic loss function). However, in practice, we observed that using a quadratic loss function led to more stable parameter estimates and results in terms of forecast quality. For a given departure at day and time t and lead time k, forecasts are denoted by and corresponding observations by yt. We have an overall number T of departures to consider over 2023 (T = 8,675). The two scores, for a given lead time k, are then defined as
The advantage of these two metrics, for instance, compared with the root mean square error (RMSE, based on a quadratic loss function), is their pragmatic interpretability. MAE can be interpreted as the average deviation, in absolute value, between forecasts and observations. It then allows formulating statements of the type “Forecasts inform about the number of vehicles, ± 10 units” for the example of a MAE of 10 units. In parallel, MAPE represents the average difference, in terms of percentage points, between forecasts and observations. The type of statement that can formulated is “Forecasts inform about the number of vehicles, ± 5% units” for the example of a MAPE of 5%.
The forecast quality metrics are depicted in Figure 4, for the various lead times and for the main overall categories of interest (i.e., number of vehicles and number of passengers). As expected, forecast quality consistently improves as we get closer to actual departure. MAE and MAPE are negatively oriented scores—the lower, the better. Especially, from the one-week-ahead lead time onwards, a considerable amount of new information is made available through online reservations, thereby allowing substantially improved forecasts. At the crucial lead time of one hour before departure, when a decision has to be made about how to optimally pack vehicles in the cargo area, the average deviation between forecasts and actual number of vehicles is only eight vehicles. In parallel, in terms of passengers, that deviation is 18 passengers on average. If we think in terms of percentage deviation, by using the MAPE score, that translates to a 6% deviation for both passengers and vehicles.
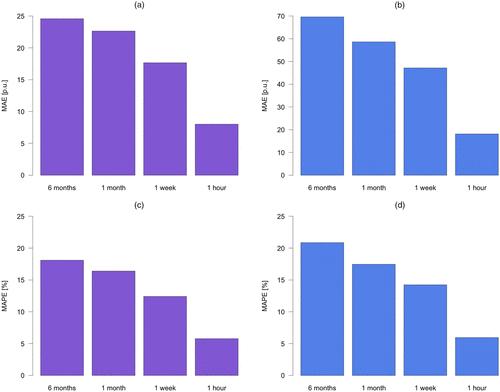
Notes. Forecast quality metrics are calculated for representative lead times (i.e., six months, one month, one week, and one hour ahead). For the MAE metrics, p.u. (per unit) is in terms of number of vehicles, or passengers. (a) MAE, vehicles. (b) MAE, passengers. (c) MAPE, vehicles. (d) MAPE, passengers.
The quality of these forecasts can be readily compared with that of relevant baselines. The baselines reflect the operational practice before the bespoke forecasting engine. The baseline typically is the corresponding departure (i.e., on a similar day and time) at a period of time before the target departure. For instance, considering the departure on Thursday, January 12, at 9 a.m., the first baseline approach to forecast the number of passengers and vehicles is to use data from the previous year, on the closest similar day and time (in this example, Thursday, January 13, 2022, at 9 a.m.). The baseline produced has lead times of one year, two weeks, and one week. Their quality, in terms of both MAE and MAPE, is shown in Table 1. For each lead time of interest, our approach offers substantial improvement over the baseline forecasts. Using the one-week-ahead lead time as an example, the MAE for the forecasts for vehicles and passengers is reduced by more than 50%.
|

Table 1. Performance of Baseline Approaches
| Lead time | Vehicles | Passengers | ||
|---|---|---|---|---|
| MAE (units) | MAPE (%) | MAE (units) | MAPE (%) | |
| One year | 36.4 | 26 | 97.5 | 28.4 |
| Two weeks | 32.7 | 23.3 | 104.3 | 30.4 |
| One week | 30.3 | 21.9 | 95.22 | 28.3 |
Note. Performance in terms of MAE and MAPE, and with lead times of one week, two weeks, and one year, based on previous similar departures.
In practice, the forecast results are also assessed on a per-category basis, for example, for small and large cars, motorbikes, and pedestrians. The forecast quality for these different categories may vary widely, because of the sparse and intermittent data available for each category.
Revenue Management Through Advanced Analytics
Revenue management generally relies on dynamic pricing. Variants exist depending on demand modelling, the choice of contextual variables, and overall objectives. For an introduction to dynamic pricing, the reader is referred to den Boer (2015). Such revenue management approaches were successfully implemented by the airline industry decades ago. In contrast, passenger ferry operators have only recently opened up to that possibility. Molslinjen and Halfspace have been at the forefront of that evolution, by developing and operating the first and leading dynamic pricing system for ferries in Denmark. In this section, we start by describing the operational context for the revenue management approach, and follow with an extensive description of the methodology. We then provide examples to highlight its workings and related benefits.
Operational Context
The revenue management system was first introduced in 2022 on Molslinjen’s main route over Kattegat, between Odden (Zealand) and Aarhus (Jutland). On that route, Molslinjen operates with three separate fare classes:
Business—Tickets are sold at a fixed price of 925 DKK ($135). They include guaranteed access to the ferry of choice without the need to make a booking, while providing lounge access and other benefits (e.g., priority in disembarking);
Standard—Tickets are sold at a fixed price of 749 DKK ($109). They provide access to the specific ferry for which the tickets are purchased (with limited additional benefits);
LowFare—Tickets are sold at lower prices but have restrictions on cancellation and rebooking. The price can span from 249 DKK to 699 DKK (equivalent to $36 and to $102, respectively), depending on the day and time of the departure itself.
There are additional conditions related to rebooking and refunds for both Standard and LowFare tickets, as would be expected for such tiered ticket categories. In simple terms, Standard tickets can be modified for free and are refundable for a fee, whereas LowFare tickets are not refundable and can be modified for a fee.
For Molslinjen, the dynamic pricing problem combines two subproblems. First, for each individual departure, and at any given time prior to departure, Molslinjen must determine how many tickets of each type to make available to customers. In addition, for the specific case of LowFare tickets, for which the price can vary between a lower and an upper bound, the company must determine the price, which can be dynamically updated on a regular basis (e.g., once a day, or once a week) at any time before departure and based on relevant contextual information.
Prior to developing the current revenue management approach, pricing relied on expert-based methods. Each departure was assigned a pricing template that included a starting price, and a number of fixed rules on when to increase LowFare prices, or to close LowFare sales, depending on the time to departure and on the number of reservations. The price templates were chosen simultaneously when developing departure plans, with adjustments based on the previous year’s starting prices and subsequent performance.
Molslinjen’s overall dynamic pricing problem shares similarities with that faced by airlines in which algorithmic revenue management has been commonplace since the 1980s (Talluri and Ryzin 2004), driving significant revenue gains compared with earlier manual approaches. The approach to dynamic pricing in the airline industry has continuously evolved since then, by adapting to changes in the type of offering and to the competitive context; see Fiig et al. (2018). Similar approaches and techniques have been applied in a number of other industries, including in cases that have been recognized as Edelman Laureates, for example, in senior housing (Kuyumcu et al. 2018) and car rentals (Guillen et al. 2019).
However, Molslinjen’s pricing problem differs from the standard airline revenue management problem. On the positive side, dynamic pricing applies to a single route (or leg), without any need to account for network effects or many origin-destination possibilities in the optimization. On the negative side, capacity handling is significantly harder in a ferry setting than for airlines, and it is not possible to apply standard revenue management systems out of the box because capacity is not measured or sold in integer units of a “ticket,” “seat,” or “room.” As we describe below in Methodology Overview, ferries have a given surface area available for vehicles, and different vehicles take up significantly different amounts of space. This is an essential detail in a ferry-oriented revenue management system, and must be accounted for before standard techniques can be applied. These idiosyncrasies, along with an already-existing forecasting engine tightly integrated with Molslinjen’s existing ticketing system, motivated Molslinjen to build a new revenue management system.
From a practical implementation point of view, developing a bespoke revenue management system had the advantage that it could easily be integrated into Molslinjen’s existing system. The revenue management solution could be implemented in Azure Databricks without affecting Molslinjen’s existing ticketing system. This kept the development and deployment costs low compared with alternative approaches. Data management within Molslinjen’s system was also accommodated within the existing legacy system and a cloud-based data platform via application programming interfaces (APIs).
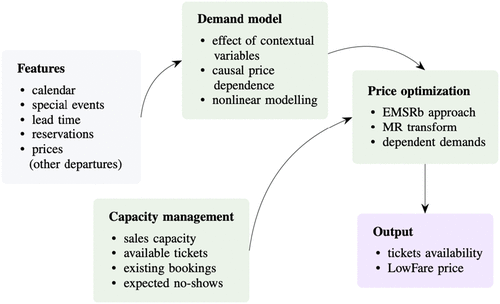
Methodology Overview
The revenue management engine is composed of three main modules:
Demand model—This module is specifically tailored to estimate demand across the three fare classes at different times before departure, conditioned on availability and price points for each ticket class;
Capacity management—This module provides the expected available remaining tickets available for sale for a given departure, given existing reservations and expected no-shows, and taking into account that reserved capacity is measured in lane meters (i.e., the cumulative length of all vehicles that can be packed onboard), and must be converted into an equivalent expected number of available tickets, before revenue management techniques can be applied;
Price optimization—This module sets availability and price points for each departure, given inputs on expected demands and available capacity. We use the EMSRb-MR approach for the optimization, where EMSRb-MR represents Expected Marginal Seat Revenue, version b, with Marginal Revenue transformation (Fiig et al. 2009).
Each of these components is described in detail in the following sections. The overall data and workflow of the revenue management system are depicted in Figure 5.
Note. The process is executed daily for each departure over the two weeks prior to departure, and with less frequent updates up to 12 weeks before departure.
The Price-Dependent Demand Model.
Any approach to data-driven revenue management is dependent on a forecast of demand for each fare class, should that fare class be offered for sale. This is very similar to the type of (causal) forecasting for pricing performed by online retail companies, for example, at Zalando (Schultz et al. 2023). In the case where demand for each fare class cannot be assumed to be independent, it is essential to model the dependencies and take them into account in price optimization. This is the case for Molslinjen, where the key pricing decision is to choose one among the many potential fares for the LowFare ticket class. Therefore, we had to develop a model for price sensitivity in the customer segment buying LowFare tickets. This required an extension to the forecast engine presented in Forecasting for Bookings and Arrivals.
In practice, the demand modelling problem was split into two parts. The demand for Business tickets was predicted using the existing forecast engine. In contrast, a dedicated model was developed for the Standard and LowFare classes, with a specific focus on modelling (1) price elasticity and (2) the upsell potential from the LowFare class to the Standard class, in the case where no LowFare tickets were available. Overall, the aim is to model and predict , which are the daily ticket sales for the Business, Standard, and LowFare categories.
Specifically, for the LowFare category, the price elasticity of customers buying such tickets depends significantly on the time to departure, with customers being significantly less sensitive to price on the day(s) immediately before departure than when booking tickets far in advance. This was known prior to the modelling work, and informed the decision to approach this as a regression problem, building a model targeting the daily ticket sales in the LowFare and Standard categories. The modelling approach combines parametric modelling of the price dependency and a Bayesian neural-network model for the other effects that are not price related.
Because we use a similar approach for both Standard and LowFare categories, we use the latter case to describe our modelling approach hereafter. The model accommodates two types of input features , where are all features that are related to prices, and are all the contextual variables that are not price related. It is implicitly assumed that the features induce the price-related causal impact on sales, whereas the other covariates control for other effects. The price-related features consist of pL, the price of a LowFare ticket on that day (time-averaged price used in case the price changed), as well as an indicator variable IL for whether LowFare tickets were available for sale. Other features included as control variables in the model, , consist of all the inputs described for the forecast engine in Forecasting for Bookings and Arrivals, the average price ratio (i.e., the ratio of the prices of the current departure to neighboring departures), and the number of reservations up to and including the prior day (in the form of a time-series).
We model the LowFare sales nL as a combination of the causal price-induced effects and of the effects from other contextual variables, that is,
Combining the flexibility of the Bayesian neural network with the parametric modelling as in Equation (2) has the benefit of ensuring that, while we can flexibly model the nonlinear dependence of demand (on, e.g., time-of-day, time-of-year in a simple setup), the resulting model remains interpretable. Indeed, one can appraise and visualise the relationship between price and demand according to the model, for example, a single, well-defined expected optimal price for all departures, at any time prior to departure. Using a nonparametric approach instead would entail a high risk that the demand model would try to flexibly fit the data, resulting in a price-demand relationship that would have oscillations, somewhat indicating that for some price ranges the demand would increase with increasing prices. This would go against basic economic intuition.
The optimization depends on potential demand for each departure as a whole, not on daily demands only. Therefore, we implemented a simulation engine that can estimate the aggregate demand for a departure across multiple days, by continuously sampling predictions from the model and aggregating reservations and corresponding uncertainties. These simulations are used to calculate the necessary input for the EMSRb-MR process we describe below and are set up to take into account a number of guardrails on prices, for instance, minimum requirements on prices very close to departure.
Capacity Management in the Revenue Management System.
The available capacity of tickets to sell is a fundamental input to all revenue management optimization algorithms. In the context of ferries, the number of vehicles that can be accommodated to a large degree depends on the size of the vehicles. Here, capacity on the ferry is measured in lane meters, and the number of vehicles each lane on the ferry can accommodate is determined by the average length of the arriving vehicles. The length varies significantly between vehicle types, and even the average length of a personal car can vary up to 25% between departures.
The dynamic pricing engine developed by Halfspace and Molslinjen handles this in detail. When making a booking, customers provide a registration number; therefore, it is possible to find the car in the national registry. The actual length of the booked vehicle can hence frequently be deduced for both current and historical bookings. Therefore, for a given departure, the lane meters required to accommodate space for already-booked tickets are known with high precision. Likewise, the still-available lane meters can be converted into an equivalent number of tickets for sale using the expected average car length in historical data. In practice, the capacity management for the revenue management system is handled using so-called units of standard vehicle sizes, not lane meters directly. The details are left out for brevity, but the overall principles are as we describe here. The final output is the number of available tickets for sale, which is the standard input required to existing, well-developed revenue management optimization algorithms.
Capacity management is further optimized by operating with a sales capacity that is larger than the physical capacity of the ferry. This is done to account for expected cancellations and for expected no-shows, that is, passengers who reserve a ticket but do not show up. The numbers of cancellations and no-shows are predicted for each departure by the forecasting engine, following principles laid out in Forecasting for Bookings and Arrivals. The sales capacity is then adjusted by accounting for the historical proportion of tickets being sold (for similar departures and conditions), for which physical capacity was not used in practice (because the corresponding vehicle never boarded the ferry).
The Price Optimization Approach.
The revenue management engine optimizes revenue by setting prices for each departure individually, choosing whether LowFare tickets should be offered and at which price points. We chose EMSRb as our optimization approach, employing a marginal revenue (MR) transformation to make the approach suitable for pricing the LowFare class, for which many price points are possible. The combined approach is denoted EMSRb-MR in the remainder of this paper. The letter “b” expresses the fact that this approach is the second version of expected marginal seat revenue optimization. The first version was referred to as EMSRa. However, because it led to results that were too conservative, the next version, EMSRb, was introduced (Fiig et al. 2009). This is the most popular approach employed in practice today.
EMSR is a classical revenue management heuristic (Belobaba 1987, 1989, 1992). It solves the revenue optimization problem for a situation with a number of fare classes, ci (), with corresponding prices, pi, ordered in decreasing order (), assuming that the independent, unconstrained demands for each fare class are normally distributed . Independence, in this context, means that the demand for fare class c1 does not depend on whether tickets for fare class c2 are available for sale. The output from the revenue optimization problem takes the form of a number of protection levels, denoted πi. The protection level πi is the number of tickets that should be protected for sale in fare classes at price pi or higher. The demand for all fare classes at these prices is also normally distributed with
By defining the demand-weighted prices (), the optimal protection levels are given by
For an extensive description and discussion of the EMSRb approach, we refer the reader to Belobaba (1987), Belobaba (1989), and Belobaba (1992).
The basic EMSRb optimization assumes independent demands. This was a reasonable assumption in the early days of revenue management in the airline industry, where great care was taken to differentiate fare classes to target nonoverlapping customer segments (Talluri and Ryzin 2004). However, in the case of Molslinjen the assumption completely breaks down for the LowFare fare classes, which are only differentiated by price. This is not unique to the case of passenger ferries and of Molslinjen. This was also tackled in the airline setting with the advent of budget airlines in the 1990s; see Weatherford and Ratliff (2010) for a review. This work employs a marginal revenue transformation to address the issue, following an approach developed by Fiig et al. (2009), in which a dependent-demand problem can be translated into an approximately equivalent independent-demand problem, and standard solvers applied. EMSRb is applied after the MR transform, and the combined approach is denoted EMSRb-MR.
In line with the standard EMSRb approach, the output of an EMSRb-MR optimization is a number of protection levels for sets of fare classes, in decreasing price. An output example could be the following (the exact numerical values given here are purely for illustrative purposes, and not the outcome of a real optimization step): 25 tickets are reserved for business tickets only, 35 places are reserved for either standard or business tickets, and 45 places are reserved for any tickets costing at least 699 DKK ($102), including the most expensive LowFare ticket. Given these protection levels and the available remaining capacity on the departure, it is trivial to determine which fare classes should be open for sale, or closed. However, it is essential to take into account both the actual size of vehicles that have already been booked and the expected vehicle size for future bookings when determining the effective remaining available capacity of tickets for sale—and thus when setting the correct price. This is a significant complication compared with existing systems, and motivates the capacity management module we describe above in Capacity Management in the Revenue Management System.
In the EMSRb-MR approach, one or more of the least expensive fare classes could remain closed, even if the number of bookings does not reach or exceed the ferry capacity. This happens if the expected marginal revenue of opening such a class is negative, because downselling from more expensive classes is not compensated by the added volume of ticket sales. In practice, this is taken into account in a step prior to EMSRb-MR optimization, which we refer to as direct optimization. It is done by only considering LowFare prices at or above the price that would be optimal if no capacity constraint existed (according to the demand model) when considering potential pricing strategies for which to assign capacity in the EMSRb-MR optimization. A number of additional guardrails are also applied at this step, for example, limiting the potential daily price jumps, or aligning the potential pricing strategies with business objectives for given departure segments. The revenue management team at Molslinjen continuously monitors prices and aligns them with these business objectives.
The EMSRb-MR approach was chosen because it has been proven to efficiently provide dynamic prices that accommodate price elasticity, while being reasonably simple to implement in terms of technical complexity, and from a stakeholder-management perspective. EMSRb optimization was familiar to a number of key stakeholders within Molslinjen, and the output in terms of booking limits and protection levels provides some transparency into the algorithmic decisions.
The price optimization is run on a daily basis for departures within the next two weeks, and at fixed, longer intervals for departures further in the future. The available tickets and prices for a given departure change dynamically within the period between reoptimizations, because new reservations result in price levels becoming unavailable if booking limits are reached.
Results Using Two Examples
The effect of EMSRb-MR optimization (and of the revenue management approach more generally) can be most easily seen on full departures, where the capacity constraint results in closing the sale of cheaper LowFare tickets. A departure is considered full if more than 90% of the physical capacity is utilized by the arriving vehicles. Such cases represent a limited number of departure cases (around 15% of them). The maximum effect from EMSRb-MR is observed for these cases. For lower-demand cases, the revenue uplift is less pronounced. The initial effect on revenue was estimated by comparing the prices set by the EMSRb-MR system with those of the business-as-usual prices that would have been set by the deterministic pricing templates for such departures.
This effect is depicted for two different target departures in Figure 6. These examples show booking curves for these specific departures, in terms of both price and capacity reservations, from 45 days before departure to the day of departure. The price evolution is compared with the business-as-usual pricing approach, for example, based on the pricing template that was in use before the rollout of the revenue management toolbox. Following that business-as-usual approach, the price was flat and set to the minimum (249 DKK/$36) for the entire period prior to four weeks before departure. Then, for these two examples, the prices were adjusted 10 days before departure, and finally on a daily basis over the last five days. However, the timing and magnitude of the adjustments were arbitrary, because they were based on the pricing template. In comparison, the dynamic pricing approach continuously updates prices (both upward and downward) depending on factors such as capacity updates and demand modelling updates. For instance, following a surge in reservations, booking limits determined by EMSRb-MR are reached and the revenue management system closes sales of the least expensive tickets. As a result prices increase compared with the pricing template. Eventually, the price set through dynamic pricing is consistently higher than the business-as-usual approach, while not compromising sales. Indeed, excessive price increases could restrict sales. The total estimated revenue gains due to price increases from the revenue management system for these two specific departures, as compared with the pricing template, are 22,919 DKK (approximately $3,300) and 19,220 DKK (approximately $2,800), respectively.
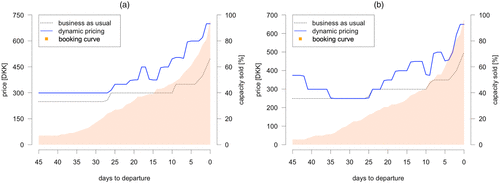
Notes. We compare the prices from the dynamic pricing approach with the prices that would have been used if we had employed the business-as-usual pricing approach. The graphs show the evolution of prices and capacities from 45 days prior to departure to the actual departure day. The booking curve is for the dynamic-pricing case only. Booking curves for the business-as-usual case would look very similar. (a) Departure from Aarhus (Jutland) on September 3, 2023, at 7:15 p.m. (b) Departure from Odden (Zealand) on October 6, 2023, at 5:05 p.m.
Impact
The objective of our work was to have a substantial impact on revenue and ESG criteria, mainly related to emissions. However, its impact can also be assessed in terms of changes in operational practice, staff adoption, and customer satisfaction. Therefore, this section covers both a quantitative and qualitative assessment of impact at Molslinjen.
Quantitative Assessment
General Considerations.
At the beginning of the project, clear criteria were set in order to assess success, from both operational and financial points of view. Obviously, because variations in these criteria may be due to different factors, it was important to clearly state our assumptions and to be rigorous in attributing improvements to the toolbox and solutions developed. On this last point, whenever relevant, we asked key staff members at Molslinjen to assess how the combination of several factors may have led to the improvements observed, to reach a consensus on the most appropriate and fair attribution.
The most important assessment criteria include
time used for staff planning and ferry packing,
number of delayed departures and average delays,
fuel consumption, related costs, and impact on emissions,
available capacity for vehicles at departure,
revenues (on full departures, where dynamic pricing is most relevant, and overall).
In practice, some of the relevant inputs were readily available from the operational data. These include the time used for staff planning and ferry packing, as well as the number of delayed departures and average delay per departure. Because we may expect to see an effect linked to volumes (i.e., there should be fewer delays if there are fewer vehicles to pack at each departure), we considered this aspect in our comparison. For instance, departures in periods with significant COVID-19 disturbances were removed. In addition, the average numbers of passengers and vehicles were checked over the periods considered to ensure they were comparable. Staff members from Molslinjen reached a consensus that 70% of the impact (in terms of reducing delays) could be attributed to the forecasting and ferry packing tools.
In parallel, the impact on emissions (denoted ) is directly linked to fuel consumption. It is based on the additional fuel consumption from sailing one minute faster (), as well as the average normal fuel consumption per trip (), in combination with the decrease in delay (), that is,
Consequently, the overall cost reduction from less delay was calculated as
Impact of the Forecasting Engine.
Based on the approach described above, we assessed that the benefits from using the forecasting engine included a 3.5% decrease in the number of delayed departures. Similarly, the average departure delay was reduced by 1.5 minutes. This translates to a 3% reduction in overall fuel consumption, and a fuel cost reduction of 10–12 million DKK per year (approximately $1.44–1.73 million, across Molslinjen’s 8,000+ yearly departures).
The forecasting engine also had a direct impact on revenue: as a result of the efficiency gains in packing, Molslinjen was able to increase the number of vehicles packed in the cargo area by 6% on average. This number of vehicles is based on the actual capacity of the ferries and the ability of the Molslinjen staff to load the ferry without any delay.
Impact of the Revenue Management System.
Looking at the revenue management system, the sales capacity on full departures increased further by 5,000 tickets (6%), as a result of reselling tickets that were expected to turn into cancellations/no-shows. Indeed, by increasing the accuracy of cancellation and no-show predictions, it was possible to increase the number of tickets for sale. We calculated this based on total expected cancellations/no-shows predicted for full departures in 2022.
During an initial test period spanning July–October 2022, immediately following the launch of the revenue management system, the total revenue increase and the revenue increase for full departures were computed (again, comparing the previous pricing template and the dynamic pricing outcomes, that is, based on counterfactual analysis). The estimated revenue increased by 7%–15% for full departures (i.e., departures for which more than 90% of the tickets were sold), and by 1%–2% overall. We continuously monitored revenue following the testing period; the results we achieved during the first three quarters of 2023 were equivalent. During that period, the revenue management system increased prices compared with the baseline on 70% of all full departures. For departures that are not considered full departures (i.e., with less than 90% of the tickets sold), there were also benefits from dynamic pricing, although they were less pronounced.
Assessing the benefits from deploying a new revenue management system is a difficult task, because the two alternatives cannot be implemented in parallel. Counterfactual analysis is consequently used. Ideally, a well-designed A/B testing setup would have been ideal for the purpose of quantifying the impact with the greatest possible confidence. However, it was not feasible from a business perspective. Differentiating pricing approaches, and therefore prices, between customers on a single departure was not deemed acceptable from a business perspective—nor practical to implement. Differentiating pricing approaches between departures would have to be done on a day-by-day basis, or even week-by-week, because of significant cross-elasticities between departures. The number of days or weekends that would have to be priced with a business-as-usual approach was deemed incommensurate with the objective of rolling out the system quickly and realizing revenue gains, especially because the launch in July coincided with the high season, when a large number of departures were capacity limited. Therefore, we pursued the approach to validating input described above. We risked overestimating the calculated impact, by not taking into account that the volume of sold tickets could have been higher in the business-as-usual setting, in which prices were lower. However, as we illustrate in Results Using Two Examples, the effect of changing the pricing strategy is mainly visible for full departures, where the impact of the novel dynamic pricing approach is clear. For the other departures, the prices tend to be similar, and the possible impact on demand may be seen as negligible. In addition, if the departure was already going to be full with the status quo prices, increasing the prices with the dynamic pricing approach gave the opportunity to increase revenue without compromising sales.
Overall Benefits.
In total, the analytics toolbox has generated for Molslinjen 15–20 million DKK ($2.6–3.2 million) additional profits per year, from a combination of cost savings and increased top line (i.e., increased revenues based on additional gross sales), and a 3% reduction in fuel consumption and emissions. Since their launches in 2020 and 2022, respectively, the forecasting and dynamic pricing engines have increased profits by a total of 35 million DKK (approximately $5 million as of the end of 2023). In addition, because the solutions are currently being improved and implemented on additional routes, profits are expected to increase in the future.
Qualitative Assessment
Since 2019, Molslinjen and Halfspace have had multiple occasions to reflect on the challenges and successes related to the development of these analytics solutions. In addition to the quantitative assessment and underlying indicators we discuss above, all stakeholders involved have also noticed the positive changes brought about by this process. Some of these elements were already discussed throughout the paper, for example, how the packing process became easier for the staff involved, and more consistent for all ferry departures. In parallel, we observed how these new analytics solutions and related changes in practice were widely adopted by all concerned staff at Molslinjen. As of now, no stakeholder would envisage going back to the previous practice.
We collected statements from leading stakeholders within Molslinjen, who have been directly involved with the process and in assessing its success.
Kristian Durhuus, CEO of Molslinjen: “When we embarked on this journey more than five years ago, we envisaged that Molslinjen could fundamentally change how the ferry industry operated by applying advanced technologies across our organization. Together with Halfspace, I believe that we have redefined operational principles for the ferry industry and have set new benchmarks for impact and innovation in a global scale.”
Jesper Skovgaard, CCO at Molslinjen: “We have had the vision to be the world’s most digitalized and AI-driven ferry company. Together with Halfspace, we have achieved that in a very short time. We can already see the effect of using advanced analytics and artificial intelligence to optimize our services and profits via fully automated forecasts and dynamic pricing of our products, and we only expect the impact to increase in the future.”
Lasse Janerka, Digital Director at Molslinjen: “The incorporation of AI technology in our operations, in collaboration with Halfspace, marks a revolutionary shift in our practice, from mostly human-based to fully data-driven operations. As a result, we have witnessed substantial improvements, especially when it comes to predicting the demand and to optimizing the loading of vehicles, that are even beyond our original expectations. The revenue management system additionally brings a paradigm shift in the way we handle ticket sales. This advancement has elevated our operational efficiency and profoundly improved the customer experience, exemplifying the vast potential of digital transformation in our sector.”
Jens Christian Bjeldorf, Chief Captain at Molslinjen: “From my perspective at the helm, the changes instigated by our partnership with Halfspace are distinctly noticeable. The improvements in our daily operations have been significant. The enthusiastic adoption and integration of these technologies by our team have been remarkable, since recognizing their contribution to increased efficiency and improved decision-making processes. The process of preparing departures has become easier and less stressful. It feels that we have fundamentally transformed our approach to maritime service and that we are setting a precedent in the industry.”
In addition to the direct recognition from stakeholders within Molslinjen, the work performed received substantial acclaim. The broad external recognition is evident from the many awards within digital innovation, data science, AI, and advanced analytics won in Denmark and the United Kingdom, as the following examples illustrate:
2022 Danish Digital Awards: Award winner in Data Science
2022 UK AI & Machine Learning Awards: Best Use of Predictive/Prescriptive Analytics (“highly commended”)
2021 UK AI & Machine Learning Awards: Business Transformation of the Year
2021 Data Breakthrough Awards: Halfspace named “Industry Leader”
2021 IDC Data Strategy & Innovation Awards (runner-up)
2021 Danish Digital Awards: Award winner within Analytics & AI, Innovation & Marketing Automation
Conclusions
Digitalization is changing the way passenger ferries may be operated in a more data-driven and efficient manner. For a company like Molslinjen, the change has been substantial and happened over a fairly short period of time. Starting with simple data products to improve user engagement, it rapidly evolved into the development and rolling out of a set of analytics tools including a packing solution, a forecasting engine, and a revenue management system. The impact from these new solutions was evidenced, both quantitatively and qualitatively. This has brought profound changes at all levels within the company, but also to external stakeholders (e.g., customers, investors, and the media). The solutions developed are generic and could be used by others in the future. Their application requires the collection of detailed data about bookings, prices, sales, and vehicles onboard. Then, the same models can be trained based on the data collected. They can then be used for forecasting and dynamic pricing. There may be additional constraints (e.g., due to local regulations, ferry characteristics, and operational practices) that would need to be considered. Molslinjen and Halfspace are already exploring how the solutions may be transported and deployed for other European ferry operators.
Molslinjen now is in an excellent position to continue this digitalization process. Some of the obvious next steps will be to source additional data to improve the outcome of the forecasting and dynamic pricing analytics components. Another is to more broadly deploy the complete toolbox on all routes (as of now, the solution is deployed and utilized routinely for the main routes, representing 50% of all departures). Eventually, having reached a leading position within the passenger ferry landscape, Molslinjen and Halfspace may help and advise other companies to engage with similar developments.
First, the authors are grateful for the opportunity given by the Franz Edelman award committee to be finalists in the award competition in 2024. Our coaching team (Mikael Rönnqvist, Kermit Threatte, and Manish Bansal) has provided us with continuous and invaluable support—the authors thank them for that. The authors also acknowledge the feedback from Pelin Pekgun, and the editorial work of Alice Mack, which allowed us to substantially improve the manuscript.
Over the years, many people at Halfspace and Molslinjen became involved in this partnership, as well as in specific development and related activities. Hence, the list of people who should be acknowledged for this work and the success of that partnership extends far beyond the list of authors of this paper. Specifically at Halfspace, Svend Lund Breddam, Marie Opstrup Andersen, Vera Patricio, Uffe Furlig Larsen, and Christian Michelsen are to be acknowledged for their input to the forecasting and revenue management systems (as well as their input to this manuscript). We also acknowledge all those who have contributed with both positive and critical feedback over the years, as well as with processes such as integration and training at Molslinjen and Halfspace. Specifically for the Edelman award competition, we thank Adam Haxholdt, Frederik Jensen, and Emilie Josephine Lindblad (Halfspace) and Jens Christian Bjeldorf (Molslinjen) for their contributions.
References
- (1987) Air travel demand and airline seat inventory management. PhD thesis, Massachusetts Institute of Technology, Cambridge.Google Scholar
- (1989) Application of a probabilistic decision model to airline seat inventory control. Oper. Res. 37(2):183–197.Link, Google Scholar
- (1992) Optimal vs. heuristic methods for nested seat allocation. Proc. AGIFORS Reservations Yield Management Stud. Group (AGIFORS, Atlanta).Google Scholar
- (2023) Common pitfalls and better practices in forecast evaluation for data scientists. Foresight Internat. J. Appl. Forecasting 70(3):5–12.Google Scholar
- (2021) Kaggle forecasting competitions: An overlooked learning opportunity. Internat. J. Forecasting 37(2):587–603.Google Scholar
- (2016) XGBoost: A scalable tree boosting system. Proc. 22nd ACM SIGKDD Internat. Conf. Knowledge Discovery Data Mining, 785–794.Google Scholar
- (2020) Liner shipping network design. Eur. J. Oper. Res. 286(1):1–20.Google Scholar
- (2015) Dynamic pricing and learning: Historical origins, current research, and new directions. Surveys Oper. Res. Management Sci. 20(1):1–18.Google Scholar
- (2018) Dynamic pricing of airline offers. J. Revenue Pricing Management 17(6):381–393.Google Scholar
- (2009) Optimization of mixed fare structures: Theory and applications. J. Revenue Pricing Management 9(1–2):152–170.Google Scholar
- (2001) Greedy function approximation: A gradient boosting machine. Ann. Statist. 29(5):1189–1232.Google Scholar
- (2019) Europcar integrates forecasting, simulation, and optimization techniques in a capacity and revenue management system. INFORMS J. Appl. Anal. 49(1):40–51.Link, Google Scholar
- (2018) Revenue management delivers significant revenue lift for holiday retirement. INFORMS J. Appl. Anal. 48(1):7–23.Google Scholar
- (2022) Forecasting: Theory and practice. Internat. J. Forecasting 38(3):705–781.Google Scholar
- (2024) Operational research: Methods and applications. J. Oper. Res. Soc. 75(3):423–617.Google Scholar
- (2023) Causal forecasting for pricing. Preprint, submitted December 23, https://arxiv.org/abs/2312.15282.Google Scholar
- (2004) The Theory and Practice of Revenue Management (Springer, New York).Google Scholar
- (2016) The load-balanced multi-dimensional bin-packing problem. Comput. Oper. Res. 74(1):152–164.Google Scholar
- (2024) Literature survey on the container stowage planning problem. Eur. J. Oper. Res. 317(3):841–857.Google Scholar
- (2010) Review of revenue management methods with dependent demands. J. Revenue Pricing Management 9(4):326–340.Google Scholar
- (2013)
Ferry passenger markets . Talley WK, ed. The Blackwell Companion to Maritime Economics (Wiley, Hoboken, NJ), 161–183.Google Scholar XGBoost Developers (2022) XGBoost tutorials. https://xgboost.readthedocs.io/en/stable/tutorials/model.html.Google Scholar
Pierre Pinson is chief scientist at Halfspace, as well as the chair of data-centric design engineering at Imperial College London, Dyson School of Design Engineering (UK). He is also an adjunct professor of operations research and analytics at the Technical University of Denmark and an international research fellow at the Center for Research on Energy, Aarhus University (Denmark). He is the editor-in-chief of the International Journal of Forecasting.
Mikkel Bjørn is a partner and associate director of data science in Halfspace. He holds a PhD in particle physics from the University of Oxford (UK) for work at the CERN laboratory, as well as an MSc in theoretical physics from the Niels Bohr Institute (Denmark). He has received multiple prizes and awards, including the 2021 PhD prize for the best doctoral thesis in the UK within the LHCb collaboration. He won a bronze medal at the International Physics Olympiad finals in Mexico in 2009.
Simon Kristiansen holds a PhD in operations research and applied mathematics from the Technical University of Denmark. He is a cofounder, partner, and associate director for engineering at Halfspace. He received the bronze medal from the unofficial World Cup in Schedule Planning.
Claus B. Nielsen is founding partner and CEO of Halfspace. He has years of experience in building advanced technical teams to support commercial strategies, and as an advisor to senior leaders in well-known Danish and American organizations on artificial intelligence (AI) use case maturity and investments in AI. Prior to founding Halfspace, he cofounded two recognized online platforms in Scandinavia, within gaming and fashion blogs. He is a former world top-10–ranked backgammon player by World Series of Backgammon.
Lasse Janerka is director, Business Optimization & Digital, at Molslinjen. He holds both BSc and MSc degrees from Aarhus University, and had a diverse career within marketing and journalism before leading different projects and initiatives for Molslinjen over the last 10 years.
Jesper Skovgaard is chief commercial officer (CCO) at Molslinjen. He received a degree from the Copenhagen Business School (Denmark). He has been leading pricing and revenue management projects for different companies in the airline industry, before taking that lead position at Molslinjen 12 years ago.
Kristian Durhuus is chief executive officer (CEO) at Molslinjen. He received a BSc in business administration from the University of Southern Denmark and an MSc in international management and business economics from the Copenhagen Business School (Denmark). He has had management leadership positions with Swiss International Airlines, LSG Sky Chef, Copenhagen Airport, ForSea, and Molslinjen.

