Is Relevancy Everything? A Deep-Learning Approach to Understand the Effect of Image-Text Congruence
Abstract
Firms increasingly use a combination of image and text description when displaying products and engaging consumers. Existing research has examined consumers’ response to text and image stimuli separately but has yet to systematically consider how the semantic relationship between image and text impacts consumer choice. In this research, we conduct a series of multimethod empirical studies to examine the congruence between image- and text-based product representation. First, we propose a deep-learning approach to measure image-text congruence by building a state-of-the-art two-branch neural network model based on wide residual networks and bidirectional encoder representations from transformers. Next, we apply our method to data from an online reading platform and discover a U-shaped effect of image-text congruence: Consumers’ preference toward a product is higher when the congruence between the image and text representation is either high or low than when the congruence is at the medium level. We then conduct experiments to establish the causal effect of this finding and explore the underlying mechanisms. We further explore the generalizability of the proposed deep-learning model and our substantive finding in two additional settings. Our research contributes to the literature on consumer information processing and generates managerial implications for practitioners on how to strategically pair images and text on digital platforms.
This paper was accepted by Duncan Simester, marketing.
Funding: J. Cao acknowledges financial support from Young Scientists Fund of National Natural Science Foundation of China [Grant 72402192], the General Research Fund [Grant 17501423] and Early Career Scheme [Grant 27502521] of the Research Grants Council of Hong Kong, and the Institute of Behavioural and Decision Science, the University of Hong Kong (HKU).
Supplemental Material: The online appendices and data files are available at https://doi.org/10.1287/mnsc.2022.01896.
1. Introduction
In the digital era, firms increasingly utilize multimodal product presentation, such as a combination of image and text, to communicate with consumers. Amazon presents cover images and short descriptions for its books, on social media platforms such as Twitter and Facebook, brands display images along with their posts. In practice, firms often pair images with textual content based on heuristic considerations. Limited research exists on how to couple image and text and how consumers respond to different combinations thereof. How do we measure the semantic relationship between image and text? What combination of image and text can yield positive responses from consumers and why? In this paper, we set out to answer these questions.
Researchers have long been interested in how unstructured data such as image and text affect consumer choice and perception. However, thus far, the two media formats have largely been analyzed separately in marketing research. For text, marketing researchers have used various methods including entity extraction, topic modeling, and relation extraction to study how the content and text sentiment can affect consumer preferences (Berger et al. 2020). For images, important picture features have been identified to affect consumer information processing, which include aesthetic features such as colorfulness, color composition, and surface size, as well as content features such as the presence of human faces (Finn 1988; Pieters and Wedel 2004; Wedel and Pieters 2008, 2015; Li and Xie 2020). Furthermore, recent developments in machine learning allow us to study images in a more automatic way. Zhang et al. (2022) used machine learning to conduct large-scale image analytics and examined how dwelling images affect demand on Airbnb. Dew et al. (2022) developed algorithms to extract logo features, which are shown to predict consumers’ perception of brand persona.
One significant limitation of the existing research, however, is that images and text have been examined independently. Marketing literature has yet to systematically consider how the semantic relationship between image and text impacts consumer choice. In other words, how do image and text jointly affect consumer perception and choice? Must the information contained in the image be consistent with that conveyed by the text and vice versa? What happens if the two media formats are not aligned in the information they convey? Answers to these questions can shed light on how consumers process image and text information during product choice and help managers strategically couple images and text to boost consumer preference.
To answer these questions, we examine the effect of image-text congruence in this research. From the perspective of information processing theory, image-text congruence refers to the degree to which the two media formats holistically adhere to the general focus of the plot (Heckler and Childers 1992). In marketing research, the congruent or incongruent relationship between image and text has traditionally been coded by human annotators in experimental (Heckler and Childers 1992, Lee and Mason 1999) and empirical studies (Li and Xie 2020), limiting this concept’s application to more general contexts or to larger-scale data. In this research, we propose a deep-learning approach to measure the image-text congruence in a more systematic and scalable way. Our approach employs cutting-edge image and text embeddings (wide residual networks (WRNs) and bidirectional encoder representations from transformers (BERT)) to extract the semantic meaning from images and text, respectively. Furthermore, we jointly train the image and text embeddings by fitting a supervised deep-learning model with two-branch neural networks. By considering the two information sources simultaneously, our method captures their semantic relationship better than analyzing each source separately.
We apply this two-branch deep-learning method to the data from an online reading platform that offers ebooks and audiobooks to young readers. Our data include detailed browsing and choice behaviors from approximately 16,000 users over a period of seven months in 2019. We demonstrate that our proposed deep-learning model can evaluate the semantic congruence between a book’s cover image and text summary in a scalable and reliable way. With the measured image-text congruence, we further identify an interesting U-shaped relationship between congruence and consumer preference. Consumers are more likely to choose a book when the congruence between its cover image and text summary is either high or low. Surprisingly, there is a “dull zone” around the medium level of congruence, indicating that consumer preference is the lowest when the congruence level between book cover and summary is moderate. This result is obtained after controlling for book quality indicators, image characteristics, and text characteristics.
The U-shaped relationship between image-text congruence and consumer preference has important managerial implications and, to the best of our knowledge, has not yet been documented in the literature. The results based on observational data, however, suffer from two limitations. First, the results may be subject to endogeneity bias, as a product with a higher level of (unobserved) quality may exhibit a certain degree of image-text congruence and be more appealing to consumers. Second, observational data may lack important underlying variables to explore the mechanisms behind this U-shaped effect.
To overcome the aforementioned limitations, we conduct two additional studies. In a controlled experiment, we manipulate the level of image-text congruence while keeping the other image- and text-features constant. Results from this experiment replicate the U-shaped relationship identified in our observational study and thus confirm the causal effect of image-text congruence on consumer preference. In a second study, we explore the potential mechanisms for the identified effect of image-text congruence. Based on the information processing literature (Houston et al. 1987, Heckler and Childers 1992), we hypothesize that the effect of image-text congruence is driven by two underlying constructs: relevancy and surprise, where the former reflects how much the image and text pertain directly to the meaning of each other and the latter reflects how much the information in one media is unexpected based on the meaning of the other. Our analysis confirms that relevancy and surprise can both increase consumer preference, albeit through different routes. When relevancy is the driving force, which corresponds to a high level of image-text congruence, consumers are likely affected by the fluency between the information sources and thus make a favorable choice. In contrast, when surprise is the driving factor, which corresponds to a low level of image-text congruence, the content embedded in image and text diverges so that consumers tend to spend more time processing the information. This high level of elaboration brings more consumer attention to the product, which could also lead to a higher choice likelihood. High elaboration likelihood may also allow a deeper level of connection between image and text to be found, so that consumers have a greater chance to experience an “Aha” moment.
To examine the study’s generalizability, we apply our model to two additional contexts: movies and home-sharing properties. In the first context, we measure the congruence between the poster image and the movie summary, and in the second context, we measure the congruence between a dwelling’s profile image and its description. Results show that in both contexts, our deep-learning model can achieve good performance in measuring image-text congruence, indicating that our measurement method is generalizable. Furthermore, we replicate the U-shaped effect of congruence in the movie context but identify a positive correlation in the home-sharing context. These findings indicate that the relative magnitude of the two drivers, relevancy versus surprise, could be context dependent. In scenarios where consumers prioritize clarity and certainty, such as in the home-sharing setting, surprise plays a relatively less important role in the decision-making process and information fluency becomes the main driver, so that higher levels of congruence lead to more favorable consumer responses.
This study contributes to the marketing literature in several ways. First, utilizing large-scale real-world data, we uncover an interesting U-shaped relationship between image-text congruence and consumer preference, which has not yet been documented in the literature. Second, in addition to using field data, we further employ an experimental approach to establish the causal effect of the congruence and replicate the U-shaped relationship. Furthermore, we investigate the mechanism underlying this U-shaped relationship. We identify that the drivers behind this effect are the level of relevance and surprise between the semantic meaning of the image and text. Consumer preference is high when the information embedded in an image-text pair is highly relevant or when one medium contains information unexpected from the other. This pattern shows that the impact of image-text congruence extends beyond mere relevance, the element of surprise between image and text also plays a significant role. Based on empirical results, our research offers vital managerial implications related to the pairing of images and text in various settings of product presentation and social media communication. In particular, our findings can help managers strategically plan their multimodal content to engage customers more effectively.
The paper proceeds as follows. We briefly discuss the relevant literature in Section 2. We present the setup of our proposed deep-learning method for measuring image-text congruence in Section 3, and in Section 4, estimate the effect of image-text congruence using observational data. In Section 5, we conduct a controlled experiment to replicate the main findings. We discuss the results and investigate the mechanisms in Section 6. In Section 7, we explore and discuss the generalizability of our proposed method and our substantive findings. Section 8 concludes with theoretical contributions, managerial implications, and future research directions.
2. Related Literature
Marketing research has recognized that consumers often need to process information from multiple modalities. Information from different modalities has distinct properties, contributes differently to the perceived meaning of the whole, and requires different underlying structures to analyze. Furthermore, consumers’ processing of information from multiple modalities tends to be interconnected and interdependent (Biswas and Szocs 2019, Grewal et al. 2021). In this section, we briefly summarize related research in text analysis, image analysis, and the interplay of the two data modalities in marketing applications and discuss how our paper contributes to the literature.
2.1. Text Analysis in Marketing Applications
As the most frequently used medium in market communication, textual data have long been analyzed to study consumer attitudes, behavior, and choices. Empirical studies in this stream have analyzed textual content generated by various sources, including consumers (online reviews, social media content, and offline word of mouth), firms (owned media, advertisements, and customer service agents), and other sources such as news and movies. Previous studies have analyzed how the sentiment and the semantic meaning of textual data provide marketing insights and how these insights are related with consumer preference and choice (Decker and Trusov 2010, Archak et al. 2011), motivations (Chung et al. 2022), default behavior (Netzer et al. 2019), market structure and competitive landscape (Lee and Bradlow 2011, Netzer et al. 2012), and firms’ stock performance (Tirunillai and Tellis 2012). Our research contributes to the line of literature that examines how the semantic meaning of firm-generated text influences consumer preference and choice.
Automated textual analysis tools that have been applied in marketing include methods such as entity extraction, topic modeling, and relation extraction (see Berger et al. (2020) for a detailed review). Among the most recent developments, relation extraction techniques such as Word2Vec (Mikolov et al. 2013) and BERT (Devlin et al. 2018) provide a powerful tool to extract semantic information from textual data. This group of techniques uses deep-learning models to reconstruct word representations via a vector space so that the distance between word vectors reflects the semantic (dis)similarities between them. For example, Timoshenko and Hauser (2019) used word embedding to identify customer needs from online user-generated content and showed that the insights extracted through large-scale automatic text mining are comparable to those identified through traditional qualitative marketing research.
2.2. Image Analysis in Marketing Applications
In parallel to text analysis, marketing literature has recognized that imagery components in advertising are very effective in capturing attention and affecting preference (Pieters and Wedel 2004, Li and Xie 2020). Various image attributes, including image aesthetics (such as colorfulness and color composition), image content, and image quality have been identified to affect consumer perception and choice. Valdez and Mehrabian (1994) found that colorfulness, including color saturation and lightness, drives pleasure and arousal. Finn (1988) and Wedel and Pieters (2015) showed that the consumer’s attitude toward advertisements can be affected by visual aesthetic characteristics such as the color contrast of an image. Deng et al. (2010) found that, although consumers generally prefer a small number of common colors, a contrasting color that highlights a single distinctive element of a product design can stand out and affect consumer preference. Hagtvedt and Patrick (2008) and Zhang et al. (2022) showed that high-quality images positively affect consumers’ evaluation of product and product sales. Li and Xie (2020) further reported that the colorfulness, the picture quality, and the presence of human faces attract more engagement and sharing on social network platforms.
Although many of these studies used human annotators to extract predefined attributes, more recent studies have adopted machine learning methods to automatically identify image features. Using Airbnb data, Zhang et al. (2022) applied machine learning to explore which lower-level image attributes can influence perceived image quality and therefore affect demand. They identified systematic differences between verified and unverified images pertaining to several interpretable attributes and quantified the value of verified photos as thousands of dollars on average. Dzyabura and Peres (2021) used a visual elicitation platform and created a mapping between brand visuals and brand characteristics. Hartmann et al. (2021) leveraged deep-learning methods to identify consumer-selfie images and brand selfies, finding that the former receive more user engagement whereas the latter bring more brand engagement. Furthermore, Feng et al. (2021) applied a deep-learning approach to facial images to predict celebrity visual potential. Troncoso and Luo (2022) examined the fit between the profile pictures of applicants and job posts on a freelancer website and found that a higher fit leads to a higher likelihood of being hired.
2.3. Image-Text Congruence and Consumer Preference
As multimodal product presentation becomes the status quo on many online platforms, an important question arises: How do image and text jointly affect consumer perception and choice? In particular, researchers are increasingly interested in the effect of image-text congruence, that is, the degree to which different modalities of data holistically adhere to the general focus of the plot.
Among the few existing empirical studies, the fit between image and text content is generally reported to have a positive effect on consumer outcome. Li and Xie (2020) examined how the degree of relevance between the image and text content affects user engagement on social media. They found that image-text fit increases liking by 42.5% on Twitter compared with the lack of image-text fit. Using the hotel-booking context, Van Rampay et al. (2010) also reported a positive correlation between image-text congruence and consumer preference and showed that the effect is mediated by information processing fluency.
Interestingly, both Li and Xie (2020) and Van Rampay et al. (2010) proposed potential boundary conditions for the effect of image-text fit. In contrast to the positive effect on Twitter, Li and Xie (2020) found no such effects on Instagram. They attributed the difference to the potential impacts of platform contexts: users primarily visit Instagram for high-quality photos while they visit Twitter for breaking news or stories, and therefore, the image-text fit contributed more to user engagement on Twitter than on Instagram. Van Rampay et al. (2010) identified that the mediation effect of information fluency is conditional. There could be situations where the incongruity between the image and the text could attract attention by signaling that “there is something going on.” When this happens, incongruence could result in positive effects on consumer preference.
The different effects of image-text congruence seem to suggest that congruence could be a multidimensional concept and that the effect of each dimension depends on the information-processing mechanisms evoked in specific empirical contexts. As a classic work, Heckler and Childers (1992) decomposed image-text congruence into relevancy and surprise. Relevancy is defined as “material pertaining directly to the meaning of the theme.” For example, the image and text in a print ad would be considered relevant if the information contained in the stimulus contributes to, rather than distracts from, the primary message being communicated. Relevancy improves consumer attitude and choice through information processing fluency, which is consistent with the findings in Van Rampay et al. (2010). The second dimension, surprise, or equivalently, unexpectancy, is negatively associated with congruence. It refers to the degree to which a piece of information deviates from some predetermined pattern or structure evoked by the theme (Houston et al. 1987). Contrary to relevancy, surprise drives the effect of congruence on consumer attitude in the opposite direction through “intriguing consumers by presenting a puzzle to be solved.” Thus, relevant but unexpected information can evoke additional elaboration processing and thus increase memory and recall (Heckler and Childers 1992) and lead to favorable evaluation responses (Lee and Mason 1999).1
Current substantive understanding on the effect of image-text congruence, however, suffers from some limitations. First, most existing research in this domain has been conducted in laboratory experiments (Heckler and Childers 1992, Lee and Mason 1999, Van Rampay et al. 2010), so large-scale empirical research is needed to examine image-text congruence in the real-world context. Our research fills this gap and answers the call to study the interactive effect of multiple modalities on consumer information processing (Grewal et al. 2021). Second, existing research has largely measured image-text congruence using a dichotomous scale (Heckler and Childers 1992, Lee and Mason 1999, Van Rampay et al. 2010, Li and Xie 2020), that is, congruence versus incongruence as a whole or along the subdimension of relevancy and expectancy. The lack of granular measurement on image-text congruence may lead to the overlooking of complex relationship such as nonlinear effects of congruence on consumer preference. To overcome this limitation, we adopt a two-branch neural networks model and measure the degree of congruence between the information embedded in the image and text, respectively. With this more advanced metric, our paper uses large-scale real-world data and identifies a nonlinear effect of image-text congruence on consumer choice, thereby making a substantive contribution to the literature.
Lastly, it is worth mentioning that our research is different from the studies that contrast visual and textual stimuli. For example, Pieters and Wedel (2004) compared pictorial and text elements and found that the former captures consumer attention better than the latter in print ads. Zhang and Luo (2022) found that user-posted photos in online reviews have a positive impact on restaurant survival beyond the textual review content. Instead of evaluating which stimulus is more effective, our research focuses on understanding how the semantic relationship between image and text affects consumer choice and why. Insights from our study will have important managerial implications on how to best couple multiple modalities of media to achieve positive consumer outcomes.
3. Measuring Image-Text Congruence: A Deep-Learning Approach
Despite the long-recognized importance of image-text congruence (Dew and Ansari 2018, Li and Xie 2020), image and text are two modalities of data that are difficult to compare directly. Measuring image-text congruence has been challenging, especially when the goal is to create a metric in an automatic and scalable manner. Drawing on recent developments in computer vision (CV) (He et al. 2016) and natural language processing (NLP) (Devlin et al. 2018), we adopt a deep-learning approach and use the architecture of two-branch neural networks to measure the semantic congruence between two different modalities (image and text). Next, we describe our deep-learning model setup to measure the image-text semantic congruence and present some examples to illustrate our metric output.
3.1. Two-Branch Neural Networks for Image-Text Congruence
Built on the architecture of two-branch neural networks (Wang et al. 2018, Wei et al. 2020, Xu et al. 2020, Ge et al. 2021), our proposed approach extracts semantic meanings from image and text, respectively, and connects the two-branch networks with a prediction network layer (transforming two modalities into a common modality) to jointly train the prediction model with human annotations. Figure 1 depicts our model architecture. In sum, our approach takes three steps: (1) embedding the cross-modality data (i.e., image and text) into respective numerical vectors, (2) computing the distance between the vectors to measure the (dis)similarity, and (3) optimizing the loss function between the predicted similarity and the human-annotated congruence data based on back propagation. Next, we provide an overview for each of the three steps.
Step 1: We first use embedding methods to extract semantic meanings from raw data. For image processing, we adopt the Wide-ResNet-50-2 embedding (WRN-50-2) (Zagoruyko and Komodakis 2016), which is pretrained on ImageNet and is an improved modification of the WRN method. As an advanced image embedding method, WRN widens the residual blocks with shallow depth and outperforms the traditional residual network (ResNet) method on many vision tasks including image classification and object detection (Zagoruyko and Komodakis 2016). In our model, the adopted WRN-50-2 is set with a depth of 50 and a widening factor of 2. For text analysis, we adopt BERT, which has been proposed to generate an embedding vector for each word (or text chunk) by directly learning from the context rather than using predesigned statistical algorithms such as TF-IDF (Devlin et al. 2018). The core idea is to pretrain the network on a gigantic corpus such as Wikipedia and web pages so that universal semantic embeddings can be generated. In this research, we adopt the BERT-based embedding pretrained on Chinese Wikipedia (Cui et al. 2020). For more details on our image and text embeddings, please see Online Appendix A.
Step 2: In the next step, we jointly process image and text embeddings to understand the semantic congruence between these two media modalities. To achieve this goal, the backbone of our approach involves representing the two modalities into a common modality (Hardoon et al. 2004) and then calculating the (dis)similarity.
As illustrated in our two-branch model (Figure 1), the left branch encodes the image RGB into image embeddings and the right Transformer encodes text tokens into text embeddings. Then, we fix the parameters of all layers of the image embedding except the last fully connected layer, and reinitialize the vectors, so that the output image embedding has the same length as the output dimension of the text. In our case, the last embedding layer of ResNet50 outputs 2,048 dimensional features (i.e., ) and BERT outputs 768 dimensional features (i.e., ). We reinitialize the last fully connected layer of ResNet50 as a 2,048 × 768 matrix (denoted as ). All parameters of ResNet50 before this fully connected layer are frozen and untrainable.2
After the transformation in the last layer, the embeddings of the two branches result in the same dimension. We then calculate our model-based congruence using cosine similarity: Here, the cosine similarity ranges between –1 and 1. The larger the cosine similarity values, the smaller the angle between the vectors, the closer the semantic meaning between the image and text. We choose cosine similarity because it measures the angle between two vectors and is not affected by the length of vectors.3 When the vectors are not normalized by preprocessing, cosine similarity is highly desired. This is especially true for texts, because the length of texts often varies across different samples (Young et al. 2014, Wang et al. 2018, Dhillon and Aral 2021).
Step 3: In the last step, we train the model with human-annotated data on image and text congruence. The formalization of our model and the loss function can be written as , where yi denotes the true image-text congruence and denotes the model output, .
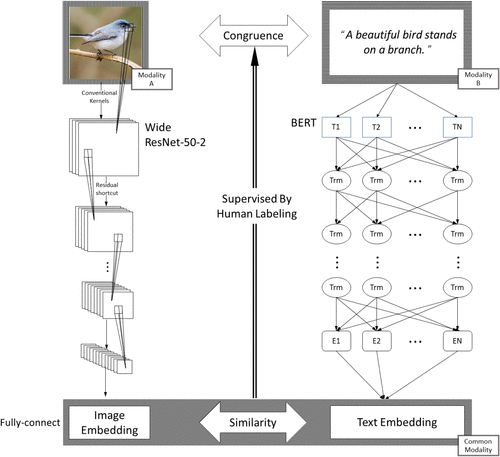
Note. Source of the bird image used in illustration: National Park Service.
Because WRN and BERT are pretrained on hyperscale datasets such as ImageNet (Deng et al. 2009) and Wikipedia to generate universal semantic embeddings, they can be fine-tuned with a small amount of labeled data to accommodate the specific task at hand (Bengio 2012, Tan et al. 2018). In our study, we randomly sample 4,000 pairs of image and text. For each pair, three independent annotators from a major U.S. research university rate the level of congruence between the image and text and the average score is used as the ground truth. See Online Appendix C for an illustration of the annotation interface. With the ground truth, we implement the model using PyTorch with the default PyTorch SGD setting.4 For parameter tuning, the image-text pairs are split into a training set of 3,700 pairs, a validation set of 100 pairs, and a test set of 200 pairs. The model parameters are then estimated through supervised learning by minimizing the mean squared error (MSE) between the predictions and the ground-truth labels.5 The convergence plot indicates that the loss function for both the training and the test set achieved satisfactory performance. The correlation between our predicted score and the ground truth is 0.78 and the MSE is 0.03. Please see Online Appendix D for more details on model training.
3.2. Congruence Prediction Illustration
To illustrate the congruence measure predicted by our model, we select three pairs from our sample, which correspond to low, medium, and high congruence between the image and text. Table 1 presents the image, the text, and the model-predicted congruence score for each pair. As seen there, our model output demonstrates a reasonable level of agreement with human interpretation. For the first pair, our model predicts the congruence to be low (0.23), which seems reasonable as the text does not describe the image well and the mention of “seaweed” and “magical grass” is unexpected based on the image. For the pair in the middle, the text mentions the winter and snow, which is somewhat related to the content of the image. Accordingly, our model predicts the congruence to be 0.59. Finally, the text and the image in the last pair are related to the idea of “School of Elephants: A Trip to the Zombie Land,” which matches the high prediction (0.81) from our model.
|

Table 1. (Color online) Predicted Congruence Score for Three Examples of Image-Text Pairs
| Image | Text | Congruence prediction |
|---|---|---|
 | Who Wouldn’t Want to Be a Piece of Seaweed Deep down on the red sea’s ocean floor, there is a patch of magical grass unreachable by the outside world. | 0.23 |
 | What Do You Get from Mixing Snowflakes and Salt The north’s winter means chilly weather and swirling bouts of snow. In the midst of this beauty lies hassle for commuters. How can we make the snow go away? | 0.59 |
 | School of Elephants: A Trip to the Zombie Land Hello dear friends, the four troublemakers from the School of Elephants are back! What adventure do they have to share this time? Let’s start reading! | 0.81 |
Note. The congruence score was predicted by our two-branch neural network model.
4. Empirical Study and Modeling
In this section, we apply our deep-learning method to an empirical setting to measure image-text congruence and examine how this construct affects consumers’ product choice decision. Data for this analysis come from a leading platform company specializing in K–12 extracurricular online reading in China. The company offers a mobile app providing ebooks and audiobooks for elementary and middle-school students. Users pay a one-time subscription fee to consume the reading content, and once subscribed, they have unlimited access to all materials on the app. No other fees or in-app purchases are needed to consume the content.
4.1. Sample Description
The collaborating firm provides a random sample of 15,966 unique users (20% of the total user base) and their consumption activities over a period of seven months from June to December 2019. Table 2 presents the summary statistics. Across all users, the average age is 10.42 (standard deviation (SD) = 2.26) years, with an even split between boys and girls. A unique aspect of our data is that we can observe the complete time series of consumption for a user after she/he joins the app. Our observations are organized by “product session.” Each product session corresponds to an incidence during which a user consumed the content of a product. A product session begins when a user starts to browse a product and ends when the user starts to browse another product or stays inactive for more than five minutes. Note that our research objective is to study the choice of new products. Therefore, we exclude the sessions if the product is a repeated choice. In our final sample, each user on average has 8.72 sessions (SD = 12.04) and the most frequent user has 233 sessions in our data.
|
Table 2. Descriptive Statistics of Users and Sessions
| Measure | N | Mean | Standard deviation | Minimum | Maximum |
|---|---|---|---|---|---|
| By user | |||||
| Age | 15,966 | 10.42 | 2.26 | 5 | 16 |
| Gender (1 = male, 0 otherwise) | 15,966 | 0.50 | 0.50 | 0 | 1 |
| Number of sessions | 15,966 | 8.72 | 12.04 | 1 | 233 |
| By session: Duration (min) | |||||
| All sessions | 138,920 | 16.31 | 29.18 | 0.03 | 325.78 |
| Audiobook sessions | 74,196 | 19.33 | 31.55 | 0.03 | 325.78 |
| ebook sessions | 64,724 | 12.85 | 25.77 | 0.03 | 325.52 |
Notes. The users are the young readers using the app. Sessions refer to the instances of product consumption.
The bottom panel of Table 2 presents the summary statistics for the sessions. There are two product categories on the app: audiobooks and ebooks. Out of the 138,920 product sessions in our data, roughly 53.4% (n = 74,196) are audiobook sessions and the remaining 46.6% (N = 64,724) are ebook sessions. Each session on average lasts 16.31 minutes, with audiobook sessions lasting longer than ebook sessions.
One might wonder whether and how the image-text congruence of an audiobook or ebook is related to its propensity to be chosen by consumers. To gather some model-free evidence, we apply the deep-learning model developed in Section 3 to predict the image-text congruence for each product,6 and then split products into 10 groups based on the congruence deciles, where Group 1 corresponds the lowest congruence level and Group 10 the highest. Within each congruence group, we obtain the average consumption incidences across the products and plot the averages by congruence groups in Figure 2. An interesting U-shaped pattern emerges from our data pattern: On average, products with high or low image-text congruence had higher propensity to be chosen, whereas those with a medium level of image-text congruence had a lower average consumption incidence.7 This initial evidence has not yet accounted for the many other control variables that could also influence readers’ choice. Nevertheless, it provides motivational evidence to formally model a nonlinear relationship between image-text congruence and consumer preference, which we present in detail in the next section.
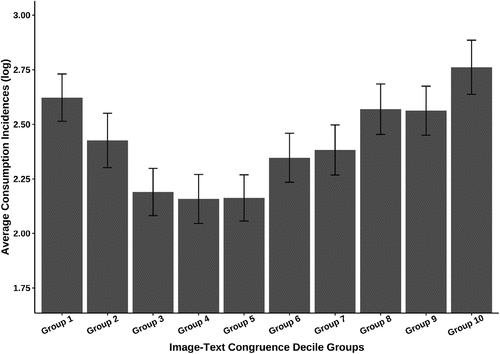
Notes. The bars represent the average consumption incidence for each decile group. The top and bottom error bars correspond to plus and minus one standard deviation, respectively.
Lastly, in a market for young users, one may wonder who makes the product choice decision: the young users, who consume the content, or their parents, who pay for the app. According to a customer survey conducted by the company, it is the young readers who choose the content they read. The usage pattern from our data offers another piece of supporting evidence. We find that peak usage occurs around dinner and bedtime, when parents are usually busy with household chores such as cooking and cleaning (see Figure A4 in Online Appendix E). During the daytime, usage peaks around noon to 1 p.m., when children are at school during lunch break. This provides suggestive evidence that the young users make the product choice on the app.
4.2. Modeling Approach
We now describe our empirical approach to examine how image-text congruence affects users’ product choice. It is assumed that user i derives utility Uijt from product j at time t, which is modeled in the following specification:
The key variable of interest, Congruencej, is the congruence score between product j’s cover image and its text description, which is the prediction outcome from our two-branch deep-learning model.8 As motivated by Figure 2, we include the quadratic term, , to capture a nonlinear relationship between image-text congruence and utility. In keeping with convention, we mean-center Congruencej (at the midpoint of its range, i.e., 0.5) to reduce potential multicollinearity between the linear and quadratic terms. The parameters β1 and β2 capture the linear and quadratic effects of image-text congruence on utility, respectively.
Next, the utility is also modeled as a function of image characteristics and text content characteristics, which we will describe in more detail in the next section. The model also includes variable Sessionit, denoting product session t for user i, where t = 1 is user i’s first consumption session during the data collection period, t = 2 is the second, and so on. Furthermore, the utility is allowed to vary by user age and gender. Note that if user i consumed the same product j multiple times (for example, reading a book again at a later time, either reading a different section or repeating the same section), our final sample includes only the first time the product was chosen. Excluding future repeated consumptions of the same product is reasonable for our research objective, because we study how consumers respond to the image and text stimuli when they encounter a new product for the first time.
Lastly, parameter αi captures the remaining utility variation among individuals, which is assumed to be normally distributed with mean α and variance . The idiosyncratic errors, , are assumed to be independent and identical (i.i.d.) following the extreme type I distribution. Thus, user i at time t chooses whichever product j maximizes his/her utility among all alternatives in the choice set, that is, for .
It is worth noting how user i’s choice set at time t, Ht, is defined for this analysis. By definition, Ht contains all the products considered by user i when making the choice decision at time t. However, empirical studies, including ours, often observe only the realized choices (also known as the positive cases) but not the entire choice set (i.e., the negative cases are unobserved by researchers) (Goldberg and Levy 2014, Chen et al. 2017). To overcome this challenge, we follow the convention in the empirical literature and, for each realized choice, create a random sample of the negative cases to construct the choice set. In our empirical setting, the app tends to feature more popular and more recent products, making such products more likely to occur in users’ choice sets than otherwise.9 Given these considerations, we adopt the weighted negative sampling method, which has become a popular method to create choice sets in the empirical literature (Goldberg and Levy 2014, Timoshenko and Hauser 2019, Chen et al. 2021). Specifically, for every product chosen in our data, the negative cases are a random sample of 50 products drawn from all the products being consumed on that day, with the selection probability proportional to each product’s popularity and release recency. By using this weighted random sampling method, the constructed choice sets contain more popular and newer products than a pure random sample and thus can better resemble the actual choice sets experienced by the users on the app.10
4.3. Control Variables
In addition to the congruence between the product’s cover image and the text description, users’ product choice could be affected by the characteristics of the image and the book content. In this section, we provide more details on these important control variables. Table 3 presents the summary statistics for the control variables.
|
Table 3. Descriptive Statistics of Image and Text Variables
| Variable | Mean | Standard deviation | Minimum | Median | Maximum |
|---|---|---|---|---|---|
| Congruence (predicted by model) | 0.71 | 0.11 | 0.19 | 0.71 | 0.92 |
| Congruence (from human annotation) | 0.72 | 0.12 | 0.05 | 0.73 | 1 |
| Image characteristics | |||||
| Image quality | 8.96 | 0.82 | 7 | 9 | 10 |
| Colorfulness | 0.48 | 0.18 | 0 | 0.49 | 0.89 |
| Color contrast | 0.09 | 0.10 | 0 | 0.06 | 0.91 |
| Color brightness | 202.42 | 39.43 | 32.25 | 210.56 | 254.35 |
| Color saturation | 136.06 | 44.07 | 7.12 | 142.3 | 247.79 |
| Number of objects | 7.57 | 2.40 | 0 | 8 | 10 |
| % Animal | 0.04 | 0.10 | 0 | 0 | 0.90 |
| % Human | 0.08 | 0.09 | 0 | 0.05 | 0.50 |
| % Nature | 0.05 | 0.10 | 0 | 0 | 1 |
| % Emotion | 0.02 | 0.06 | 0 | 0 | 0.50 |
| Content and text characteristics | |||||
| % Audiobook | 0.79 | 0.41 | 0 | 1 | 1 |
| Content quality | 3.16 | 0.94 | 2 | 3 | 5 |
| Text length | 53.39 | 48.75 | 0 | 42 | 464 |
| Topic 1 | 0.07 | 0.22 | 0 | 0 | 1 |
| Topic 2 | 0.09 | 0.25 | 0 | 0 | 1 |
| Topic 3 | 0.07 | 0.22 | 0 | 0 | 1 |
| Topic 4 | 0.14 | 0.29 | 0 | 0 | 1 |
| Topic 5 | 0.09 | 0.25 | 0 | 0 | 1 |
| Topic 6 | 0.06 | 0.19 | 0 | 0 | 1 |
| Topic 7 | 0.16 | 0.3 | 0 | 0 | 1 |
| Topic 8 | 0.09 | 0.25 | 0 | 0 | 1 |
| Topic 9 | 0.16 | 0.31 | 0 | 0 | 1 |
| Topic 10 | 0.06 | 0.2 | 0 | 0 | 1 |
Notes. The unit of observation is a product. There are 1,770 audiobooks and 468 ebooks in the sample.
4.3.1. Image Characteristics.
We construct the following visual variables to capture the aesthetic and content properties of a product’s cover image.
Image Quality: First, we measure the perceived image quality for each book cover, as research has shown that consumers are affected by the quality of an image in making product choices (Zhang et al. 2022). We recruit human annotators to evaluate the image quality through the question “how much do you rate the quality of the image (with 0 being the lowest and 10 being the highest).” On average, the images in our sample were rated with a high score (with a mean of 8.96 and a standard deviation of 0.82), which is expected because the app considers it important to create high-quality cover images for their products.
Colorfulness: Following Li and Xie (2020), we further create several variables to describe the color attributes of the images. To do so, we use the Google Cloud Vision API to extract up to 10 colors per image along with the corresponding pixel fraction (i.e., the fraction of area occupied by each color). From the extracted color elements, we generate three variables to measure the color composition of each image: colorfulness, color contrast, and color hue. A picture’s colorfulness is calculated as one minus the sum of the pixel fractions across the five colors with the highest fraction. Thus, the variable colorfulness measures the variety of an image’s color composition, with a higher value corresponding to a higher degree of color variety. For example, if an image contains just two colors, its colorfulness is zero (i.e., not colorful). In contrast, if an image contains 10 colors, each with 10% pixel fraction, the colorfulness equals , which is more colorful than the image with just two colors.11 In our sample, the average colorfulness is 0.48 (SD = 0.18) across the books.
Color Contrast: We define an image’s color contrast as the degree to which the colors “stand out” from each other. To construct this metric, we again use the top five colors in each image12 and compute the similarity between every pair of colors. The color similarity is defined as the cosine value of two vectors representing the color’s RGB code: a cosine value closer to one corresponds to two very similar colors, and vice versa for a smaller cosine value. Thus, an image’s color contrast is defined as one minus the average cosine similarity between all color pairs (i.e., 10 () pairs out of the top five colors). A higher color contrast value indicates high contrast and low similarity between the major colors of the image. The average color contrast is 0.09 (SD = 0.10) in our sample.
Color Hue: To control for the overall color of the image, we also construct a hue variable, which refers to the origin of the colors that one can see. This hue variable is defined as the average of the RGB values across all colors extracted by Google Cloud Vision API, with each color’s RGB weighted by the corresponding pixel fraction. Thus, the hue variable is the composite RGB to capture the overall color tone of each image. Online Appendix F presents some examples of the hue variable in comparison with the original color composition.
Color Brightness: In addition, previous literature has shown that color brightness and saturation could also influence consumers’ emotion and perception (Valdez and Mehrabian 1994, Wilms and Oberfeld 2018). Brightness reflects the relative lightness or darkness of a particular color, with the black color being the lowest brightness and the white color being the highest brightness. In this research, we use an online open-source tool to measure these two variables.13 Each image in our sample has an overall level of brightness, which equals the average pixel brightness across all the pixels of the image.
Color Saturation: Saturation measures the intensity and vividness of a hue, ranging from a gray tone (no saturation) to a pure and vivid color (high saturation). The higher the saturation, the more intense and vivid the color is. The lower the saturation, the closer the color is to pure gray on a grayscale. Similar to brightness, an image’s saturation is the average pixel saturation across all the pixels of the image.
Image Objects: Lastly, the objects in an image, such as the presence of an animal or a human face, may also affect consumer attitude (Li and Xie 2020). We again use Google Cloud Vision API to extract the objects contained in each image. The API compares an image’s pixel components to pretagged patterns and yields up to 10 object labels per image. The labels are further classified into object groups, depending on whether the labels refer to objects from the same category such as buildings, animals, and nature objects. For each image, we summarize the content using the number of objects identified and the percentage of objects belonging to each of the five largest categories: animal figures, human faces, nature objects, emotions, and other. The images in our sample have an average of 7.57 object labels identified (SD = 2.40), with the median being 8 objects.
4.3.2. Content and Text Characteristics.
In this section, we describe control variables related to the content and text description of the products. First, we control for the product category, that is, whether the product is an audiobook or ebook.
Content Quality: We also control for the overall quality or attractiveness of the book content. This content quality index is a five-point scale (with one being the lowest and five the highest), which is internally created by the firm to capture the perceived attractiveness of each book. In our sample, the average content quality is 3.16 (SD = 0.94), with the median being three, indicating that the books on the app are approximately symmetrically distributed.
Text Length: The length of a product’s text description is also controlled for. On average, a product description contains 53.39 words with a standard deviation of 48.75 words, the median length of the description is 42 words. The text length is counted after removing the stop words.
Text Topics: We further extract topics from the text to control for the text content. To do so, we tokenize the text into keywords, remove the stop words, and perform topic modeling using the LDA (Latent Dirichlet Allocation) model. In our application, 10 topics are identified from the text descriptions. For the purpose of our analysis, we do not assign a meaning for each topic. Rather, the distribution over topics for each text directly enters our model as the control variables.
To sum up, the control variables for our model include the characteristics associated with the cover image as well as the text description. Next, we present the parameter estimates for image-text congruence and for the control variables. Note that when applicable, the control variables are all mean-centered to reduce potential multicollinearity.
4.4. Parameter Estimates
In this section, we present our parameter estimates for Equation (1). To gain a deeper understanding on the effect of image-text congruence, we include the control variables in sequence: first the variables related to image characteristics (Model 1), then the variables related to content and text characteristics (Model 2), and finally all control variables in the full model (Model 3). The results and the clustered standard errors are presented in Table 4. The first thing to note is that the coefficients for image-text congruence remain statistically significant in all three models, suggesting that the congruence between a book’s cover image and its text description plays an important role in consumers’ choice of audiobooks and ebooks.
|
Table 4. Parameter Estimates from Main Models
| Variable | Model 1 | Model 2 | Model 3 | |||
|---|---|---|---|---|---|---|
| Estimate | Clustered standard error | Estimate | Clustered standard error | Estimate | Clustered standard error | |
| Congruence linear | −1.366*** | 0.057 | −0.702*** | 0.066 | −0.836*** | 0.064 |
| Congruence quadratic | 3.273*** | 0.161 | 1.700*** | 0.177 | 1.563*** | 0.179 |
| Image quality | 0.051*** | 0.003 | 0.040*** | 0.003 | ||
| Colorfulness | 0.586*** | 0.026 | 0.598*** | 0.027 | ||
| Color contrast | −0.283*** | 0.032 | −0.044 | 0.035 | ||
| Color brightness | −0.076*** | 0.005 | −0.079*** | 0.005 | ||
| Color saturation | 0.069*** | 0.004 | 0.034*** | 0.005 | ||
| Hue red | 0.001*** | 0.0001 | −0.0003** | 0.0001 | ||
| Hue green | −0.001*** | 0.0001 | −0.0004*** | 0.0001 | ||
| Hue blue | 0.004*** | 0.0001 | 0.0028*** | 0.0001 | ||
| Number of labels | 0.014*** | 0.002 | 0.024*** | 0.002 | ||
| % Animal | −0.287*** | 0.068 | −0.188* | 0.074 | ||
| % Human | 0.016 | 0.040 | 0.432*** | 0.042 | ||
| % Nature | −0.939*** | 0.046 | −1.373*** | 0.052 | ||
| % Emotion | 1.473*** | 0.033 | 0.827*** | 0.034 | ||
| Audiobook | −0.120*** | 0.010 | −0.112*** | 0.010 | ||
| Content quality | 0.049*** | 0.006 | 0.049*** | 0.006 | ||
| Text length | −0.012* | 0.005 | −0.069*** | 0.005 | ||
| Topic 1 | 0.339*** | 0.023 | 0.248*** | 0.023 | ||
| Topic 2 | 0.749*** | 0.022 | 0.708*** | 0.022 | ||
| Topic 3 | 0.336*** | 0.024 | 0.254*** | 0.024 | ||
| Topic 4 | −0.005 | 0.022 | 0.059** | 0.022 | ||
| Topic 5 | −0.059* | 0.024 | −0.075** | 0.025 | ||
| Topic 6 | 0.083** | 0.025 | 0.068* | 0.026 | ||
| Topic 7 | 0.107*** | 0.025 | 0.120*** | 0.025 | ||
| Topic 8 | 0.152*** | 0.022 | 0.074** | 0.023 | ||
| Topic 9 | 0.329*** | 0.022 | 0.276*** | 0.021 | ||
| Session | 2.1E-5 | 3.5E-5 | −1.7E-4* | 4.1E-5 | −1.2E-4 | 3.9E-5 |
| Age | 0.007*** | 0.001 | 0.003*** | 0.0005 | 0.001** | 0.0004 |
| Gender (male = 1) | 0.024*** | 0.002 | 0.021*** | 0.002 | 0.016*** | 0.002 |
| Intercept | −4.298*** | 0.022 | −4.000*** | 0.021 | −4.266*** | 0.030 |
| Individual random effect | Included | Included | Included | |||
| Log likelihood | −653,418.3 | −654,046.2 | −650,822.3 | |||
| AIC | 1,306,873 | 1,308,126 | 1,301,705 | |||
| BIC | 1,306,959 | 1,308,208 | 1,301,849 | |||
| Number of parameters | 18 | 17 | 30 | |||
Notes. The unit of observation is a choice incident. The number of observations is 6,623,999 from 15,966 users. The standard errors are clustered at user level. Variable congruence is mean-centered at 0.5, that is, the middle point of the congruence range.
*** ** *.
Next, we interpret the results based on the full model. For image-text congruence, the linear effect is estimated to be negative and significant (–0.836, p < 0.001) and the quadratic effect is estimated to be positive and significant (1.563, p < 0.001), indicating a nonlinear relationship between image-text congruence and preference. This positive quadratic effect suggests that, everything else being equal, user preference toward a product is higher when there is either a low or a high degree of congruence between the product’s cover image and its text description. The linear effect for congruence indicates where the lowest utility occurs. Note that the congruence variable is centered at the middle point (i.e., 0.5). The estimates from Model 3 indicate that the lowest utility corresponds to the level of congruence being approximately 0.767 (), slightly higher than the mean of 0.710 (Table 3). Furthermore, the first derivative was –1.804 when congruence is at the minimum value and 0.484 when congruence is at the maximum value, confirming a U-shaped relationship between congruence and user preference. In Section 6, we provide additional details on this effect and discuss potential mechanisms.
Furthermore, the image’s visual features are found to affect consumer choice. Books with higher image quality are associated with higher likelihood of being chosen (0.040, p < 0.001). Those with more colorful cover images (0.598, p < 0.001), lower color brightness (–0.079, p < 0.001), and more color saturation (0.034, p < 0.001) are also more likely to attract consumers. In terms of image content, our results show that the number of detected objects is positively associated with choice (0.024, p < 0.001): on average, presenting more objects in the cover image helps choice. Among the types of objects, consumers respond more positively to human faces (0.432, p < 0.001) and emotions (0.827, p < 0.001), but negatively to animals (–0.188, p < 0.05) and nature objects (–1.373, p < 0.001), which perhaps reflects readers’ content preferences across genres. Lastly, products’ content and text characteristics also matter for consumer choice. Overall, consumers prefer ebooks over audiobooks (–0.112, p < 0.001). Those with higher perceived content quality have a higher propensity to be chosen (0.049, p < 0.001). The length of the text description and the topics identified from LDA analysis are all found to be associated with consumer choice, although the magnitude of each effect varies.
5. Controlled Experiment
The empirical analysis in Section 4 has identified a novel finding that consumers respond more positively when the congruence level between a book’s cover image and its text description is either high or low. In contrast, all else being equal, consumers least prefer a product when its image-text congruence is at a medium level, resulting in a conspicuous “dull zone.” To the best of our knowledge, this U-shaped relationship has not yet been documented in extant research, especially when we consider empirical studies based on large-scale real-world data. Despite its novelty, this finding still reflects correlational evidence and is not causal. For example, unobserved product quality may be the true reason explaining the relationship between image-text congruence and consumer preference. In this section, we address this endogeneity concern by conducting a controlled experiment to establish the causal effect of image-text congruence on consumer choice.
5.1. Experimental Design
To form a causal inference, the ideal method would involve two steps: (1) we manipulate the congruence level of the image-text pair without affecting the other features of the image or the text, and (2) we measure how the change in congruence level affects consumers’ product choice. This experimental design, however, faces implementation challenges. When manipulating the congruence level by modifying the image or text, we would unavoidably alter the information contained in the image or the text as well. In other words, the variation in the image-text congruence would be confounded with the variation in the image or text, violating the exogeneity requirement for variable manipulation.
To address this challenge, we manipulate the congruence level by rematching existing pairs of image and text rather than modifying the content of the image or text. By doing so, we can change the congruence level without introducing additional variation to the image and text content. The content of image and text can further be controlled for using the fixed effects in subsequent analysis. However, another issue emerges: Randomly rematching images and texts may yield a pair that has extremely low congruence, which may seem odd or even unrealistic in a real-world setting. For example, in real life, a book cover showing children playing at school is unlikely to be coupled with a description explaining how dinosaurs went extinct millions of years ago. Given these considerations, we use a stratified factorial design for our controlled experimental study.
Our experiment proceeds as follows. First, from our data set, we select six themes of image-text pairs (for example, “nature and outdoor activities,” “fantasy and adventure,” and “family and friends”), and within each theme we further select three books whose cover image and text description have a high congruence level. Books from the same stratum share a similar theme, and thus theme serves as a stratification variable for our design. Second, we shuffle and rematch the images and texts within each theme group. Because rematching breaks the original image-text pair, the resulting pairs would be expected to result in a lower level of congruence than the original pairs, yielding the needed variation in congruence. Meanwhile, because rematching is done within each stratum, the resulting pairs are likely to preserve a minimum level of congruence, ensuring the external validity. In sum, through the rematching process within each theme group, we end up with three original pairs and six () rematched pairs per theme group.
5.2. Manipulation Check
We first validate that our manipulation introduces variation to the image-text congruence level. A total of 300 participants were recruited for this study via Prolific.com. We randomly assigned three out of six theme groups to each participant. Within each theme, the participant was assigned with three pairs, yielding a total of nine pairs (i.e., 3 theme groups × 3 pairs). Then, each participant was asked to evaluate the image-text congruence on a nine-point scale (“To what extent do you think the image matches the text description?”: 1 = “Not matched at all” and 9 = “Very well matched”). See Online Appendix H for examples of the original and rematched image-text pairs.
Results show that our manipulation process successfully generated variation in congruence. Overall, the original pairs were rated high in congruence (mean = 8.44, SD = 0.34) and the rematched pairs were rated with lower congruence levels (mean = 3.20, SD = 1.52, t-test = 166.05, p < 0.001).
5.3. Experimental Results
For the main experiment, we recruited 125 participants from Prolific.com to examine the effect of image-text congruence on product preference.14 Every participant was asked to perform a product choice task for each of the six theme groups. For each theme, the participant was randomly assigned with a choice set with three options, where one option is the original image-text pair and the other two options are the rematched pairs.15 The order of original and rematched pairs within a choice set is randomized throughout the experiment. After being exposed to each choice set for eight seconds (to ensure attention), the participant was asked to select “which book are you interested in reading the most?” (see Figure A6 in Online Appendix H for the experiment interface). Note that in our experiment, we ask the participants to choose a product rather than rate their preference for a product, so that our experimental design can better resemble the empirical context under which users make product choice decisions. Lastly, to ensure incentive compatibility, after finishing the selections on all themes, the participants were asked to read a book chapter randomly selected from their preferred books. We ensured that all participants were aware of this incentive compatibility design when they started the experiment.
We collected responses from 120 completed participants. Each participant generated choice outcomes among three alternatives (pairs) for each of the six themes. Participants’ product choices are analyzed using logistic regression, with the variables including the image-text congruence (both linear and quadratic terms), the theme fixed effects, the image fixed effects, and the text fixed effects. The results are presented in Table 5. We note that the controlled experiment replicated our main finding from the observational data: There is a U-shaped relationship between the congruence level and participant choice after controlling for all the fixed effects. Specifically, participants are more likely to choose an image-text pair when the congruence between the image and text is either high or low. In contrast, when the same image (or text) is paired with another text (or image) to create a medium level of congruence, participants’ likelihood of choosing the pair decreases.
|
Table 5. Parameter Estimates from Experimental Study
| Variable | Model 1 | Model 2 | ||
|---|---|---|---|---|
| Estimate | Standard error | Estimate | Standard error | |
| Intercept | −0.886*** | 0.086 | −0.997*** | 0.265 |
| Congruence linear | 0.745*** | 0.172 | 0.667** | 0.220 |
| Congruence quadratic | 2.367* | 0.922 | 2.868* | 1.257 |
| Theme fixed effects | Included | |||
| Image fixed effects | Included | |||
| Text fixed effects | Included | |||
| Deviance | 2,714.2 | 2,582.8 | ||
| AIC | 2,720.2 | 2,646.8 | ||
| No. of observations | 2,160 | 2,160 | ||
| No. of respondents | 120 | 120 | ||
Notes. Model 1 excludes and Model 2 includes the fixed effects. Congruence is rescaled to range between zero and one and then mean-centered to enter the model estimation, so that the estimates can be interpreted in the same manner as in our main model.
*** ** *.
6. Mechanism Analysis
In this section, we focus on understanding the mechanism underlying our main finding of the U-shaped relationship between the image-text congruence and consumer choice. As summarized in Sections 4 and 5, consumers are more likely to choose a product when the image-text congruence is either high or low and are less likely to do so when the congruence level is at the medium level. This U-shaped effect seems to suggest that the congruence between the two stimuli influences consumers in a rather complex way. Next, we turn to information processing theories to understand the effect of image-text congruence.
6.1. Decomposing Image-Text Congruence
Understanding how and why image-text congruence affects consumers is of critical importance for researchers and practitioners in designing and optimizing product communication. We turn to the literature in cognitive psychology and consumer behavior to explore the potential underlying mechanisms. Research in information processing has examined multimedia advertising (involving print and video) and proposed two underlying constructs that may contribute to the effect of congruence between different media formats: relevancy and surprise (Houston et al. 1987, Heckler and Childers 1992, Lee and Mason 1999). Relevancy is defined as the material pertaining directly to the meaning of the theme. When two sources have relevant content, the information contained in one stimulus contributes to (rather than distracts from) the theme or message being communicated in the other stimulus. When two stimuli are highly relevant, they evoke information processing fluency (Hastie 1980, 1981; Srull 1981; Srull et al. 1985), leading to increased consumer preference.
Surprise, or unexpectancy, refers to the degree to which information contained in different stimuli deviates from the predetermined pattern evoked by the theme (Goodman 1980, Heckler and Childers 1992). When two information sources are high in surprise, consumers would perceive the content embedded in one source as unexpected and surprising relative to the content of the other. Research in cognitive psychology and consumer behavior has found that compared with expected information, surprise can raise attention and thus lead to more elaborative information processing and encoding, which in turn can boost recall and become a driver for preference (Heckler and Childers 1992, Lee and Mason 1999). This dichotomous framework unveils two underlying psychological drivers for consumer preference embedded in the concept of congruence: information processing fluency through relevancy and information elaboration through surprise (i.e., unexpectancy).16
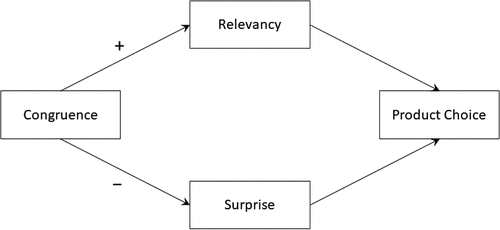
Following this literature, we focus on relevancy and surprise as our key underlying constructs to disentangle how these two dimensions are related to the congruence between product image and text descriptions and consequently affect consumer choice. In our context, relevancy between image and text measures how much one media contributes to the theme communicated by the other, and surprise reflects the extra elaboration evoked when consumers jointly process the information contained in the image and text. Imagine that a consumer sees a cover image and forms an expectation as to what the book is about. If the book summary conforms to the expectation, the image-text pair would be low in surprise. The same logic applies if the consumer processes the text stimuli first and bases the expectation on text. With these potential underlying constructs defined, we proceed to investigate how they drive the effect of congruence on consumer choice in our setting. Figure 3 summarizes the proposed framework.
6.2. Two-Driver Hypothesis: Empirical Evidence from Browsing Data
Thus far, we hypothesize that relevancy and surprise are the two underlying drivers that can explain how image-text congruence affects consumer preference. In particular, the effect of relevancy arises through information processing fluency, whereas the effect of surprise is related to information processing elaboration. If our postulation holds, one would expect consumers to spend more time deciding when they choose products of low image-text congruence than those of high congruence. After all, it takes less effort to process relevant information to construct a common theme (Hastie 1980, 1981; Srull 1981; Srull et al. 1985; Van Rampay et al. 2010).
To examine this hypothesis, we turn to our observational data and calculate the time that consumers spent on browsing and pausing before they chose each product. The products are categorized into three equal-sized groups according to their congruence level. The “Low” group is the products whose congruence score is in the bottom 35%, the “High” group is the top 35%, and the remainder is the “Mid” congruence group. Figure 4 depicts the average browsing time leading to a product choice for each group.
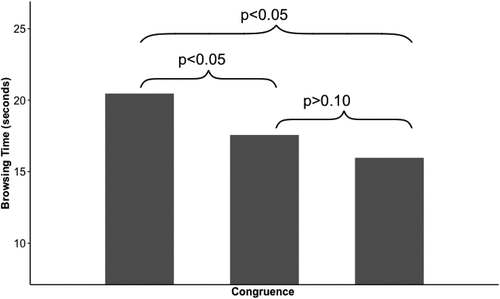
Notes. The bars depict the mean browsing time prior to choice by level of image-text congruence. The p-values are from Tukey post hoc comparisons following one-way ANOVA.
Overall, the decision time indeed decreases with the level of congruence. For the products with low image-text congruence, it takes the consumers the longest time to make a choice, compared with medium- or high-level congruence. One-way analysis of variance (ANOVA) with Tukey-adjusted post hoc tests indicate that the difference is statistically significant between the low-congruence group and the medium-congruence group (p < 0.05) or the high group (p < 0.05). The average browsing time for the medium congruence level is also higher than that for the high level, although the difference is not statistically significant (. The insignificant difference between medium and high level of congruence groups is perhaps because, although they spend the least time processing highly congruent information, consumers would still need at least some time to process the information, leading to a floor effect. As shown in Figure 4, information processing time is significantly longer when image-text congruence is low, which typically corresponds to the case when the image and text content are not consistent with each other (i.e., high surprise). This provides suggestive evidence that, for products with low image-text congruence, information elaboration and encoding are evoked in this process. On the other hand, the information processing time is the shortest when image-text congruence is high. This would be consistent with the expectation that information processing time decreases with information fluency. In the subsequent analysis, we formally test this hypothesis and examine how relevancy and surprise could explain the effect of congruence on consumer preference.
6.3. Online Study Design and Mediation Analysis
In this section, we conduct an online study to pin down the underlying mechanisms for the congruence effect. Graduate students from a research university in Asia were recruited to participate in this study. The participants were asked to rate relevancy and surprise (i.e., unexpectancy) for all image-text pairs in our observational study. Our measurement metrics closely follow the previous literature in this domain. To measure relevancy, past studies have treated the perceived relevancy between different pieces of information as a “subjective” and “contextual” judgment (Saracevic 1996, Mizzaro 1997). Therefore, we asked the participants to form an evaluation of image-text relevancy within a context (i.e., upon seeing the stimuli of the book’s cover image and summary): “Based on the cover image, how much do you think the text summary of the book is relevant”: one as “completely not relevant,” seven as “very much relevant”). To measure surprise, existing literature has used self-reported survey questions to capture the degree of surprise and examine its effect in the decision-making process (Meyer et al. 1997). For example, Davis and Bagchi (2018) asked participants to report the magnitude of surprise on a seven-point scale and further examined the role of surprise on consumers’ evaluation of price changes. We followed this literature and asked the participants: “Based on the cover image, how much do you think the text summary of the book is as expected”: one as “completely not expected,” seven as “very much expected”).17 In addition to relevancy and surprise, we also measured consumer preference, i.e., reading intention (“How much do you want to read this book”: one as “not at all,” seven as “very much”). Across all products, the mean relevancy is 4.55, with a standard deviation of 0.89. The average surprise is 3.90, with a standard deviation of 0.96. The average reading intent is 2.72 (SD = 0.95), where participants showed a low interest in reading the books, perhaps because the books are intended for younger readers. A screenshot of our online study interface is included in Online Appendix I.
First, to visually examine how relevancy and surprise are related to congruence, we plot the average relevancy and surprise by the three congruence groups in Figure 5. As expected, relevancy and surprise exhibit different patterns with congruence: whereas the average relevancy increases with congruence, the average surprise decreases with congruence. In other words, products with a high level of congruence tend to be high in relevancy but low in surprise, vice versa for products with a low congruence level. One-way ANOVA with Tukey post hoc tests indicates that the difference is statistically significant for every pairwise comparison in Figure 5. In addition to the visualization, we further fit a linear regression model, regressing the continuous congruence score on relevancy and surprise, controlling for other product characteristics as in Model 1. The coefficient for relevancy is estimated to be positive and significant (0.009, p < 0.001) and the coefficient for surprise is estimated negative and significant (–0.017, p < 0.001), confirming that, as expected, congruence is positively correlated with relevancy and negatively correlated with surprise.
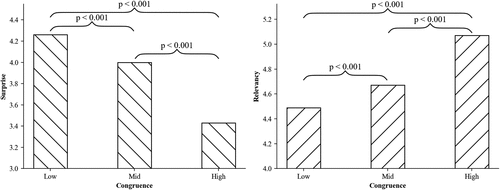
Notes. The left and right panels depict the mean Surprise and Relevancy by level of image-text congruence, respectively. The p-values are from Tukey post hoc comparisons following one-way ANOVA.
The descriptive pattern in Figure 5 establishes that relevancy and surprise vary significantly among the low, medium, and high congruence groups. However, this does not answer the question of whether relevancy and surprise are the underlying mechanisms that drive the effect of congruence on consumer choice. To provide direct evidence, we conduct a mediation analysis. The logic goes as follows. First, we replicate the U-shaped relationship between congruence and consumer preference using the data from this new study setting. Second, if relevancy and surprise are indeed the underlying drivers, one would expect the effect of congruence to diminish after relevancy and surprise are controlled for in the model.
Specifically, we perform the mediation analysis on the data following the Baron–Kenny approach (Baron and Kenny 1986). In step 1, we regress reading intention on congruence to obtain the total effect. Results (Model 1 in Table 6) confirm the U-shaped curve: The coefficient for the linear term is estimated to be 1.226 (p < 0.001) and the coefficient for the quadratic term is also positive and significant at 4.448 (p < 0.001). Note that all the control variables, that is, image and text characteristics as in Equation (1), are also included in this analysis. In step 2, we add relevancy (both linear and quadratic terms) into the regression (see Model 2 in Table 6). Two interesting results emerge from this model: (1) adding relevancy reduces the magnitude of the congruence effect (the estimated quadratic coefficient drops by 36%, from 4.448 in Model 1 (p < 0.001) to 2.863 in Model 2 (p < 0.01), and (2) the U-shaped effect of congruence remains statistically significant at 0.01 level with the presence of relevancy. Putting these together, Model 2 provides evidence that relevancy can partially explain the effect of image-text congruence; however, it does not fully account for the congruence effect. This result essentially answers the question posed in our title, “is relevancy everything?” Our analysis suggests that the answer is no, there is still remaining congruence effect that is orthogonal to relevancy.
|
Table 6. Mediation Analysis for Mechanism Study
| Variable | Model 1 | Model 2 | Model 3 | |||
|---|---|---|---|---|---|---|
| Estimate | Standard error | Estimate | Standard error | Estimate | Standard error | |
| Congruence linear | 1.226*** | 0.233 | 0.196 | 0.193 | −0.332 | 0.180 |
| Congruence quadratic | 4.448*** | 1.305 | 2.669* | 1.063 | 1.373 | 0.983 |
| Relevancy linear | 0.499*** | 0.023 | 0.342*** | 0.023 | ||
| Relevancy quadratic | 0.187*** | 0.016 | 0.043* | 0.017 | ||
| Surprise linear | −0.287*** | 0.023 | ||||
| Surprise quadratic | 0.147*** | 0.014 | ||||
| Intercept | 2.053*** | 0.548 | 2.285*** | 0.446 | 1.956*** | 0.411 |
| Control variables | Included | Included | Included | |||
| R2 | 0.100 | 0.405 | 0.496 | |||
| N | 2,238 | 2,238 | 2,238 | |||
Notes. The unit of observation is the products. The dependent variable is the average degree to which the respondent is interested in reading each book after viewing the cover image and the description of the text. The continuous predictors are all mean-centered.
*** ** *.
Lastly, we add surprise in Model 3, which assesses the direct effect of congruence after controlling for both relevancy and surprise. Results of Model 3 indicate that the quadratic effect of congruence further reduces to 1.373 and is no longer significant at 0.05 level. In contrast, relevancy and surprise are both estimated to be statistically significant (both linear and quadratic terms). Model 3 results confirm that relevancy and surprise fully mediate the effect of image-text congruence on consumer preference. In other words, the U-shaped relationship between congruence and preference seems to be driven by the degree of relevance and surprise between the product’s cover image and its text description.
In summary, our results so far confirm that (1) consumers respond more positively when image and text congruence is high or low, and (2) the effect of congruence is mediated through the relevancy and surprise between the two media. When the product image and text descriptions are high in relevancy and low in surprise (i.e., high in congruence), the high consistency between the two stimuli may evoke information processing fluency (Hastie 1980, 1981; Srull 1981; Srull et al. 1985; Van Rampay et al. 2010), leading to increased consumer preference. More interestingly, when image and text are low in relevancy but high in surprise, consumers perceive the two stimuli as low in congruence. Although low relevancy is negatively associated with utility, high surprise can lead to more elaborated information processing and encoding, which in turn can boost attention and become an underlying driver for choice (Heckler and Childers 1992, Lee and Mason 1999). These two effects work simultaneously but through different routes, leaving the medium congruence level as a dull zone for product preference in our empirical setting.
7. Generalizability and Discussion
In this section, we examine the generalizability of our proposed deep-learning approach and our main finding. In particular, we examine the movie industry and the home-sharing industry, where image and text are commonly used together to display products and therefore the image-text congruence would be expected to play an important role in consumer choice.
7.1. Context 1: Movie Industry
For the first generalizability setting, we turn to China’s IMDb, Douban (movie.douban.com), which is one of the largest movie review platforms in the world.
Data Collection. We selected a random sample of 2,000 movies and, for each movie, we extracted the poster image and the movie’s synopsis as the image-text pair. Following the same procedure used in our main setting, we conducted human annotation to code the image-text congruence for each movie. In addition, participants were asked how much they are interested in watching the movie. Figure A8 in Online Appendix J presents the user interface for this study.
Generalizability of Congruence Measure. The human-annotated image-text congruence scores are treated as the “ground truth” in our deep-learning algorithm. Following a similar procedure used in our ebook setting, we randomly split the movie data set into the training set (1,700), the validation set (100), and the testing set (200). The proposed model was repeated 10 times to test the robustness against randomness. The performance metrics indicate that our proposed deep-learning approach achieves good generalizability in terms of predicting image-text congruence in the movie setting. The Pearson correlation between the predicted congruence and the ground truth reaches 0.72 (in comparison with 0.78 in our main setting).
Generalizability of Congruence Effect. Next, we examine how congruence is related to consumer preference in the movie setting. To visualize the effect, we plot the average preference against the level of image-text congruence in Figure 6(a). Consistent with our finding in the main study, we identify a U-shaped relationship, which provides suggestive evidence that people’s interest in a movie is higher when the congruence level between its poster and synopsis is either high or low.
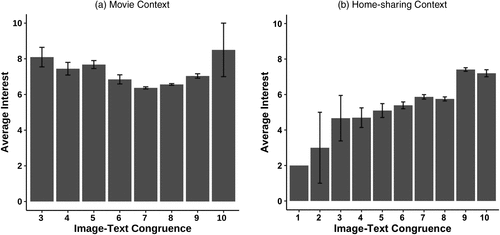
To further establish the causal inference, we conducted a controlled experiment for 10 popular movie genres (i.e., action, adventure, animation, drama, disaster, documentary, romance, science, sci-fi, and sports). Within each genre, we selected three movies whose poster and description have a high congruence level. Following the same design used in Section 5.1, we manipulated the congruence levels by shuffling and rematching the images and texts within each genre. By doing so, we obtained pairs of image and text with lower congruence scores, yielding the needed variation in congruence (Meanoriginal = 6.91, , t = 7.50, p < 0.001). Note that in this case, genre serves the same role as “theme” as in Section 5.1.
A separate group of participants were recruited on Prolific.com and a total of 119 passed the attention check. Each participant completed all 10 genres. Within each genre, the participant was shown three movies, where one movie has the original image-text pair and the other two are rematched pairs. The participant was then asked “Which movie are you interested in watching the most?” See Figure A9 in Online Appendix J for the experiment interface. To ensure incentive compatibility, participants were told that they would read detailed background information on one of the movies they chose, so that they were incentivized to reveal the true preference.
The results from the controlled experiment are presented in Table 7. We note that the quadratic term for congruence is again positive and significant in the movie data (2.916, p < 0.05), after controlling for the theme, image, and text fixed effects. Based on the estimated linear and quadratic coefficients, we can see that the lowest point of the U-shape occurs when the congruence level is 0.326, which is within the range of the congruence variable (between 0.106 and 0.859) in this setting, Furthermore, the first derivative was −1.282 when congruence is at the minimum value and 3.109 when congruence is at the maximum value. Thus, a U-shaped relationship between the congruence level and consumer’s preference is again identified using a controlled experiment, providing a causal interpretation underlying our main finding from the self-reported interest of watching. This is consistent with our findings from the online reading setting, suggesting that our substantive finding can be generalized to another setting, that is, the movies.
|
Table 7. Parameter Estimates for Controlled Experiment on Movie Context
| Variable | Model 1 | Model 2 | ||
|---|---|---|---|---|
| Estimate | Standard error | Estimate | Standard error | |
| Intercept | −0.773*** | 0.050 | −0.914*** | 0.261 |
| Congruence linear | 0.558** | 0.172 | 1.099*** | 0.234 |
| Congruence quadratic | 1.807* | 0.808 | 2.916* | 1.306 |
| Theme fixed effects | Included | |||
| Image fixed effects | Included | |||
| Text fixed effects | Included | |||
| Deviance | 4,531.0 | 4,351.5 | ||
| AIC | 4,537.0 | 4,455.5 | ||
| No. of observations | 3,570 | 3,570 | ||
| No. of respondents | 119 | 119 | ||
Notes. Model 1 excludes and Model 2 includes the fixed effects. As in the controlled experiment for our main study setting, congruence is rescaled to range between zero and one and then mean-centered to enter the model estimation.
*** ** *.
7.2. Context 2: Home-Sharing Industry
Data Collection. We replicated the analysis using the home-sharing context. We randomly drew 2,000 properties from Airbnb.com and collected the cover image and the associated text summary of each property. We followed the same procedure used in the movie context, creating the ground truth of congruence through human annotation, which is further used in the deep-learning model for training and testing. See Figure A10 in Online Appendix K for the user interface. In addition to assessing the image-text congruence, the participants were asked how much they would like to click on the property to learn more information about it.18
Generalizability of Congruence Measure. In the model-fitting step, we again randomly split the data set into the training set (1,700), the validation set (100), and the testing set (200) and repeated the model fitting 10 times to test the robustness. The Pearson correlation coefficient for the home-sharing setting was 0.72, in comparison with 0.78 in the ebook setting and 0.72 in the movie setting. This high correlation indicates that our proposed approach to measure congruence can achieve a reasonable performance beyond the ebook and movie contexts.
Generalizability of Congruence Effect. Next, we plot the average interest level for each property against its image-text congruence. Figure 6(b) shows an overall increasing pattern, rather than a U-shape. In other words, consumers are more interested in a home-sharing property when there is a higher level of congruence between the property image and its text description. The U-shape effect of image-text congruence, which we identified in the ebook and movie setting, is not found in the home-sharing context.
The different effect of image-text congruence identified in the home-sharing setting is worth further discussion. Using a similar setting where consumers search for hotels, Van Rampay et al. (2010) also reported a positive effect of congruence as in our home-sharing setting: A higher degree of congruence between hotel profile picture and hotel text summary can lead to more favorable consumer response. The fact that we find different relationships in different settings seems to suggest that the relative impact of the two drivers are context dependent. In high-involvement scenarios such as property rentals and hotel search, consumers prioritize clarity in product information to reduce uncertainty. Between the two drivers, surprise plays a less important role and relevancy matters more in the decision process. Therefore, higher information fluency results in more favorable responses, leading to the positive effect identified in Figure 6(b). In the meantime, we acknowledge that the results could also be caused by the fact that in our sample of home-sharing properties, we predominantly observe medium-to-high image-text congruence values—only 6 of 2,000 observations had a congruence score lower than four. The limited presence of low-congruence observations might not provide sufficient statistical power to detect a potential U-shaped relationship between image-text congruence and consumer choice. To formally tease out the alternative explanations would require more data in other different settings beyond movies and home-sharing, and it is out of the scope of this research. We leave it for future studies. Nevertheless, our proposed approach offers a valuable tool for measuring image-text congruence in a scalable manner, enabling the study of a wider variety of applications.
8. Conclusion and Discussion
Firms have been using multimedia stimuli in advertisements and product display for decades. On online platforms, it is increasingly common for a product’s text description to be displayed together with visual images. Naturally, the congruence between image and text could play a significant role in affecting consumers’ attitude and choice. However, because of the difficulty of analyzing unstructured multimodal data (e.g., images and text), limited empirical research has been conducted to measure the congruence between image and text and investigate its impact on consumer choice. We fill this important research gap.
In this study, we adopt a multimethod approach to explore the impact of image-text congruence on consumers’ choice and the mechanism. We first apply a deep-learning model to measure the semantic congruence of an image-text pair. Our method outputs a continuous measure of congruence, which makes it possible to capture the variation in image-text congruence in a reliable and scalable manner. We apply the congruence measure to analyze individual choice in an app specializing in online reading for young users. Our results reveal an interesting U-shaped relationship between image-text congruence and consumer preference: Consumers are more likely to choose a product when the congruence between its cover image and text description is either high or low. However, the medium level of image-text congruence is associated with the lowest consumer preference, constituting a “dull zone.”
Motivated by the observational evidence, we then conducted two online studies. In the first study, we established the causal effect of image-text congruence and replicate the U-shaped relationship in a controlled experiment. In the second online study, we identify two underlying mechanisms through which image-text congruence exerts influence on consumer information processing: (1) information fluency when there is high relevancy between image and text and (2) surprise-induced information elaboration when the content of one media type is unexpected based on the content of the other.
We further investigate the generalizability of our study in two additional contexts: movie and home sharing. In both contexts, our method demonstrates satisfactory performance in terms of predicting congruence scores, confirming its broad applicability. Notably, the U-shaped effect of congruence on preference is found in the movie context but not the home-sharing context. This suggests that the relative impact of the two drivers can be context dependent. Specifically, although surprise evokes elaboration and can boost positive consumer responses, high information fluency might matter more in contexts where information clarity is prioritized by consumers to reduce uncertainty. We encourage future research to investigate further how various contexts or conditions influence the effects of image-text congruence on consumer behavior.
8.1. Theoretical and Managerial Implications
This research contributes to the literature of multimodal stimuli in consumer information processing. Although conventional wisdom suggests that the “fit” between image and text matters in practice, there has been a substantial gap in understanding how the impact of image-text congruence on consumer choice. Through the mechanism analyses, we investigate the underlying drivers of the heuristic concept of “congruence.” The findings reveal that “congruence” between image and text extends beyond mere “relevancy,” although the relevancy remains a crucial component. Although relevancy facilitates information fluency, “surprise” evokes a more elaborated processing state. This increased processing may enhance memory and recall, leading to more favorable evaluation responses. These two effects work simultaneously but through different routes. Consumer preference is high when the information embedded in an image-text pair is highly relevant or when one media type contains information unexpected from the other, leaving the medium congruence level as a dull zone for product preference in our empirical setting. To the best of our knowledge, our research is among the first empirical research to uncover a U-shaped relationship between multimodal congruence and product choice. Previous studies have indicated a positive relationship, primarily driven by relevancy, though they also note that the mediation effect could be conditional and influenced by factors beyond information fluency. Our research expands on these findings on a much larger scale in real-world scenarios. By measuring congruence on a continuous scale, we report a nonlinear effect of congruence and identify where the effect is expected to be higher, enriching our understanding of the mechanisms underlying the effect of image-text congruence.
Our study also has important managerial implications for practitioners. First, for marketing managers and content creators, our findings shed light on the impact of image-text congruence level on consumers’ choice and help them improve product design and product communications with better image-text coupling strategies. Furthermore, our measure of image-text congruence offers a useful tool to identify misinformation on social media platforms. For example, some online content creators use an attractive image to lure viewers, while the content of the image may mismatch or have low congruence to the true story in text, thus creating the “clickbait” phenomenon. Our technical framework can provide the first step in tackling this issue. Platform managers can adopt this method to better detect and identify suspected clickbait in a more efficient way, which helps increase customer satisfaction and user engagement.
8.2. Limitations and Future Research
Our study has several limitations. First, the image-text pairs in our study—that is, the ebooks and audiobooks, movies, and home-sharing properties—are all firm-generated through managers’ careful design and calibration. Therefore, our data do not include extreme cases where the information delivered from the two sources is completely incongruent. However, such extreme cases might exist in user-generated content, where we expect consumers to respond negatively to irrelevant coupling of image and text. Therefore, it would be interesting to apply our method to validate this hypothesis using user-generated content from social media posts and product reviews. We also expect the effect of image-text congruence to vary by the type of decisions involved, as suggested by the empirical findings in Section 7. Future research can adopt our metric to compare the effect in various empirical settings in a more systematic way. Second, we only focus on images and text descriptions, but other multimodal stimuli such as audio and video can be analyzed in a similar spirit. Although the means of extracting semantic meanings from different media formats may vary, we believe the two-branch modeling framework can be generalized and extended to these other media formats. In sum, this research lays the foundation for future research in this area, which will contribute to the much-needed knowledge on consumer processing of multiple media.
1 Lee and Mason (1999) also showed that relevancy and unexpectancy are subdimensions of image-text congruence. Furthermore, it identified humor as a potential moderator for the congruence effect. Given relevant information, humorous content would strengthen the positive effect of unexpectancy, whereas given irrelevant information, humorous content would attenuate the negative effect of unexpectancy. In this study, we focus on the two main subdimensions and leave the potential moderators for future research.
2 We would like to acknowledge that the two-branch architecture may not be the only way to jointly process the embeddings from image and text. Alternatively, we could stack the image and text vectors into one long vector, which is then used as the input into a series of fully connected dense layers to output the final congruence value at the end. As a robustness check, we implemented this alternative approach and found that it achieves a similar performance to our proposed method. The authors thank an anonymous reviewer for this alternative model architecture. See Online Appendix B for more details.
3 For robustness analysis, we also tried two other popular similarity measures, that is, Euclidean distance and Manhattan distance. We find that cosine similarity consistently outperforms the other two alternative methods. See Online Appendix B for more details.
4 PyTorch 2022, https://pytorch.org/docs/stable/generated/torch.optim.SGD.html.
5 To eliminate the effect of possible randomness, we run the prediction model 10 times and record the average performance and standard deviation. We thank an anonymous reviewer for this suggestion.
6 Note that the samples involved in Sections 3 and 4 are different. The collaborating firm provided a random sample of products for deep-learning model fitting and a sample of users for the observational study. Therefore, our empirical analysis uses the predicted congruence scores, followed by validation using the ground truth scores.
7 We also plotted the average consumption incidence according to the image-text congruence values, that is, each bar representing an interval of 0.1 on the [0, 1] congruence scale. A similar U-shape is found in this alternative plot.
8 As a robustness check, we also fit the model using the human-annotated scores, which are treated as the ground truth in Section 3. Results are presented in Online Appendix G. The parameter estimates based on the ground-truth data are qualitatively consistent with those in Table 4. However, the sample for our observational study is young readers, whereas the ground truth is measured using adult participants, which may introduce measurement errors. We acknowledge this as a potential limitation.
9 During our data collection period, the app did not provide customized recommendations to individual readers. The firm made this decision with the goal of protecting consumer privacy for young readers.
10 We performed robustness analyses for the sampling method: first, we varied the number of negative cases to 10 and 25, and second, we also tried using the most popular unchosen products (instead of a weighted random sample) as the choice set. Results are qualitatively consistent.
11 Note that this “colorfulness” variable weights each color by its pixel fraction and thus is better than a simple count of distinct colors. Consider images A and B, each having 10 colors. Imagine image A is dominated by two colors, and the top five colors make up 98% of the pixel area, yielding a colorfulness value of 2%. Suppose image B has an even split among the 10 colors, which yields a colorfulness value of 10%. Our definition of colorfulness can better capture the fact that image B is more colorful than image A.
12 We did not use all 10 colors identified by Google Cloud Vision API, because not all images have 10 distinct colors.
13 Brightness and saturation are measured using the OpenCV packages for Python: https://pypi.org/project/opencv-python/.
14 The participants involved in the manipulation check study were not allowed to participate in this study. Five participants did not pass the attention check and were excluded from the analysis. The text used in the experiment was translated to English by an English-speaking translator.
15 The choice set is constructed to consist of one original pair and two re-matched pairs from the same theme, so that (1) the image and text for any product appear only once for the same participant, and (2) there is some variation in the image-text congruence within a choice set.
16 Note that although these two constructs could be related, they each contain orthogonal information. For example, the phrase “business casual” and an image of a pink suit would likely be high in both relevancy and surprise. In contrast, the word “meatball” and an image of spaghetti could be high in relevancy but low in surprise.
17 We measured expectancy in our online study because in practice, it is easier for respondents to rate expectancy than surprise. We further reverse-coded expectancy into surprise (unexpectancy) in our subsequent analysis.
18 On property rental websites, if users are interested in a property out of several alternatives, they would click on the property profile to read more details about it. Our experimental design resembles this process in the real-world setting.
References
- (2011) Deriving the pricing power of product features by mining consumer reviews. Management Sci. 57(8):1485–1509.Link, Google Scholar
- (1986) The moderator-mediator variable distinction in social psychological research: Conceptual, strategic, and statistical considerations. J. Personality Soc. Psych. 51(6):1173.Crossref, Google Scholar
- (2012) Deep learning of representations for unsupervised and transfer learning. Proc. ICML Workshop Unsupervised and Transfer Learn. (JMLR.org), 17–36.Google Scholar
- (2020) Uniting the tribes: Using text for marketing insight. J. Marketing 84(1):1–25.Crossref, Google Scholar
- (2019) The smell of healthy choices: Cross-modal sensory compensation effects of ambient scent on food purchases. J. Marketing Res. 56(1):123–141.Crossref, Google Scholar
- (2021) Mining bilateral reviews for online transaction prediction: A relational topic modeling approach. Inform. Systems Res. 32(2):541–560.Link, Google Scholar
- (2017) On sampling strategies for neural network-based collaborative filtering. Proc. 23rd ACM SIGKDD Internat. Conf. Knowledge Discovery Data Mining (ACM, New York), 767–776.Google Scholar
- (2022) Mining consumer minds: Downstream consequences of host motivations for home-sharing platforms. J. Consumer Res. 48(5):817–838.Crossref, Google Scholar
- (2020) Revisiting pre-trained models for Chinese natural language processing. Preprint, submitted April 29, https://arxiv.org/abs/2004.13922.Google Scholar
- (2018) How evaluations of multiple percentage price changes are influenced by presentation mode and percentage ordering: The role of anchoring and surprise. J. Marketing Res. 55(5):655–666.Crossref, Google Scholar
- (2010) Estimating aggregate consumer preferences from online product reviews. Internat. J. Res. Marketing 27(4):293–307.Crossref, Google Scholar
- (2010) Consumer preferences for color combinations: An empirical analysis of similarity-based color relationships. J. Consumer Psych. 20(4):476–484.Crossref, Google Scholar
- (2009) ImageNet: A large-scale hierarchical image database. Proc. IEEE Conf. Computer Vision Pattern Recognition (IEEE, Piscataway, NJ), 248–255.Google Scholar
- (2018) BERT: Pre-training of deep bidirectional transformers for language understanding. Preprint, submitted October 11, https://arxiv.org/abs/1810.04805.Google Scholar
- (2018) Bayesian nonparametric customer base analysis with model-based visualizations. Marketing Sci. 37(2):216–235.Link, Google Scholar
- (2022) Letting logos speak: Leveraging multiview representation learning for data-driven branding and logo design. Marketing Sci. 41(2):401–425.Link, Google Scholar
- (2021) Modeling dynamic user interests: A neural matrix factorization approach. Marketing Sci. 40(6):1059–1080.Abstract, Google Scholar
- (2021) Visual elecitation of brand perception. J. Marketing 85(4):44–66.Crossref, Google Scholar
- (2021) An AI method to score celebrity visual potential from human faces. Preprint, submitted May 1, http://dx.doi.org/10.2139/ssrn.4067555.Google Scholar
- (1988) Print ad recognition readership scores: An information processing perspective. J. Marketing Res. 25(2):168–177.Crossref, Google Scholar
- (2021) Structured multi-modal feature embedding and alignment for image-sentence retrieval. Preprint, submitted August 5, https://arxiv.org/abs/2108.02417.Google Scholar
- (2014) Word2vec explained: Deriving Mikolov et al.’s negative-sampling word-embedding method. Preprint, submitted February 15, https://arxiv.org/abs/1402.3722.Google Scholar
- (1980) Picture memory: How the action schema affects retention. Cognitive Psych. 12(4):473–495.Crossref, Google Scholar
- (2021) Marketing insights from multimedia data: Text, image, audio, and video. J. Marketing Res. 58(6):1025–1033.Crossref, Google Scholar
- (2008) Art infusion, the influence of visual art on the perception and evaluation of consumer products. J. Marketing Res. 45(3):379–389.Crossref, Google Scholar
- (2004) Canonical correlation analysis: An overview with application to learning methods. Neural Comput. 16(12):2639–2664.Crossref, Google Scholar
- (2021) The power of brand selfies. J. Marketing Res. 58(6):1159–1177.Crossref, Google Scholar
- Hastie R (1980) Memory for Behavioral Information that Confirms or Contradicts a Personality Impression. Person Memory (PLE: Memory): The Cognitive Basis of Social Perception (Psychology Press, London, UK), 155–178.Google Scholar
- Hastie R (1981) Schematic principles in human memory. Social Cognition: The Ontario Symposium Volume 1 (Routledge, London), 39–88.Google Scholar
- He K, Zhang X, Ren S, Sun J (2016) Deep residual learning for image recognition. Proc. 2016 IEEE Conf. Computer Vision Pattern Recognition (IEEE, Piscataway, NJ), 770–778.Google Scholar
- (1992) The role of expectancy and relevancy in memory for verbal and visual information: What is incongruency? J. Consumer Res. 18(4):475–492.Crossref, Google Scholar
- (1987) Picture-word consistency and the elaborative processing of advertisements. J. Marketing Res. 24(4):359–369.Crossref, Google Scholar
- (2011) Automated marketing research using online customer reviews. J. Marketing Res. 48(5):881–894.Crossref, Google Scholar
- (1999) Responses to information incongruency in advertising: The role of expectancy, relevancy, and humor. J. Consumer Res. 26(2):156–169.Crossref, Google Scholar
- (2020) Is a picture worth a thousand words? An empirical study of image content and social media engagement. J. Marketing Res. 57(1):1–19.Crossref, Google Scholar
- (1997) Toward a process analysis of emotions: The case of surprise. Motivation Emotion 21(3):251–274.Crossref, Google Scholar
- (2013) Efficient estimation of word representations in vector space. Preprint, submitted January 16, https://arxiv.org/abs/1301.3781.Google Scholar
- (1997) Relevance: The whole history. J. Amer. Soc. Inform. Sci. 48(9):810–832.Crossref, Google Scholar
- (2019) When words sweat: Identifying signals for loan default in the text of loan applications. J. Marketing Res. 56(6):960–980.Crossref, Google Scholar
- (2012) Mine your own business: Market-structure surveillance through text mining. Marketing Sci. 31(3):521–543.Link, Google Scholar
- (2004) Attention capture and transfer in advertising: Brand, pictorial, and text-size effects. J. Marketing 68(2):36–50.Crossref, Google Scholar
- (1996) Relevance reconsidered. Proc. 2nd Conf. Conceptions Library Inform. Sci., 201–218.Google Scholar
- (1981) Person memory: Some tests of associative storage and retrieval models. J. Experiment. Psych. Human Learn. Memory 7(6):440.Crossref, Google Scholar
- (1985) Associative storage and retrieval processes in person memory. J. Experiment. Psych. Learn. Memory Cognition 11(2):316.Crossref, Google Scholar
- (2018)
A survey on deep transfer learning . Proc. Internat. Conf. Artificial Neural Networks (Springer, Cham, Switzerland), 270–279.Crossref, Google Scholar - (2019) Identifying customer needs from user-generated content. Marketing Sci. 38(1):1–20.Link, Google Scholar
- (2012) Does chatter really matter? Dynamics of user-generated content and stock performance. Marketing Sci. 31(2):198–215.Link, Google Scholar
- (2022) Look the part? The role of profile pictures in online labor markets. Marketing Sci. 42(6):1080–1100.Link, Google Scholar
- (1994) Effects of color on emotions. J. Experiment. Psych. General 123(4):394.Crossref, Google Scholar
- (2010) More than words: On the importance of picture-text congruence in the online environment. J. Interactive Marketing 24(1):22–30.Crossref, Google Scholar
- (2018) Learning two-branch neural networks for image-text matching tasks. IEEE Trans. Pattern Anal. Machine Intelligence 41(2):394–407.Crossref, Google Scholar
- Wedel M, Pieters R (2008) Eye tracking for visual marketing. Foundations Trends® Marketing 1(4):231–320.Google Scholar
- (2015) The buffer effect: The role of color when advertising exposures are brief and blurred. Marketing Sci. 34(1):134–143.Link, Google Scholar
- (2020) Multi-modality cross attention network for image and sentence matching. Proc. IEEE/CVF Conf. Computer Vision Pattern Recognition (IEEE, Piscataway, NJ), 10941–10950.Google Scholar
- (2018) Color and emotion: Effects of hue, saturation, and brightness. Psych. Res. 82(5):896–914.Crossref, Google Scholar
- (2020) Cross-modal attention with semantic consistence for image: Text matching. IEEE Trans. Neural Networks Learn. Systems 31(12):5412–5425.Crossref, Google Scholar
- (2014) From image descriptions to visual denotations: New similarity metrics for semantic inference over event descriptions. Trans. Assoc. Comput. Linguistics 2:67–78.Crossref, Google Scholar
- (2016) Wide residual networks. Preprint, submitted May 23, https://arxiv.org/abs/1605.07146.Google Scholar
- (2022) Can consumer-posted photos serve as a leading indicator of restaurant survival? Evidence from Yelp. Management Sci. 69(1):25–50.Link, Google Scholar
- (2022) What makes a good image? Airbnb demand analytics leveraging interpretable image features. Management Sci. 68(8):5644–5666.Link, Google Scholar