Promotion Decisions and the Adoption of Explicit Potential Assessment
Abstract
In this study, we leverage the transformation of a performance management system that shifts from only providing a performance rating to also providing an explicit assessment of potential. Although performance measures enable organizations to evaluate an employee’s past performance, they provide limited information regarding the employee’s potential to perform in a prospective job that requires a different skill set. Consequently, firms are gradually moving toward the incorporation of explicit potential assessments in their annual appraisal process to evaluate the employee’s promotability to a different task environment. Our data access allows us to provide evidence on the consequences of implementing a performance management system that adopted the explicit assessment of potential. We find that, on average, the performance of promoted employees is lower after implementation, suggesting that the potential assessment system is less effective in identifying candidates suitable for promotion. Additional analyses lead us to conclude that the difficulty of evaluating employee potential reduces performance upon promotion because of inaccurate recommendations of supervisors who do not sufficiently differentiate in their ratings. We thus identify variation in supervisors’ evaluation quality as an important source of the Peter Principle.
This paper was accepted by Ranjani Krishnan, accounting.
Supplemental Material: The online appendices and data files are available at https://doi.org/10.1287/mnsc.2022.02199.
1. Introduction
Making promotion decisions is one of the most crucial, yet most challenging activities that firms face. Although promotion candidates are required to have the ability to perform well in a more complex future role, it is inherently difficult to accurately identify and assess the candidates’ potential. In this study, we examine the consequences of implementing a performance management system that adopted the explicit assessment of employees’ potential to facilitate promotion decisions.
In the organizational context, potential is typically used to describe an employee’s expected ability to advance and succeed in a higher position and reflects an employee’s readiness for the next job (Fernández-Aráoz et al. 2011). Here, it is essential to clearly distinguish between high potentials and high performers. High potential and high performance are not necessarily the same because skills required for the next level in the hierarchy are typically not perfectly correlated with skills needed to be the best performer in the current job, especially when moving toward leadership responsibilities (Baker et al. 1988, Grabner and Moers 2013, Benson et al. 2019). Hence, explicit assessment of potential becomes vital in identifying the best candidates for higher-level positions.
Firms recognize that the identification and retention of talented employees is among their most pressing concerns. With demographic shifts leading to waves of retiring employees and increased competition for a shrinking talent pool, the early identification of suitable promotion candidates at all hierarchical levels has become crucial for organizational success (Fernández-Aráoz 2014, Harris and Schwartz 2020). In response, firms are increasingly relying on potential assessment programs in practice (Strack et al. 2010, Fernández-Aráoz et al. 2011, Mercer and Mettl 2020, Deller 2023). However, only around 20% of organizations express confidence in their general ability to fill their potential pipeline and estimate a 40%–48% failure rate in identifying high potentials (Martin and Schmidt 2010, Fernández-Aráoz 2014, Talent Strategy Group 2015). This observation triggers the question if and how the explicit assessment of potential genuinely improves firms’ promotion decisions, an issue that thus far has largely been neglected in both the accounting and economics literature.1 Although the requirement of providing an explicit potential rating is expected to shift the focus toward employees’ expected ability for the next job, a concern is that these evaluations might be uninformative (Cappelli and Keller 2014), which would potentially deteriorate promotion decisions. It is therefore an empirical question whether the benefits of a potential assessment system indeed materialize and, as a result, improve promotion decisions.
To shed light on this question, we examine the consequences of implementing a performance measurement system that transitioned from only evaluating performance to also providing an explicit assessment of potential. We conduct our study using proprietary performance evaluation data from an international professional service firm. The data cover the time period from 2010 to 2015, with the new system being implemented in 2013. In the old performance measurement system, employees received one overall rating for their current performance, whereas in the new system, they receive a rating for current performance and an additional potential rating, which combined results in a so-called nine-box model.2
We start our investigation by analyzing the association between the system change and the performance of promoted employees in their new job. In particular, using a set of complementary empirical specifications, we examine the preperiod versus postperiod difference in performance that follows after receiving a promotion, as the performance of promoted employees in the first year of their new job provides information about the quality of the underlying promotion decisions (Grabner and Moers 2013, Benson et al. 2019). Surprisingly, all of our tests consistently reveal that employees promoted under the new system show lower performance upon promotion compared with their counterparts promoted under the old system. This suggests that the potential assessment system is less effective in identifying candidates suitable for promotion to roles in a different, more complex task environment. This is particularly problematic given that the added value of a potential assessment system lies in identifying employees capable of performing tasks that are not yet part of their current job. Consequently, in a second step, we provide a more detailed analysis of the potential assessment system to uncover potential explanations for why the quality of promotion decisions might have deteriorated under this system.
As the explicit purpose of the potential assessment system is to guide promotion decisions, we first confirm that the potential ratings are indeed taken into account in promotion decisions. Our results indicate that the potential rating is a significant predictor of promotions in the postperiod and economically more relevant than the performance rating. Importantly, we also demonstrate that the new promotion rule indeed differs from the old promotion rule in terms of the type of people who are identified as promotion candidates as well as those who (do not) receive a promotion.
Given that the potential rating is incorporated into promotion decisions as intended, we continue by investigating whether the informativeness of the potential measure justifies its incorporation in the promotion decision. We analyze to what extent the potential rating is predictive of future performance for different groups of employees: promoted and nonpromoted employees (Grabner and Moers 2013). As the system is specifically targeted at assessing the ability to perform well at a new job in a different task environment, the potential rating should predict future performance in a new job (promoted) but less so, if at all, in the same job (nonpromoted). However, contrary to expectations, the results show that the potential rating predicts future performance for nonpromoted employees, but not for promoted ones. Combined with the previous analysis, these findings suggest that, although the firm makes promotion decisions in line with the outcome of the potential assessment, the information content of the potential ratings does, on average, not capture relevant information to identify suitable promotion candidates, potentially leading to an erroneous assessment of an employee’s ability to perform effectively in a different task environment.
We proceed with our analysis by exploring potential explanations for these results. Given that the evaluation of an employee’s future potential typically relies on the subjective assessment by supervisors, we identify conditions under which the evaluation quality of supervisors is higher versus lower, that is, the informativeness of potential ratings is higher versus lower. In a recent study using the same research site, Grabner et al. (2020) show that the firm rewards supervisors who exhibit greater rating differentiation among their subordinates. They argue that the firm views greater rating differentiation as reflecting higher evaluation quality because supervisors who show greater rating differentiation are expected to have provided more informative assessments. Consistent with their argument, we analytically show that a greater preference for accurate assessments leads to more time spent on gathering evaluation-relevant information. This not only leads to more informative assessments but also greater rating differentiation among employees. Using the same analytical model, we further show that a greater span of control puts a strain on the supervisor’s time, which leads to less informative assessments (Manthei and Sliwka 2019). As a result, we expect variation in evaluation quality based on two observable supervisor characteristics: (1) the extent to which the supervisor differentiates among employees when providing ratings (positively associated with evaluation quality (Grabner et al. 2020)) and (2) the supervisor’s span of control (negatively associated with evaluation quality (Manthei and Sliwka 2019)). Although we find no empirical evidence for span of control, we indeed observe that the potential ratings of differentiating supervisors are informative about future performance in the new job, whereas this is not the case for their less-differentiating counterparts. More importantly, we find that the earlier examined postperiod performance decline is significantly greater for promoted employees of supervisors who show low rating differentiation. Combined, our results lead us to conclude that the difficulty of evaluating employee potential reduces performance upon promotion because of inaccurate recommendations of supervisors who do not sufficiently differentiate in their ratings. These theory-consistent, cross-sectional results are particularly relevant as they highlight that our findings are unlikely to be firm-specific and apply more generally to firms moving toward the adoption of explicit potential assessments.
Our study contributes to the literature on performance measurement and promotions in several related ways. First, we apply the concept of predictive validity as a key design characteristic for performance measurement systems to a promotion setting. We show that the explicit assessment of potential is not necessarily useful in predicting future job performance in a new task environment. Given that such potential assessments nevertheless are, as intended, weighted in promotion decisions, our findings provide a novel explanation for the occurrence of the Peter Principle. Chan (2018) and Benson et al. (2019) show that the Peter Principle can occur by an overreliance on measures of current performance in promotion decisions because this provides, for example, incentives to perform in the current job. Complementing this evidence, our findings indicate that the Peter Principle might also be the result of relying on what appears to be a relevant measure, whereas this measure actually lacks the information content it is supposed to possess. We further identify variation in supervisors’ evaluation quality as a significant factor contributing to the lack of informativeness and, consequently, to the Peter Principle.
Second, recent studies show that supervisors differ in the extent to which they differentiate among subordinates’ performance levels, and that rating differentiation is positively associated with supervisors’ career prospects (Grabner et al. 2020) and subordinates’ motivation (Kampkötter and Sliwka 2018). The underlying assumption of these studies is that greater rating differentiation is associated with more informative assessments. We complement the literature by providing direct empirical evidence of this association. In particular, we show that potential assessments of supervisors who show greater rating differentiation are more informative than those of less-differentiating supervisors.
Finally, our results reveal that the explicit assessment of potential and its incorporation in promotion decisions is more challenging than firms might have anticipated. Our findings inform practitioners that implementing an explicit potential assessment system most likely requires implementing other, complementary control practices. In particular, such practices should focus on the supervisors and how to support them in executing the evaluation process to achieve desired outcomes.
2. Theoretical Background
2.1. Background and Related Literature
Research on performance measurement, and the choice of performance measures in particular, has a long tradition in the accounting literature. Numerous studies have examined which performance measures are used for incentivizing managers and how multiple measures are weighted to provide these incentives (Lambert and Larcker 1987, Bushman et al. 1996, Ittner et al. 1997). All these studies are rooted in the seminal work by Holmström (1979), who shows that any (costless) performance measure that provides incremental information about the agent’s effort should be incorporated into the provision of incentives. However, in the context of using performance measures for promotion decisions, information about effort is not necessarily relevant. An important role of promotions is to sort employees into the right job in accordance with their abilities (Baker et al. 1988, Gibbs 1995).
When assessing promotion candidates with the purpose of sorting, management seeks information about the extent to which an employee’s ability is relevant for the new job and task environment that is entered upon promotion. If the new task environment resembles the current task environment, management can conveniently rely on current task performance measures to predict an employee’s suitability for the new job. Yet, if the new job significantly differs from the current job, current job performance is not necessarily predictive of performance in the next job and management most likely has to resort to subjective assessments of promotability. For example, in their setting, Grabner and Moers (2013) are empirically able to disentangle an employee’s overall annual assessment into a component that reflects current job performance and a component that reflects a subjective assessment of expected ability (i.e., potential). They demonstrate that the greater the difference in jobs between hierarchical levels, the less current job performance is predictive of future performance in the next job compared with the current job, whereas the opposite holds for a subjective assessment of expected ability. They further illustrate that the weights assigned to these two performance dimensions in promotion decisions are consistent with the measures’ predictive validity. In essence, the informativeness of a performance measure for sorting purposes is reflected by the measures’ predictive validity regarding future performance in the next job.
However, neither assessing the potential to perform well in the next job nor relying on such assessments in promotion decisions is an easy task. Regarding the latter, Benson et al. (2019) examine whether firms promote sales workers who excel in their current job to the position of sales manager. Their empirical evidence indicates that, although past sales performance as a sales worker positively affects the likelihood of being promoted to sales manager, past sales performance is actually negatively associated with performance as a sales manager. In addition, they reveal that the extent to which a sales worker has experience collaborating with other workers on sales transactions is positively associated with subsequent performance as a sales manager, but this measure is ignored in the promotion decision. Their empirical findings are hence consistent with the Peter Principle, the costs of which can be substantial.3
Nevertheless, there are several reasons why firms might be willing to accept such costs and rely on performance in the current job in promotion decisions, irrespective of the measure’s predictive validity. First, the benefits of providing incentives in the current job might simply outweigh the costs of “ignoring” the sorting role of promotions (Grabner and Moers 2013, Benson et al. 2019). This can, for example, be attributed to the importance of tournament incentives (Lazear and Rosen 1981) or wanting to avoid workers shirking in their current job (DeVaro and Gürtler 2016). Second, performance in the current job can typically be measured more objectively, which can further improve incentives (Prendergast 1998, Manthei and Sliwka 2019). Finally, fairness concerns can push for a focus on current job performance because relative performance in the current job is more salient to employees and can influence their expectations regarding their promotion prospects (Chan 2018).
In addition to not incorporating informative measures in promotion decisions, the information content of the measures of potential to succeed in the next job can itself be problematic. In the context of nonfinancial performance measures, Ittner and Larcker (2003) argue that the difficulty in linking these measures to future financial performance is primarily driven by incorrect measurement. These problems are expected to be even more pronounced when it pertains to assessing an employee’s potential to perform well in the next job. Not only is it challenging to predict how potential will play out in the future, but defining potential and finding appropriate criteria are equally difficult (Mercer and Mettl 2020). Furthermore, because of its forward-looking character, management typically has to resort to subjective assessments when evaluating potential. However, subjectivity allows measurement error to enter the process of assessing potential, with supervisors being a major source of such error (Bol 2011, Berger et al. 2013, Kampkötter and Sliwka 2018). For example, Bol et al. (2018) show, in an auditing setting where tacit knowledge is assumed to signal managerial potential, that only supervisors who themselves have higher tacit knowledge recognize a subordinate’s tacit knowledge as relevant for identifying their potential to be a manager. As a result, the necessity to use subjectivity can undermine the information content of potential evaluations, and emphasizing such an assessment in promotion decisions can thus create inefficient job assignments.
2.2. Research Questions
Potential identification programs are typically implemented to guide promotion decisions with the purpose of sorting, with the ultimate goal to secure succession of leadership roles. In the absence of a potential identification program, employees typically receive one overall performance rating, which next to their performance in the current job might or might not include some implicit potential assessment. The prevalent approach in a potential identification program, however, is to explicitly separate the measurement of performance in the current job from the potential to perform in the next job (Lucy 2016). A popular talent management tool that is widely used by organizations to separate performance from potential is the nine-box model (Ruddy and Anand 2010, Cappelli and Keller 2014, Talent Management Institute 2021, Deller 2023). The model uses a grid with nine boxes to plot employees’ performance against their potential, allowing organizations to identify high-potential employees and plan their development and succession (see Appendix A). The usefulness of models like the nine-box model is not limited to any particular organization or industry (Indeed 2023), although it seems to be more commonly used by larger organizations with a large employee base (Ruddy and Anand 2010).
The main claimed benefit of the nine-box model is that it helps organizations identify employees who have the potential to take on leadership roles in the future and are up for promotion, allowing the firm to focus on their development and retention (Deller 2023, Indeed 2023). In this regard, Church et al. (2015) state that the primary reason for the design of the popular nine-box model is to avoid the occurrence of the Peter Principle, by focusing on more than just current performance. The nine-box model furthermore provides a structured approach to talent management, making it easier for organizations to assess their employees and plan for their development and support succession planning (Silzer and Church 2010).
A limitation of the nine-box model is that it still only focuses on employees’ performance and potential, ignoring other factors such as cultural fit, personality, and team dynamics, which can also impact employees’ success in a role (Silzer and Church 2010). However, the main limitation of the nine-box model that the practitioner-oriented literature highlights is the difficulty of assessing potential, and its distinction from current performance. The assessment heavily relies on subjective evaluations, which can result in employees being rated inaccurately on potential (Talent Management Institute 2021, Whatfix 2022). Cappelli and Keller (2014) even argue that there is little reason to believe that such assessments produce valid information.
Although explicitly separating performance in the current job from the potential to perform in the next job enjoys practical relevance and is popularized by the widespread use of the nine-box model, empirical evidence on the effectiveness of such an explicit split in measurement is absent thus far (Cappelli and Keller 2014). As a result, we first examine to what extent the explicit assessment of employee potential serves the purpose of improving promotion decisions by exploiting the change in a performance measurement system.
Research Question 1. To what extent does the explicit assessment of employee potential serve the purpose of improving promotion decisions?
Although it is an open question whether the explicit assessment of employee potential improves promotion decisions, on average, the main concern with potential identification programs highlighted by practitioners is the information content of the potential assessments. The academic literature on subjectivity suggests that there might be variation in informativeness among supervisors (Bol et al. 2018, Kampkötter and Sliwka 2018, Grabner et al. 2020). If so, then such variation likely translates into cross-sectional variation in improvements in promotion decisions. We therefore pose the following second research question.
Research Question 2. To what extent does the informativeness of explicit potential assessments vary among supervisors and can such variation explain cross-sectional variation in improvements in promotion decisions?
3. Research Setting
Our research site is an international professional service firm specializing in the fields of assurance, tax, strategy consulting, and corporate finance, representing four service lines the company operates in.4 The firm’s corporate hierarchy is organized into six hierarchical levels (plus top management). Although the first two ranks refer to nonmanagement employees, the promotion to the manager rank is typically accompanied by the acquisition of management and supervisor responsibilities.
The firm has implemented a structured career development and supervision program for employees to advance within the firm. It requires that each newly hired employee is permanently assigned to a supervisor who is an experienced professional and supports the employees in their development process. The program further defines specific performance goals and mandatory training sessions tailored to each hierarchical rank. On top of the mandatory aspects, employees are encouraged to establish individual goals in consultation with their supervisor. At the beginning of the career, the employees’ development focuses on technical skills, as well as team integration. Along with the advancement in the hierarchy, the area of responsibility enlarges, which extends the required skill set. Supervisory tasks include leading projects and assigning tasks to team members, but also the individual support of subordinates. At even higher levels, client communication and acquisition, as well as the strategic development of human capital become important.
3.1. Evaluation Criteria for Performance and Promotions Under the Old and New System
In order to evaluate employees and identify promotion candidates, the firm has an extensive annual review process in place. The annual performance evaluation process starts with the subordinates who provide a self-assessment to their supervisor.5 After a revision, the supervisors gather additional performance-related information about their subordinates, including project ratings and informal feedback from project leaders. During the individual performance review meeting with the subordinate, the subordinate’s performance is discussed based on the self-assessment and gathered information, as well as the achievement of the assigned and self-established goals, and further personal and professional development during the year. Subsequently, the supervisor subsumes all information about the subordinate’s capabilities into a supervisor rating.
After the completion of the individual meetings with the subordinates, all supervisors and top management (typically per office) gather to finalize the performance evaluation process in the calibration committee meeting.6 Based on the performance evaluation of the supervisor, the calibration committee discusses the performance of the subordinate. After deliberation, the calibration committee agrees on a final rating for each subordinate that reflects the subordinates’ performance relative to their peers. The final rating has direct compensation consequences in terms of bonus allocation and to some extent salary increases.
To determine the final rating for current job performance, the organization has established several criteria. One of the main criteria is the project rating that the employee receives after finishing a project.7 Further, the achievement of goals and objectives in accordance with the individual goal plan is considered during the assessment. Further performance indicators such as effective utilization, sales, engagement in special projects like recruiting activities, as well as integration into the team, and commitment to the organization are taken into account. In addition, the supervisor can access additional information such as multisource feedback from other colleagues. It is explicitly stated that the final rating is a reflection of current performance. These criteria are applicable in both systems.
Subsequent to the determination of the final ratings, the promotion candidates at each rank are compared and selected based on their current performance (final rating), but also with regard to competencies that are relevant in the next position. A promotion implies a jump to the next hierarchical rank, which includes a substantial change in task environment for all ranks except for the lowest (assistants). It also implies a significant structural increase in salary. Therefore, the accurate identification of potential for promotion candidates is crucial to be able to assess the fit between a candidate’s abilities and the demands of the next job. The criteria to determine potential, and hence to promote an employee, differ before versus after 2013 (pre- versus postperiod). Before 2013, guidelines proposed criteria such as “proven entrepreneurial and leadership skills” or “outstanding technical expertise,” which typically the supervisor assesses and shares with the calibration committee. Although these criteria are discussed, they are not formally documented in terms of a concrete rating under the old performance management system. As of 2013, the assessment, and hence identification, of potential has changed with the implementation of the nine-box model. The reason for implementation follows the argument that the battle for talent has become increasingly acute among firms that require highly skilled and well-educated people. The firm’s implementation decision is thus in line with a common trend among professional service firms to implement potential identification programs. The nine-box model was intended to allow the firm to more systematically and strategically manage its workforce. It should help leaders identify talent, as it marks out individuals who have the potential and performance to move up within the organization to take up senior roles.
Part of the nine-box model is the explicit assessment of potential, which is applied to all ranks with the exception of the lowest rank of assistants.8 On the horizontal axis, current performance is documented, with the left box including employees who received a final rating of one or two, the middle box for employees with a three or four, and the right box covering employees with a four or five.9 On the vertical axis, the employee’s potential is assessed. Low, medium, and high potential reflects whether the employee is well placed in the current role, has vertical potential for a broader and more complex role, or has vertical potential for a significantly broader and more complex role, respectively. To support the calibration committee in identifying the respective potential level, the respective supervisor fills out a questionnaire assessing three dimensions (aspiration, engagement, and ability) before the meeting, which results in an initial potential level to be discussed in the calibration meeting.10 Together with the final rating, the calibration committee then determines an employee’s position in the nine-box model, which enables them to make a final promotion decision. Thus, although the final decision on performance and potential ratings are made by the entire calibration committee (including the supervisor), the supervisor’s input typically is decisive.
It is important to note that both the performance rating and the potential rating are subjective in nature. For the performance rating, it is credible to assume that it captures current job performance. In determining the current performance rating, evaluators can rely on a number of signals such as subjective evaluations regarding project performance complemented with objectively measured dimensions such as effective utilization and overtime. In addition, in our setting, a calibration committee is in place that is adept at evaluating current performance and teasing out components that do not belong in this rating. We use the calibrated performance rating as measure of current job performance, which is also the key dependent variable in our analysis. Potential assessments, and by implication the prediction how well an employee will perform in a new role, are inherently more subjective as they involve predicting performance in a job with new, not-yet performed responsibilities. It is therefore unclear whether potential ratings indeed capture an employee’s suitability for an advanced role, which is a crucial part of the research questions we address.
3.2. Sample and Descriptive Statistics
We have data for a sample spanning a period from 2010 to 2015, capturing three years before the implementation of the new potential assessment system and three years afterward. The main sample consists of 7,709 employee-year observations pertaining to 3,618 unique employees. These employee-year observations relate to seniors (4,284), managers (2,098), and senior managers (1,327), which are the ranks exposed to the new potential assessment system, and it is this group that we focus on in the analyses and refer to as employees in the remainder of the paper, unless explicitly stated otherwise. Figure 1 provides a visual representation of the firm’s hierarchy and sample. When examining prepost differences, we (i) exclude 2012 as the transition year and (ii) focus on future performance, which reduces the sample to 4,429 employee-year observations, pertaining to 2,526 unique employees. Of these employee-year observations, 962 relate to promotions.
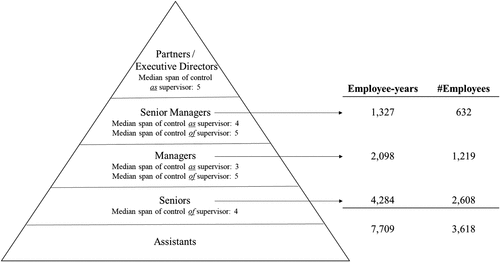
Notes. The figure shows the pyramid structure of the firm in our research setting, which is typical for the firm’s industry. The reported medians are based on the sample of 7,709 observations.
Descriptive statistics are provided in Table 1, differentiating between the preperiod (Panel A) and the postperiod (Panel B). The descriptives are economically fairly similar between the two periods, although there are some statistical differences. In the preperiod, the average performance rating is 3.63 and decreases to 3.52 in the postperiod (p < 0.01 for difference; two-tailed). The overall frequency of promotion decisions has also slightly changed, decreasing from 22% in the preperiod to 20% in the postperiod (p < 0.05 for difference; two-tailed), although there are no significant prepost differences within service line and rank.11 The average age is 34.04 in the preperiod and 34.83 in the postperiod (p < 0.01 for difference; two-tailed). The percentage of males and average job tenure does not differ between periods, being just >60% and 2.8 years, respectively. Further, regarding the nine-box evaluations in the postperiod, the average potential rating equals 2.18, with 12.0% of the employee-year observations in the low potential category, 58.2% in the medium potential category, and 29.8% in the high potential category.
|

Table 1. Descriptive Statistics
| Panel A: Descriptive statistics for the preperiod | ||||||
|---|---|---|---|---|---|---|
| Variable | n | Mean | Standard deviation | Q1 | Median | Q3 |
| PROMOTED | 4,079 | 0.22 | 0.41 | 0 | 0 | 0 |
| PERFORMANCE_RATING | 4,079 | 3.63 | 0.67 | 3 | 4 | 4 |
| AGE | 4,079 | 34.04 | 5.33 | 30 | 33 | 36 |
| JOB_TENURE (untransformed) | 4,079 | 2.84 | 3.13 | 1 | 2 | 3 |
| MALE | 4,079 | 0.61 | 0.49 | 0 | 1 | 1 |
| Ranks (frequency) | ||||||
| SENIOR | 4,079 | 0.61 | ||||
| MANAGER | 4,079 | 0.23 | ||||
| SENIOR_MANAGER | 4,079 | 0.16 | ||||
| Panel B: Descriptive statistics for the postperiod | ||||||
|---|---|---|---|---|---|---|
| Variable | n | Mean | Standard deviation | Q1 | Median | Q3 |
| PROMOTED | 3,630 | 0.20 | 0.40 | 0 | 0 | 0 |
| PERFORMANCE_RATING | 3,630 | 3.52 | 0.67 | 3 | 3 | 4 |
| POTENTIAL_RATING | 2,469 | 2.18 | 0.62 | 2 | 2 | 3 |
| AGE | 3,630 | 34.83 | 5.90 | 31 | 33 | 38 |
| JOB_TENURE (untransformed) | 3,630 | 2.78 | 3.09 | 1 | 2 | 3 |
| MALE | 3,630 | 0.62 | 0.49 | 0 | 1 | 1 |
| Ranks (frequency) | ||||||
| SENIOR | 0.50 | |||||
| MANAGER | 0.32 | |||||
| SENIOR_MANAGER | 0.19 | |||||
Notes. The descriptives are based on employee-year observations of employees of ranks that are exposed to the new explicit potential assessment system and that are included in the analyses reported in Tables 3–9. See Appendix B for variable descriptions.
The examination of the correlation table (Table 2) does not give rise to multicollinearity concerns. Of particular interest, however, is the strong correlation between the performance rating and potential rating in the postperiod, which equals 0.50 (p < 0.01; two-tailed). There are a number of potential explanations for this correlation, two of which are the following. Some part of current performance predicts how well an employee is expected to perform upon promotion because careers are designed vertically and some skills used in the current job will remain relevant in the new job. Alternatively, potentially ratings are, for better or worse, affected by the assessment of performance. Irrespective of these explanations, the correlation also implies that 75% of the variation in potential ratings cannot be explained by performance ratings (and vice versa). Whether this implies that these ratings are therefore also informative about performance upon promotion is one of the questions that we address.
|
Table 2. Correlation Matrix
| Panel A: Correlations between variables preperiod | ||||||
|---|---|---|---|---|---|---|
| (1) | (2) | (3) | (4) | (5) | ||
| (1) PROMOTED | 1 | |||||
| (2) PERFORMANCE_RATING | 0.32*** | 1 | ||||
| (3) AGE | −0.10*** | −0.15*** | 1 | |||
| (4) LN_JOB_TENURE | 0.13*** | −0.08*** | 0.68*** | 1 | ||
| (5) MALE | 0.09*** | 0.11*** | 0.02 | −0.13*** | 1 | |
| Panel B: Correlations between variables postperiod | ||||||
|---|---|---|---|---|---|---|
| (1) | (2) | (3) | (4) | (5) | (6) | |
| (1) PROMOTED | 1 | |||||
| (2) PERFORMANCE_RATING | 0.28*** | 1 | ||||
| (3) POTENTIAL_RATING | 0.26*** | 0.50*** | 1 | |||
| (4) AGE | −0.15*** | −0.19*** | −0.30*** | 1 | ||
| (5) LN_JOB_TENURE | 0.13*** | −0.04*** | −0.25*** | 0.60*** | 1 | |
| (6) MALE | 0.04** | 0.09*** | 0.14*** | 0.00 | −0.14*** | 1 |
***p < 0.01; **p < 0.05, two-tailed.
4. Analysis of the Explicit Assessment of Employee Potential (Research Question 1)
To address our first research question, our main empirical analysis proceeds in two steps. In the first step, we analyze the association between the system change and how well promoted employees perform in their new job. In particular, we examine the prepost difference in performance upon promotion. In the second step, we provide a detailed analysis of the new system, in terms of the incorporation of the potential assessments in promotion decisions and the average informativeness of these assessments.
4.1. Association Between System Change and Performance upon Promotion
To examine the consequences of implementing a performance management system that adopts the explicit assessment of potential, we analyze whether employees’ performance after being promoted differs between the preperiod and the postperiod. That is, when employees get promoted to a new job, we examine whether performance in the new job differs between the preperiod and the postperiod. As a result, we specify the following regression model:
The dependent variable is future performance (PERFORMANCE_RATINGit+1), which relates to the final performance rating of the calibration committee in the year after the change in position, that is, performance in the new job.12 The treatment variable is POSTPERIOD, which equals one after the implementation of the new system and zero before. It indicates whether there is a difference in future performance following a promotion decision in the pre- versus the postperiod. We include the current final rating (PERFORMANCE_RATING) to control for persistence in performance. We further control for the employee’s age (AGE), being male (MALE), and tenure in the current job (JOBTENURE) because prior research suggests that these are relevant predictors of rating outcomes (Gibbons and Waldman 1999, Lazear 2004, Correll et al. 2020). Finally, we include rank fixed effects and service line fixed effects.
The results are presented in column (1) of Table 3. The coefficient on POSTPERIOD is significantly negative (p < 0.01; two-tailed), showing that employees promoted under the new system have lower performance than those promoted under the old system.13 The performance decline after the introduction of the new system suggests that the promotion decisions that have been made using the new system in the postperiod have been less effective than in the preperiod, on average. We further find that future performance in the new job is higher based on (i) the higher performance in the current job (p < 0.01; two-tailed), (ii) the younger the employee (p < 0.05; two-tailed), (iii) the shorter the job tenure upon promotion (p < 0.01; two-tailed), and (iv) the employee is male (p < 0.05; two-tailed).
|
Table 3. Adoption of Explicit Potential Assessment and Performance upon Promotion: A Simple Pre-Post Comparison and Difference-in-Differences Analyses
| Variable | PERFORMANCE_RATINGit+1 | ||
|---|---|---|---|
| (1) | (2) | (3) | |
| Promoted employees | All employees | All promoted employees, including assistants | |
| POSTPERIODit | −0.190*** | ||
| (0.033) | |||
| POSTPERIODit × PROMOTEDit | −0.135*** | ||
| (0.039) | |||
| POSTPERIODit × NONASSISTANTSit | −0.091** | ||
| (0.044) | |||
| PERFORMANCE_RATINGit | 0.405*** | 0.548*** | 0.476*** |
| (0.031) | (0.015) | (0.019) | |
| AGEit | −0.014** | −0.018*** | −0.007* |
| (0.007) | (0.002) | (0.004) | |
| LN_JOB_TENUREit | −0.198*** | −0.051*** | −0.115*** |
| (0.047) | (0.015) | (0.032) | |
| MALEi | 0.073** | 0.112*** | 0.039* |
| (0.036) | (0.018) | (0.023) | |
| PROMOTEDit | −0.243*** | ||
| (0.028) | |||
| Rank fixed effects | Yes | Yes | Yes |
| Service line fixed effects | Yes | Yes | Yes |
| Year fixed effects | No | Yes | Yes |
| Observations | 962 | 4,429 | 2,426 |
| R2 | 0.291 | 0.382 | 0.274 |
Notes. The sample in column (1) relates to employees of ranks that are exposed to the new explicit potential assessment system and only contains employee-year observations that involve a promotion. The sample in column (2) relates to employees of ranks that are exposed to the new explicit potential assessment system and contains all employee-year observations. The sample in column (3) relates to employees of ranks that are exposed to the new explicit potential assessment system, as well as those not exposed to the system (assistants) and only contains employee-year observations that involve a promotion. That is, it includes the sample from column (1) plus 1,464 employee-year observations of promoted assistants. Clustered standard errors are in parentheses (by supervisor). See Appendix B for variable descriptions.
***p < 0.01; **p < 0.05; *p < 0.10, two-tailed.
Although the previous results are consistent with promotion decisions being less effective in the postperiod, there are several alternative explanations for the postperiod performance decline. In what follows, we sequentially discuss these alternative explanations and perform several tests attempting to rule them out. The first alternative explanation is that the coefficient on POSTPERIOD might capture other time-specific events or circumstances that impact performance. Although we are not aware of any other important changes that coincide with the introduction of the new system, the likelihood of such changes is not zero. Second, the new system might have induced a multitasking tradeoff wherein employees allocate effort away from current performance in favor of dimensions that relate more to potential (DeVaro and Gürtler 2016). Such a reallocation would be revealed by lower postperiod performance ratings. Third, the decline in performance ratings might not represent an actual decline in performance but rather the application of more stringent performance standards under the new system that includes potential ratings.
To rule out these three alternative explanations, we use nonpromoted employees as a control group. More specifically, we compare promotion observations to nonpromotion observations. If (any of) the three alternative explanations hold, then we should observe a similar performance decline for nonpromoted employees, because all three alternative explanations equally apply to this control group. We therefore estimate the following difference-in-differences equation:
There are potentially two additional alternative explanations. First, the average performance decline might reflect employees’ postpromotion dips that are exacerbated by the new system emphasizing the importance of promotions in general. Relatedly, this heightened importance might have increased supervisors’ fairness concerns in the postperiod and triggered them to provide lower performance ratings for promoted employees in an attempt to minimize compensation differentials across employees. To rule out these two alternative explanations, we use promoted assistants as control group. If the two alternative explanations hold, we should observe a performance decline for promoted assistants that is similar to the treated group (promoted nonassistants). We estimate the following difference-in-differences equation for promotion observations:
Column (3) of Table 3 reveals a significant negative coefficient on the treatment variable POSTPERIOD × NONASSISTANTS (p < 0.05; two-tailed).14 That is, the decline in postperiod performance for promoted nonassistants is greater than for promoted assistants, which is inconsistent with the alternative explanations driving the main results.
Nevertheless, the assumption that the latter two alternative explanations equally apply to promoted assistants might not hold because these explanations could be less relevant at the first career step. To provide further evidence that lower-quality promotion decisions are more likely to explain the performance decline, we exploit the empirical strategy developed by Benson et al. (2019). Their strategy focuses on estimating the following equation:
The dependent variable equals performance upon promotion for those employee-year observations that involve a promotion and zero otherwise. As a result, the coefficient on PROMOTED, that is, , is an estimate of average performance upon promotion (see Benson et al. (2019) for details). If Equation (4) is estimated using Ordinary Least Squares (OLS), then is the estimate of average performance upon promotion for all promoted employees. If Equation (4) is estimated using an instrumental variables approach with PROMOTED being instrumented, then is the estimate of average performance upon promotion for promoted employees that are compliers to the instrument. To understand how these two estimates can be informative about the quality of promotion decisions, assume that the instrument completely randomizes the promotion decision. If average performance upon promotion for all promoted employees (OLS estimate of ) is similar to that for compliers to the instrument (Instrumental Variable (IV) estimate of ), then the quality of the firm’s promotion decisions is not any better than making random promotion decisions. Thus, higher-quality promotion decisions are captured by a larger difference between the average performance upon promotion for all promoted employees and for compliers to the instrument, that is, a bigger difference between the OLS estimate and the IV estimate.15 Alternatively, when comparing the preperiod to the postperiod, a difference in OLS estimates between periods without a matching difference in IV estimates between periods reflects a change in the quality of promotion decisions.
We use this empirical strategy to estimate, for the preperiod and postperiod separately, the average performance upon promotion for (i) all promoted employees and (ii) promoted employees that are compliers to the instrument. In line with Benson et al. (2019), we use as instrument the average promotion rate per rank, per service line, per year, leaving out the focal employee and other employees at the same rank and service line that are supervised by the same supervisor. Compliers to the instrument are promoted because of a lucky draw of the instrument, irrespective of their performance or potential (“quasi-randomly promoted employees”). More specifically, compliers are employees who got promoted because average promotion rates for their group were high but would not have been promoted had it been slightly lower. In Online Appendix B, we discuss in detail the validity of our instrument and the identifying assumption that underlies our analysis based on the pattern in the four different estimates. Regarding the latter, the identifying assumption is that any alternative explanation that applies to promoted employees on average also applies to quasi-randomly promoted employees that come from this group of promoted employees.
Table 4 presents the OLS and IV estimates for the preperiod and postperiod. The first row of Table 4 shows that average performance upon promotion for all promoted employees is 0.20 lower in the postperiod compared with the preperiod (p < 0.01; two-tailed), which is similar to the results in column (1) of Table 3. More importantly, the second row shows that average performance upon promotion for quasi-randomly promoted employees is not different between periods (p = 0.95; two-tailed). The observed difference in OLS estimates without a matching difference in IV estimates is consistent with a decrease in the quality of promotion decisions.
|
Table 4. Adoption of Explicit Potential Assessment and Performance upon Promotion: All Promoted Employees vs. Quasi-Randomly Promoted Employees
| (1) | (2) | (3) | |
|---|---|---|---|
| Preperiod | Postperiod | Difference | |
| Average performance upon promotion for all promoted employees | 3.61 (0.03) | 3.41 (0.03) | −0.20*** (0.04) |
| Average performance upon promotion for quasi-randomly promoted employees | 3.30 (0.42) | 3.32 (0.19) | 0.02 (0.46) |
Notes. The estimates are based on estimating the following regression equation per period:
***p < 0.01, two-tailed.
Collectively, the results in Tables 3 and 4 suggest that promotion decisions are less effective in the postperiod when potential is explicitly assessed. However, it remains difficult to cleanly identify the average performance effect in the absence of objective measures of performance and completely rule out the alternative explanations.16 We therefore examine the new system in more detail to provide additional evidence.
4.2. Promotion Decisions Under the Old vs. New System
A change in the quality of promotion decisions after the new system introduction implies that the new promotion rule differs from the old promotion rule, resulting in a different composition of the (non)promoted workforce. To examine whether this is indeed the case, we first estimate these promotion rules by estimating the following probit regression models per period17:
The results in Table 5 indicate that, although the performance rating is a significant predictor of promotions in both periods, the coefficient (and marginal effect) is significantly smaller in the postperiod (p < 0.01; two-tailed). In addition, the potential rating is a significant predictor of promotions in the postperiod and economically more relevant in terms of marginal effect than the performance rating.20 Although these results demonstrate, as could have been expected, that potential matters in promotion decisions in the postperiod to the detriment of performance ratings, this does not necessarily imply that the resulting promotion probabilities differ from those when using the old promotion rule. In essence, it may not necessarily lead to different promotion decisions.
|
Table 5. Role of Performance Ratings and Potential Ratings in Promotion Decisions
| Variable | PROMOTEDit | |
|---|---|---|
| (1) | (2) | |
| Preperiod | Postperiod | |
| PERFORMANCE_RATINGit | 0.926*** | 0.434*** |
| (0.051) | (0.064) | |
| POTENTIAL_RATINGit | 0.718*** | |
| (0.081) | ||
| AGEit | −0.017 | −0.016 |
| (0.011) | (0.012) | |
| LN_JOB_TENUREit | 2.627*** | 2.385*** |
| (0.154) | (0.195) | |
| LN_JOB_TENURE2it | −0.904*** | −0.732*** |
| (0.071) | (0.087) | |
| MALEi | 0.323*** | 0.319*** |
| (0.057) | (0.079) | |
| Rank fixed effects | Yes | Yes |
| Service line fixed effects | Yes | Yes |
| Year fixed effects | Yes | Yes |
| Observations | 4,079 | 2,469 |
| Pseudo R2 | 0.342 | 0.351 |
Notes. Clustered standard errors are in parentheses (by supervisor). See Appendix B for variable descriptions.
***p < 0.01, two-tailed.
To provide more direct evidence of the difference in outcomes between the old and new promotion rule, we (i) predict the promotion probabilities in the postperiod using the old promotion rule by applying the coefficients from column (1) of Table 5 to the postperiod data, (ii) predict the promotion probabilities in the postperiod using the new promotion rule by applying the coefficients from column (2) of Table 5 to the postperiod data, and (iii) create quartiles within each rank, service line, and year for each set. This procedure allows us to compare the classification of employees, in terms of their expected probability of promotion, based on the old versus new promotion rule.
Panel A of Table 6 tabulates these two sets of quartiles. The results show that 74.7% are on-diagonal and 25.3% are off-diagonal, which implies that in approximately 25% of the cases (the size of a quartile), the two promotion rules classify employees in different quartiles of promotion likelihood. To examine whether and how these different likelihoods translate into differences in actual promotion rates, it is of particular interest to compare the employees in the upper right quadrant to the employees in the bottom left quadrant. That is, we compare the actual promotion rates for employees who have a low likelihood of receiving a promotion under the old rule (Q1old and Q2old) but a high likelihood under the new rule (Q3new and Q4new) versus employees who have a high likelihood of receiving a promotion under the old rule (Q3old and Q4old) but a low likelihood under the new rule (Q1new and Q2new). Panel B of Table 6 indicates that employees in the upper right quadrant are almost seven times more likely to be promoted than employees in the bottom left quadrant (17.07% versus 2.48%), which shows that the two promotion rules lead to significantly different outcomes. In addition, when comparing the composition of the nonpromoted workforce in the preperiod versus postperiod, we observe in Panel C of Table 6 that the distribution of employees across the quartiles of the old promotion rule is significantly different between periods (; p = 0.05). In particular, relatively more Q4old employees and fewer Q1old–Q3old employees are observed among the nonpromoted in the postperiod.21 Overall, our findings confirm that the new system that explicitly incorporates potential assessments leads to significantly different promotion decisions, resulting in a different composition of the (non)promoted workforce.22
|
Table 6. Differences in Outcomes Between the Old and New Promotion Rule
| Panel A: Classification of employees, in terms of their expected probability of promotion expressed in quartiles, based on the old vs. new promotion rule | ||||
|---|---|---|---|---|
| Q1new | Q2new | Q3new | Q4new | |
| Q1old | 23.17% | 3.20% | 0.12% | 0.00% |
| Q2old | 2.47% | 16.77% | 4.54% | 0.32% |
| Q3old | 0.04% | 4.62% | 15.51% | 4.90% |
| Q4old | 0.00% | 0.24% | 4.82% | 19.28% |
| Panel B: Actual promotion rates for employees split on low vs. high expected promotion probabilities in the old vs. new promotion rule | ||
|---|---|---|
| Q1new/Q2new | Q3new/Q4new | |
| Q1old/Q2old | 3.73% | 17.07% |
| Q3old/Q4old | 2.48% | 37.12% |
| Panel C: Composition of the nonpromoted workforce in the preperiod vs. the postperiod across quartiles of expected promotion probabilities based on the old promotion rule | |||
|---|---|---|---|
| Preperiod | Postperiod | Difference | |
| Q1old | 32.04% | 31.88% | −0.16% |
| Q2old | 29.54% | 27.57% | −1.97% |
| Q3old | 25.03% | 24.51% | −0.52% |
| Q4old | 13.39% | 16.04% | 2.65% |
| ; p = 0.05 | |||
Notes. Q1old − Q4old (Q1new − Q4new) represents quartiles of promotion probabilities in the postperiod based on the promotion rule in the preperiod (postperiod). To create these quartiles, we (i) predict the promotion probabilities in the postperiod using the old promotion rule, by applying the coefficients from column (1) of Table 5 to the postperiod data, (ii) predict the promotion probabilities in the postperiod using the new promotion rule, by applying the coefficients from Column (2) of Table 5 to the postperiod data, and (iii) create, for each set, quartiles within each rank, service line, and year.
4.3. How Informative Are the Potential Assessments?
Given that the potential ratings are incorporated into promotion decisions in the intended way, a possible reason for the performance decline in the postperiod is that these potential ratings actually do not capture the distinct potential to perform well in a (different) future job. Therefore, we proceed with an examination of the informativeness of the potential ratings. In line with Grabner and Moers (2013), we define informativeness as the predictive validity of the potential rating for future performance in a different job. In particular, we investigate the predictive validity of the potential rating for future performance in a different job (promotion group) and compare it to the predictive validity for future performance in the same job (nonpromotion group) using the following model23:
Table 7 presents the results on the predictive validity of the potential rating for future job performance for promoted and nonpromoted employee-years separately. The results first of all show that current performance predicts future performance in the next job less than when staying in the same job (p < 0.01; two-tailed), although significant in both cases. This is consistent with the idea that the knowledge and skills needed for the current job are different from, although related to, the knowledge and skills needed for the next job, which also substantiates why incorporating the concept of potential is relevant in the first place. However, we also find that the potential rating predicts future performance in the same job (p < 0.01; two-tailed), but not in the next job (p > 0.10; two-tailed), with the difference not being statistically significant. That is, and .25 The results thus show that the potential rating is informative of future performance in the same job but not of future performance in the new job, revealing that the potential rating is lacking the informativeness it is supposed to possess.
|
Table 7. Predictive Validity of Performance Ratings and Potential Ratings for Future Performance
| PERFORMANCE_RATINGit+1 | |||
|---|---|---|---|
| (1) Nonpromoted | (2) Promoted | (3) Difference | |
| PERFORMANCE_RATINGit | 0.476*** | 0.251*** | −0.224*** |
| (0.036) | (0.059) | (0.071) | |
| POTENTIAL_RATINGit | 0.188*** | 0.124 | −0.064 |
| (0.037) | (0.076) | (0.082) | |
| Controls (age, job tenure, male) | Yes–interacted | ||
| Rank fixed effects | Yes–interacted | ||
| Service line fixed effects | Yes–interacted | ||
| Year fixed effects | Yes–interacted | ||
| Observations | 1,212 | ||
| R2 | 0.382 | ||
Notes. We estimate the predictive validity of the performance and potential ratings for future performance in a different job (promoted) compared with the predictive validity for future performance in the same job (nonpromoted) using the following model:
Clustered standard errors are in parentheses (by supervisor). See Appendix B for variable descriptions.
***p < 0.01, two-tailed.
Combined with the previous analyses, our results suggest that the weighting of the potential rating in promotion decisions is not consistent with its informativeness. That is, although the firm makes promotion decisions in line with the outcome of the potential rating, the information content of the potential rating does, on average, not capture the relevant information to identify the right promotion candidates, potentially leading to an incorrect assessment of how well an employee can perform in a different task environment. Paradoxically, this suggests that explicitly assessing potential can actually result in the occurrence of the Peter Principle rather than its avoidance.
5. Supervisor as a Source of the Peter Principle (Research Question 2)
We continue our analysis by investigating potential explanations for the finding that the potential rating, on average, lacks informativeness. By definition, evaluating an employee’s future potential relies on the subjective assessment of supervisors. Hence, our second research question explores the possibility that there is variation in evaluation quality and that some supervisors are better able and/or more willing to make potential assessments that are informative than others. To that end, we identify conditions under which the evaluation quality of supervisors is higher versus lower; that is, the informativeness of potential ratings is higher versus lower. In particular, we expect variation in evaluation quality based on observable supervisor characteristics.
Using an analytical model (see Online Appendix C), we derive two observable characteristics that are associated with evaluation quality: (1) the extent to which the supervisor differentiates among employees when providing ratings (positively associated with evaluation quality) and (2) the supervisor’s span of control (negatively associated with evaluation quality). Regarding the first, supervisors can have, in general, a preference for a more “outcome-based team culture” or for a more “harmonious team culture.” In terms of performance evaluation, the former relates to a preference for accuracy of ratings, whereas the latter relates to a preference for equity among the agents. In contrast to equity preferences, a stronger preference for accuracy triggers the supervisor to collect evaluation-relevant information about each subordinate, which results in both more informative assessments and greater rating differentiation among subordinates (Berger et al. 2013, Kampkötter and Sliwka 2018, Manthei and Sliwka 2019). Although this does not imply that supervisors with equity preferences who differentiate less are necessarily bad supervisors, the firm in our research setting penalizes low differentiators with reduced career opportunities (Grabner et al. 2020), signaling that differentiation is part of better performance evaluation practices. In line with Grabner et al. (2020), we therefore assume that greater rating differentiation reflects higher supervisor evaluation quality and expect that, despite its inherent difficulty, differentiating supervisors are more likely to provide more informative potential assessments of an employee than their less-differentiating counterparts.
All else equal, a supervisor’s rating differentiation is positively associated with the informativeness of potential assessments.
Next, following insights from Manthei and Sliwka (2019), we propose that variation in the span of control, that is, the number of employees who report to a particular supervisor, explains variation in the informativeness of potential assessments. As argued above, the informativeness of subjective assessments depends on the time allocated to this assessment and the span of control puts a strain on the supervisor’s time. We analytically show in Online Appendix C that when the number of employees that needs to be assessed increases, less time is spent on both performance and potential assessments, resulting in less informative ratings. Under the plausible assumption that supervisors care more about accurate assessments in the current job compared with future potential for the next job (see Online Appendix C for details), potential assessments become even less informative with a greater span of control, because the time spent is allocated away from these assessments in favor of performance assessments. As a result, we expect that with a greater span of control, the time allocated to assessing employees’ potential decreases, resulting in decreased informativeness of the potential ratings.
All else equal, a supervisor’s span of control is negatively associated with the informativeness of potential assessments.
To test these predictions, we examine the predictive validity of performance and potential ratings for future performance for groups split on (i) nonpromotion versus promotion observations and (ii) low versus high values on the supervisor variable of interest (HiXSV). These supervisor variables are (i) rating differentiation (low versus high, based on a median split of supervisors differentiation of performance ratings), (ii) past performance (low versus high, based on the performance rating of the supervisor being less than or equal to three versus higher than three), and (iii) span of control (low versus high, based on median split).26 The first and third variables directly follow from the analytical model, whereas the second variable is used as an alternative measure of supervisor evaluation quality.27
We adapt Equation (6) and estimate the following equation:
Panel A of Table 8 presents the results for low versus high rating differentiation by the supervisor. We find that, for low differentiators, the potential rating predicts future performance in the same job (p < 0.01; two-tailed) but not in the next job (p > 0.10; two-tailed), and the latter is significantly different from the former (p < 0.01; two-tailed). For high differentiators, we find that the potential rating predicts future performance in the same job (p < 0.01; two-tailed) as well as in in the next job (p < 0.10; two-tailed), with no significant difference. In addition, the potential rating of high differentiators is significantly more predictive of future performance in the next job than the potential rating of low differentiators (p < 0.05; two-tailed). Thus, the potential ratings of high differentiators are informative of future performance in the next job and significantly more so than the potential ratings of low differentiators.
|
Table 8. Supervisor Characteristics and the Predictive Validity of Performance Ratings and Potential Ratings for Future Performance
| Panel A: Supervisors’ rating differentiation and predictive validity | ||||
|---|---|---|---|---|
| PERFORMANCE_RATINGit+1 | ||||
| Low differentiation | High differentiation | |||
| (1) Nonpromoted | (2) Promoted | (3) Nonpromoted | (4) Promoted | |
| PERFORMANCE_RATINGit | 0.465*** | 0.010 | 0.440*** | 0.349*** |
| (0.080) | (0.142) | (0.074) | (0.101) | |
| POTENTIAL_RATINGit | 0.313*** | −0.264 | 0.269*** | 0.245* |
| (0.082) | (0.164) | (0.074) | (0.125) | |
| Controls (age, job tenure, male) | Yes–interacted | |||
| Rank fixed effects | Yes–interacted | |||
| Service line fixed effects | Yes–interacted | |||
| Year fixed effects | Yes–interacted | |||
| Observations | 610 | |||
| R2 | 0.439 | |||
| Coefficient estimates used to calculate the marginal effects | ||||
| : PERFORMANCE_RATINGit | 0.465*** (0.080) | |||
| : PERFORMANCE_RATINGit × Promoted | −0.455*** (0.168) | |||
| : PERFORMANCE_RATINGit × High Differentiation | −0.025 (0.174) | |||
| : PERFORMANCE_RATINGit × Promoted × High Differentiation | 0.364* (0.208) | |||
| : POTENTIAL_RATINGit | 0.313*** (0.082) | |||
| : POTENTIAL_RATINGit × Promoted | −0.577*** (0.169) | |||
| : POTENTIAL_RATINGit × High Differentiation | −0.044 (0.111) | |||
| : POTENTIAL_RATINGit × Promoted × High Differentiation | 0.553** (0.224) | |||
| Panel B: Supervisors’ past performance and predictive validity | ||||
|---|---|---|---|---|
| PERFORMANCE_RATINGit+1 | ||||
| Low past performance | High past performance | |||
| (1) Nonpromoted | (2) Promoted | (3) Nonpromoted | (4) Promoted | |
| PERFORMANCE_RATINGit | 0.441*** | 0.156 | 0.533*** | 0.408*** |
| (0.088) | (0.184) | (0.074) | (0.107) | |
| POTENTIAL_RATINGit | −0.016 | 0.189 | 0.197** | 0.246** |
| (0.100) | (0.271) | (0.086) | (0.116) | |
| Controls (age, job tenure, male) | Yes–interacted | |||
| Rank fixed effects | Yes–interacted | |||
| Service line fixed effects | Yes–interacted | |||
| Year fixed effects | Yes–interacted | |||
| Observations | 464 | |||
| R2 | 0.381 | |||
| Coefficient estimates used to calculate the marginal effects | ||||
| : PERFORMANCE_RATINGit | 0.441*** (0.088) | |||
| : PERFORMANCE_RATINGit × Promoted | −0.285 (0.204) | |||
| : PERFORMANCE_RATINGit × High Past Performance | 0.092 (0.115) | |||
| : PERFORMANCE_RATINGit × Promoted × High Past Performance | 0.160 (0.240) | |||
| : POTENTIAL_RATINGit | −0.016 (0.100) | |||
| : POTENTIAL_RATINGit × Promoted | 0.205 (0.297) | |||
| : POTENTIAL_RATINGit × High Past Performance | 0.213 (0.132) | |||
| : POTENTIAL_RATINGit × Promoted × High Past Performance | −0.155 (0.331) | |||
| Panel C: Supervisors’ span of control and predictive validity | ||||
|---|---|---|---|---|
| PERFORMANCE_RATINGit+1 | ||||
| Low span of control | High span of control | |||
| (1) Nonpromoted | (2) Promoted | (3) Nonpromoted | (4) Promoted | |
| PERFORMANCE_RATINGit | 0.545*** | 0.265*** | 0.432*** | 0.283*** |
| (0.051) | (0.076) | (0.050) | (0.099) | |
| POTENTIAL_RATINGit | 0.154*** | 0.151 | 0.220*** | 0.107 |
| (0.059) | (0.100) | (0.048) | (0.120) | |
| Controls (age, job tenure, male) | Yes – interacted | |||
| Rank fixed effects | Yes – interacted | |||
| Service line fixed effects | Yes – interacted | |||
| Year fixed effects | Yes – interacted | |||
| Observations | 1,212 | |||
| R2 | 0.402 | |||
| Coefficient estimates used to calculate the marginal effects | ||||
| : PERFORMANCE_RATINGit | 0.545*** (0.111) | |||
| : PERFORMANCE_RATINGit × Promoted | −0.280*** (0.095) | |||
| : PERFORMANCE_RATINGit × High Span of Control | −0.113 (0.071) | |||
| : PERFORMANCE_RATINGit × Promoted × High Span of Control | 0.131 (0.145) | |||
| : POTENTIAL_RATINGit | 0.154*** (0.059) | |||
| : POTENTIAL_RATINGit × Promoted | −0.004 (0.114) | |||
| : POTENTIAL_RATINGit × High Span of Control | 0.066 (0.076) | |||
| : POTENTIAL_RATINGit × Promoted × High Span of Control | −0.110 (0.169) | |||
Notes. We estimate the cross-sectional variation in the predictive validity of performance and potential ratings for future performance in a different job (promoted) compared with the predictive validity for future performance in the same job (nonpromoted) using the following model:
PERFORMANCE_RATINGit (POTENTIAL_RATINGit) for nonpromoted, low XSV: ().
PERFORMANCE_RATINGit (POTENTIAL_RATINGit) for promoted, low XSV: ().
PERFORMANCE_RATINGit (POTENTIAL_RATINGit) for nonpromoted, high XSV: ().
PERFORMANCE_RATINGit (POTENTIAL_RATINGit) for promoted, high XSV: ().
Clustered standard errors are in parentheses (by supervisor). See Appendix B for variable descriptions and descriptive statistics for the supervisor characteristics.
***p < 0.01; **p < 0.05; *p < 0.10, two-tailed.
The results based on supervisor’s past performance, presented in Panel B of Table 8, show a pattern that is to some extent in line with the results for rating differentiation. That is, for low past performance of the supervisor, we find that the potential rating is neither predictive of future performance in the same job nor in the next job. In contrast, for high past performance, we find that the potential rating is predictive of future performance in both the same job and the next job (for both, p < 0.05; two-tailed). However, none of the coefficients are statistically different between low and high past performance of the supervisor.
Finally, regarding the supervisor’s span of control (Panel C of Table 8), we find that the results do not differ between the sample splits. That is, the potential rating is predictive of future performance in the same job but not the next job, irrespective of the supervisor’s span of control. A potential explanation for the lack of difference is that a greater span of control provides more benchmarks for each employee, which allows for a better evaluation. That is, if performance about employee A can be used to make assessments about employee B (and vice versa), then a greater span of control by itself provides more signals about each employee and thus, all else equal, leads to more informative assessments. This might counterbalance the negative time effect that comes with a larger span of control, overall leading to no significant differences.
In sum, the results in Table 8 reveal that it is the supervisor’s rating differentiation that significantly explains cross-sectional variation in the informativeness of potential ratings for performance upon promotion. Additional untabulated tests reveal that the firm, when making promotion decisions, does not differentiate between potential ratings coming from supervisors with low versus high rating differentiation.28 These results suggest that, if the on average lack of informativeness of potential ratings drives the on average postperiod decline in performance upon promotion, then the supervisor evaluation quality, reflected by rating differentiation, also should explain cross-sectional variation in the postperiod performance decline. That is, the postperiod performance decline should be greater for supervisors who differentiate less compared with supervisors who differentiate more.
To examine whether rating differentiation explains cross-sectional variation in differences between preperiod and postperiod performance upon promotion, we re-estimate Equations (1)–(3) and allow the coefficients to vary between low and high rating differentiation.29 The treatment variable of interest is the interaction between POSTPERIOD and LOW_DIFFERENTIATION, which is expected to be negative. We present the results for Equations (1)–(3) in columns (1)–(3) of Table 9, respectively. For Equation (1), which examines pre-post differences for promoted employees, we find that the postperiod performance decline is significantly greater for promoted employees of low differentiators compared with high differentiators (p < 0.05; two-tailed). When using nonpromoted employees as a control group, that is, Equation (2), we find a significantly greater performance decline for promoted employees compared with nonpromoted employees in case of a low differentiating supervisor compared with a high differentiating supervisor (p < 0.05; two-tailed). We find similar results when using promoted assistants as a control group, that is, Equation (3), although the difference between low and high differentiators is only one-tailed significant (p = 0.19; two-tailed).
|
Table 9. Pre- vs. Postperiod Performance upon Promotion Conditional on Supervisors’ Rating Differentiation
| PERFORMANCE_RATINGit+1 | |||
|---|---|---|---|
| (1) | (2) | (3) | |
| Promoted employees | All employees | All promoted employees, including assistants | |
| POSTPERIODit | −0.112** | ||
| (0.055) | |||
| POSTPERIODit × LOW_DIFFERENTIATIONit | −0.219** | ||
| (0.091) | |||
| POSTPERIODit × PROMOTEDit | −0.041 | ||
| (0.068) | |||
| POSTPERIODit × PROMOTEDit × LOW_DIFFERENTIATIONit | −0.243** | ||
| (0.104) | |||
| POSTPERIODit × NONASSISTANTSit | −0.060 | ||
| (0.077) | |||
| POSTPERIODit × NONASSISTANTSit × LOW_DIFFERENTIATIONit | −0.158† | ||
| (0.121) | |||
| Controls (performance rating, age, gender, job tenure) | Yes – interacted | Yes – interacted | Yes – interacted |
| Rank fixed effects | Yes – interacted | Yes – interacted | Yes – interacted |
| Service line fixed effects | Yes – interacted | Yes – interacted | Yes – interacted |
| Year fixed effects | No | Yes – interacted | Yes – interacted |
| Observations | 520 | 2,382 | 1,401 |
| R2 | 0.373 | 0.398 | 0.315 |
Notes. Clustered standard errors are in parentheses (by supervisor). See Appendix B for variable descriptions.
***p < 0.01 and **p < 0.05, two-tailed; †p < 0.10, one-tailed.
Overall, we find that the informativeness of explicit potential assessments systematically varies with supervisors’ rating differentiation, consistent with the theoretical prediction that supervisors who show greater differentiation have invested more time in assessing employees and therefore provide more informative assessments.30 We also find that rating differentiation explains cross-sectional variation in the postperiod performance decline, with this decline being significantly greater for promoted employees of supervisors who show low rating differentiation. Combined, our results lead us to conclude that the difficulty of evaluating employee potential reduces performance upon promotion because of inaccurate recommendations of supervisors who do not sufficiently differentiate in their ratings. As a result, the explicit assessment of potential can lead to the occurrence rather than avoidance of the Peter Principle, and supervisors are a source of such occurrence by providing uninformative potential assessments.
6. Conclusion
In this study, we provide evidence on the consequences of implementing a potential measurement system. In the preperiod, the assessment information was limited to one overall rating that is supposed to capture current performance, and no separate information signal for potential was available. Thus, adding a separate measure for potential should help the firm in identifying suitable promotion candidates, ultimately leading to a better job assignment of employees.
However, our results paint a different picture and reveal an inconsistency in the weight placed on the potential rating in promotion decisions and the information content of these ratings. The firm seems to base promotion decisions on the outcome of the potential assessment process, assuming that these ratings correctly identify employees who have the potential to perform well in a different job. However, differences in potential ratings do not uniformly explain differences in future performance of promoted employees, implying that, on average, these ratings do not correctly capture the relevant information to identify the right promotion candidates. Our cross-sectional tests show that the predictive validity of the potential ratings is systematically related to the characteristics of the supervisors involved in these subjective assessments, and in particular to the supervisor’s degree of rating differentiation. That is, potential ratings of less-differentiating supervisors lack informativeness, thereby compromising the promotion decisions that the firm makes based on these assessments. Indeed, we find that performance upon promotion under the newly introduced potential assessment system is lower for subordinates who are guided by less-differentiating supervisors. Most importantly, these findings suggest that paradoxically, supervisors who are entrusted with supporting and guiding their subordinates’ career development paths can themselves be a critical source of the Peter Principle. Thus, careful consideration on who to trust with supervisor responsibilities is a prerequisite for the successful identification of promotion candidates, even if a uniform well-structured and thus very costly potential assessment process involving many information sources is in place.
Despite the observed differences among supervisors, the firm does not distinguish among potential ratings coming from different type of supervisors when making promotion decisions. This could be due to the firm being uninformed about the insufficient predictive validity of the potential ratings provided by a subset of the supervisors or these supervisors being able to convince the firm of the claimed accuracy of their potential assessments. But even when the firm is informed and can act on it, it is unlikely that doing so would improve the situation. If supervisors rationally anticipate that their potential ratings receive less weight in promotion decisions, they have even less of an incentive to invest in the informativeness of their potential assessments, undermining the system even further.
A natural follow-up question is then what the firm can do to mitigate the problem of uninformative potential assessments. In our analytical model, uninformative assessments are the result of supervisors’ conscious cost-benefit tradeoffs, where they tradeoff costly time investments with the benefits such investments provide. For example, supervisors who show a greater preference for equity have less to gain from more information and therefore limit their costly information acquisition, which results in less informative assessment. In this case, mitigating the problem of uninformative potential assessments requires the firm to directly change the benefits and costs. To do this, the firm can inform supervisors about the negative impact that inaccuracies have on firm decision making and further allow for sufficient supervision time. To the extent that uninformative assessments are also the result of unconscious errors, the firm can provide targeted training programs that make supervisors aware of the existence of such errors. Whether such mechanisms are effective in inducing informative potential assessments is an open empirical question. More generally, the lack of informativeness might also be the result of taking a “one size fits all” approach to potential assessment, relying on standardized questionnaires. Such an approach ignores the specifics of a particular setting, and therefore a more tailor-made approach might be needed to better characterize potential within a firm. To conclude, our results suggest that in order to be successful, an explicit potential assessment system cannot be implemented in isolation and needs to be accompanied by the introduction of other complementary control practices. This provides ample opportunity for future research on potential assessment.
The authors thank our research partner for providing extensive access to data for the analysis. This paper benefited from comments and suggestions by Ranjani Krishnan (deputy editor), the associate editor, two anonymous reviewers, Mario Schabus, Karen Sedatole, Kristy Towry, and seminar participants at the 1st Cambridge Accounting Research Camp, 1st Labor and Accounting Group Conference, 6th Dutch Accounting Research Conference, 7th European Institute for Advanced Studies in Management Workshop on Talent Management, American Accounting Association Management Accounting Section Midyear Meeting, Erasmus University Rotterdam, International Symposium on Audit Research, Maastricht University, National Chengchi University, Swiss Winter Accounting Conference, University of Technology Sydney, and Victoria University of Wellington.
Appendix A. Example of Nine-Box Model
|
Table A.1. Example of Nine-Box Model
| Potential | |||
| High | Potential gem | Future stars | Stars |
| Medium | Inconsistent performers | Core players | High impact performersStars |
| Low | Under performers | Effective employees | Strong performers |
| Performance | Low | Medium | High |
Appendix B. Variable Descriptions
|
Table B.1. Variable Descriptions
| Variable | Description | |||||
|---|---|---|---|---|---|---|
| POSTPERIOD | Indicator variable that equals one for the years 2013–2015, zero otherwise. | |||||
| PROMOTED | Indicator variable that equals one if the employees advances to the next rank, zero otherwise. | |||||
| PERFORMANCE_RATING | Final rating on a scale from one to five provided by the calibration committee. | |||||
| POTENTIAL_RATING | Employee’s potential rating on a scale from one to three. | |||||
| AGE | Age of the employee | |||||
| LN_JOB_TENURE | Logarithm of the employee’s tenure in the current job in years. | |||||
| MALE | Indicator variable that equals one if the employee is a male, zero otherwise. | |||||
| RANK | Hierarchical rank of the employee, consisting of assistants, seniors, managers, and senior managers | |||||
| SERVICE LINE | Area in which the employee operates, consisting of assurance, tax, strategy consulting, and corporate finance | |||||
| NONASSISTANTS | Indicator variable that equals one for employees with ranks higher than assistant, zero otherwise. | |||||
| Supervisor characteristics | ||||||
| HIGH (LOW) DIFFERENTIATION | Indicator variable that equals one if rating differentiation is above (below) the median, zero otherwise, where rating differentiation equals the standard deviation of supervisor-provided performance ratings, per supervisor, per year. The summary statistics for high rating differentiation are as follows: | |||||
| n | Mean | Standard deviation | Q1 | Median | Q3 | |
| 4,164 | 0.51 | 0.33 | 0.42 | 0.58 | 0.71 | |
| HIGH PAST PERFORMANCE | Indicator variable that equals one if the past final performance rating (one to five) of the supervisor provided by the calibration committee is higher than three, zero otherwise. The summary statistics for past performance are as follows: | |||||
| n | Mean | Standard deviation | Q1 | Median | Q3 | |
| 4,120 | 3.78 | 0.70 | 3 | 4 | 4 | |
| HIGH SPAN OF CONTOL | Indicator variable that equals one if the span of control is above the median, zero otherwise, where the span of control is the number of employees who report to the supervisor. The summary statistics for span of control are as follows: | |||||
| n | Mean | Standard deviation | Q1 | Median | Q3 | |
| 7,709 | 5.35 | 3.82 | 3 | 4 | 7 | |
Appendix C. Replication
This appendix may be of interest to practitioners or academics who seek to replicate the analysis presented in this study or perform an analysis of similar changes in performance management systems. Regarding replication per se, we cannot make the original dataset public due to a nondisclosure agreement with our research firm. Instead, we have added a supplemental replication file that provides all necessary statistics that allows for the generation of data sets that contain the same distributional properties for the variables of interest as in the original data set. We provide these statistics to replicate the main results in Section 4 and specifically those in column (2) of Tables 3 and 7, both of which compare promoted to nonpromoted.
Regarding performing similar pre-post analyses, our study highlights two important points that need to be considered. First, it is imperative to have multiple control groups to benchmark any changes observed in the treatment group. Each control group is by itself likely imperfect but consistency across different control groups minimizes the likelihood of drawing incorrect inferences. Of particular interest is the possibility to create a control group from within the treatment group, as in our Table 4. Although this requires the use of a valid instrument, such an instrument is likely available when the change relates to promotions and the data cover employees of different hierarchical levels and/or different sections within the firm (see Online Appendix B). Second, a change in performance management systems inevitably results in some variables only being available after implementation. Although these variables can be used to examine the new system in more detail, they by themselves cannot be used to examine pre-post differences. To credibly link any post-implementation analyses to pre-post differences, it is instructive to rely on cross-sectional variation. That is, show that any cross-sectional variation within the post-implementation results carries over to similar cross-sectional variation in pre-post differences.
1 A recent exception is Deller (2023) who examines voluntary departure decisions as a result of the explicit potential assessment.
2 Performance-potential grids like the nine-box model are the most widely used tool for combined performance and potential reviews (Deller 2023).
3 Benson et al. (2019) estimate that, in their setting, the excessive focus on past sales performance in promotion decisions results in a 30% performance loss.
4 We use the same research site as Grabner et al. (2020). The data sets used in each study are, however, only partly overlapping due to (i) the time period being examined and (ii) the different data requirements for each study. That is, the Grabner et al. (2020) study uses data from 2010 to 2012, before the implementation of the potential assessment system, and covers a sample with data at the supervisor level. The current study uses data from 2010 to 2015 and covers a sample with data at the employee level.
5 To illustrate the process better, we distinguish between subordinates and supervisors in the research setting section, whereas employees usually refers to all types of workers.
6 A recent survey finds that around 50% of firms set up so-called calibration committees to validate the performance of each employee against the relevant peer group (WorldatWork 2017). The primary stated purpose of calibration committees is to ensure consistency in the interpretation of performance ratings and correct errors (Demeré et al. 2019, Grabner et al. 2020). During the calibration sessions, managers and supervisors discuss the subordinate’s performance and adjust the rating that usually has been recommended by the supervisor, if necessary.
7 The rating scale ranges from one to five and applies to all other performance-related ratings. Receiving a one means that immediate intervention is required to improve quickly. A two signals that not all performance goals are met so further improvement is necessary. Employees that meet 100% of their goals and perform at the same level as their peers receive a three. If they exceed expectations and outperform peers, a four is provided. A five signals a continuous outperformance of peers including the setting of stretched goals.
8 The choice to not apply the nine-box model to assistants was guided by cost-benefit considerations in terms of management time: Assistants are a rather large group of employees with relatively high turnover, and for which potential assessments compared with current performance evaluations provide relatively little incremental information regarding the suitability for promotions.
9 The firm has additional guidelines regarding the placement of employees who received a four as the final rating.
10 This questionnaire is developed by a consulting firm and contains standardized questions regarding the dimensions of aspiration, engagement, and ability.
11 Regarding the firm’s promotion policy, the company pre-determines the number of available promotion spots per service line and rank on an annual basis based on business condition and demand. The communicated spots serve as a guideline for the calibration committees, and small deviations are still possible. The annual promotion rates from the years 2010 to 2015 are 28.3%, 30.4%, 20.8%, 21.4%, 28.1%, and 25.4%, respectively. The annual promotion rates per service line and rank vary both across and within groups, without any observable pattern. More specifically, when we compare preperiod promotion rates to postperiod promotion rates per service line and rank, using the Bonferroni-Holm method to control the family-wise error rate (FWER), we find no significant differences.
12 Our choice for using performance during the first year on the new job is driven by the desire to minimize the loss of observations. Two aspects are important to note here. First, our analysis does not assume that an employee’s potential is fully revealed in performance during the first year on the job. Rather, the assumption underlying our analysis is that the ranking of first-year performance is not systematically different from the ranking of longer-term performance. Second, and as a substantiation of the previous point, our results are qualitatively similar when we restrict the analysis to approximately one-third of the respective sample for which we can examine average future performance over a two-year window (see the Online Appendix, Table OA.A1).
13 We have performed an additional (untabulated) test to examine whether the difference between the pre- and postperiod varies with rank. Although the performance decline appears to be more pronounced for managers and senior managers compared with seniors, the differences are not statistically significant. These results highlight that the performance decline is observed across all ranks exposed to the new system.
14 A two-way fixed-effects estimation is not applicable here because the sample includes only promotion observations and there are almost no repeated observations per employee.
15 For completeness, the use of the instrumental variables approach here is not to establish causality and identify the causal effect. It is merely used to compare performance upon promotion for different groups of employees by identifying a group of compliers to the instrument. The difference between the OLS estimate and instrumental variables estimate is also not a test for endogeneity in this setup.
16 For any alternative explanation to be able to explain the combined results in Tables 3 and 4, it has to be the case that the alternative explanation is applicable to promoted employees, on average, but at the same time not (or significantly less) applicable to (i) nonpromoted employees, (ii) promoted assistants, and (iii) quasi-randomly promoted employees.
17 Given that the new system does not apply to assistants, the promotion rule for this group should not have changed. Consistent with this, we find no difference in the coefficient on PERFORMANCE_RATING when running Equation (5a) for assistants per period (0.683 versus 0.633; p for difference = 0.346; two-tailed).
18 The (untabulated) results for Equations (5a) and (5b) are very similar when using a measure of relative performance and relative potential, where relative is based on an employee’s performance/potential compared to the average performance/potential within the same rank, service line, and year. The similarity can be explained by the inclusion of rank, service line, and year fixed effects in Equations (5a) and (5b), which already results in examining variation within rank, service line, and year.
19 The use of POTENTIAL_RATING in Equation (5b) instead of indicators for each rating level assumes constant marginal effects for every change in level (“linear effects”). When we replace POTENTIAL_RATING with POTENTIAL_LOW and POTENTIAL_HIGH as indicators, using POTENTIAL_MEDIUM as benchmark, inferences remain unchanged. In addition, the null hypothesis of linearity cannot be rejected (p > 0.10; two-tailed).
20 The probit marginal effects for potential versus performance equal 0.110 versus 0.066. When estimating the promotion regression using a logit model, the odds ratios for potential versus performance equal 3.56 versus 2.18.
21 It is also plausible that a change in promotion policy affects the type of employees choosing to leave the firm. We find that nonpromoted Q4old employees are significantly less likely to exit in the postperiod and nonpromoted Q2old employees are significantly more likely to exit. In terms of the composition of the leavers, we find that this composition is marginally different (χ2 = 6.17; p = 0.10). Thus, although Q4old employees make up more of the nonpromoted workforce in the postperiod than in the preperiod, they make up less of the leavers.
22 Although the two promotion rules lead to different outcomes, the majority of the employee-years are classified in the same quartile based on the new and old promotion rule. If the previously documented performance decline is reflective of lower quality promotion decisions in the postperiod, then the decline should be most pronounced for employees who would not have been promoted in the old system but did get promoted under the new system. Additional analysis, discussed in detail in Online Appendix A (Table OA.A3), shows that the performance decline in the postperiod is indeed more pronounced for employees who are more likely to have been promoted based on the new promotion rule.
23 This equation produces regression coefficients that are identical to those when running the regression per subsample (promotion group and non-promotion group) but has the benefit that the standard errors are correctly adjusted for clustering within the full sample, which also provides the correct significance levels for comparison between coefficients.
24 Again, our choice for using performance during the first year on the new job is driven by the desire to minimize sample attrition. The results are similar when restricting the sample size to examine average future performance in a two-year window (see Online Appendix, Table OA.A4).
25 When we replace POTENTIAL_RATING with POTENTIAL_LOW and POTENTIAL_HIGH as indicators, using POTENTIAL_MEDIUM as benchmark, inferences remain unchanged.
26 We measure rating differentiation using performance ratings for two reasons. First, although we have access to supervisor-provided precalibration committee performance ratings for part of the sample, we do not have access to supervisor-provided precalibration committee potential ratings. Second, in a subsequent analysis, we make a link between cross-sectional variation in the informativeness of potential ratings and cross-sectional variation in the observed performance decline upon promotion, and for the latter test we need a measure that is observed in both the preperiod and the postperiod.
27 Given that our main sample is an employee-level sample that was not conditioned on having data on the first two supervisor-level variables, the sample size drops to 610 observations when using rating differentiation and to 464 observations when using past performance (compared to the full sample of 1,212 observations). The missing observations for rating differentiation are due to missing data on supervisor-provided precalibration committee performance ratings, or only having one supervisor-provided precalibration committee performance rating in a particular year (in which case there is no standard deviation). Regarding past performance, missing data for some supervisors, particularly due to its status as a lagged variable, results in more missing observations. In both cases, as soon as the data for a supervisor-year is not available, all employee-years for that supervisor drop. For completeness we note that the predictive validity results reported in Table 7 are similar when using the restricted samples. That is, when using the restricted samples, we continue to find that the potential rating predicts future performance in the same job (p < 0.10 or better; two-tailed), but not in the next job (p > 0.10; two-tailed), with the difference not being statistically significant.
28 When allowing the coefficients of Equation (5b), that is, the promotion regression in the postperiod, to be different for low versus high rating differentiation, we find that the performance rating and potential rating are significant predictors of promotions for both groups. Although the coefficient for the performance rating is lower and for the potential rating higher for high differentiators compared with low differentiators, these differences lack statistical significance (for performance, p = 0.72, and for potential, p = 0.28; two-tailed).
29 Table 3 results related to the postperiod performance decline are similar when re-estimating Equations (1)–(3) on the restricted samples for which data on differentiation is available. That is, we continue to find significantly negative coefficients on POSTPERIOD (p < 0.01; two-tailed), POSTPERIOD × PROMOTED (p < 0.01; two-tailed), and POSTPERIOD × NONASSISTANTS (p < 0.05; two-tailed).
30 Relatedly, our finding that, on average, the potential ratings explain future performance in the current job rather than in a new job suggests that the potential assessments capture, on average, a dimension of performance related to the current job that is not captured by the performance rating. One explanation for why potential assessments capture a dimension of performance in the current job might also be related to the time supervisors spend on these assessments. Spending less time on assessments is likely to lead to a focus on things that are more salient, which are things related to the current job.
References
- (1988) Compensation and incentives, practice vs. theory. J. Finance 43(3):593–616.Crossref, Google Scholar
- (2019) Promotions and the Peter Principle. Quart. J. Econom. 134(4):2085–2134.Crossref, Google Scholar
- (2013) Performance appraisals and the impact of forced distribution: An experimental investigation. Management Sci. 59(1):54–68.Link, Google Scholar
- (2011) The determinants and performance effects of managers’ performance evaluation biases. Accounting Rev. 86(5):1549–1575.Crossref, Google Scholar
- (2018) The role of tacit knowledge in auditor expertise and human capital development. J. Accounting Res. 56(4):1205–1252.Crossref, Google Scholar
- (1996) CEO compensation: The role of individual performance evaluation. J. Accounting Econom. 21(2):161–193.Crossref, Google Scholar
- (2014) Talent management: Conceptual approaches and practical challenges. Annu. Rev. Organ. Psych. Organ. Behav. 1:305–331.Crossref, Google Scholar
- (2018) Promotion, relative performance information, and the Peter Principle. Accounting Rev. 93(3):83–103.Crossref, Google Scholar
- (2015) How are top companies designing and managing their high-potential programs? A follow-up talent management benchmark study. Consulting Psych. J. Practice Res. 67(1):17–47.Crossref, Google Scholar
- (2020) Inside the black box of organizational life, the gendered language of performance assessment. Amer. Sociol. Rev. 85(6):1022–1050.Crossref, Google Scholar
- (2023) Beyond performance: Does assessed potential matter to employees’ voluntary departure decisions? J. Accounting Res. 61(4):981–1024.Crossref, Google Scholar
- (2019) The role of calibration committees in subjective performance evaluation systems. Management Sci. 65(4):1455–1947.Google Scholar
- (2016) Strategic shirking in promotion tournaments. J. Law. Econom. Organ. 32(3):620–651.Crossref, Google Scholar
- (2014) 21st century talent spotting. Harvard Bus. Rev. 92(6):46–56.Google Scholar
- (2011) How to hang on to your high potentials. Harvard Bus. Rev. 89(10):76–83.Google Scholar
- (1999) A theory of wage and promotion dynamics inside firms. Quart. J. Econom. 114(4):1321–1358.Crossref, Google Scholar
- (1995) Incentive compensation in a corporate hierarchy. J. Accounting Econom. 19(2):247–277.Crossref, Google Scholar
- (2013) Managers’ choices of performance measures in promotion decisions, an analysis of alternative job assignments. J. Accounting Res. 51(5):1187–1220.Crossref, Google Scholar
- (2020) How calibration committees can mitigate performance evaluation bias, an analysis of implicit incentives. Accounting Rev. 95(6):213–233.Crossref, Google Scholar
- (2020) Why competing for new talent is a mistake. Harvard Business Review Digital Articles (February 5), https://hbsp.harvard.edu/product/H05E3X-PDF-ENG.Google Scholar
- (1979) Moral hazard and observability. Bell J. Econom. 10(1):74–91.Crossref, Google Scholar
Indeed (2023) What is a 9 box matrix? Accessed August 24, 2023, https://in.indeed.com/career-advice/career-development/9-box-matrix#:∼:text=All%20industries%20can%20benefit%20from,goals%20based%20on%20the%20outcome.Google Scholar- (2003) Coming up short on nonfinancial performance measurement. Harvard Bus. Rev. 81(11):88–95.Google Scholar
- (1997) The choice of performance measures in annual bonus contracts. Accounting Rev. 72(2):231–255.Google Scholar
- (2018) More dispersion, higher bonuses? On differentiation in subjective performance evaluations. J. Labor Econom. 36(2):511–549.Crossref, Google Scholar
- (1987) An Analysis of the use of accounting and market measures of performance in executive compensation contracts. J. Accounting Res. 25:85–125.Crossref, Google Scholar
- (2004) The Peter Principle, a theory of decline. J. Political Econom. 112 (S1):S141–S163.Crossref, Google Scholar
- (1981) Rank–Order tournaments as optimum labor contracts. J. Political Econom. 89(5):841–864.Crossref, Google Scholar
- (2016) Nine box grid. Training J. 20–22.Google Scholar
- (2010) How to keep your top talent. Harvard Bus. Rev. 88(5):54–61.Google Scholar
- (2019) Multitasking and subjective performance evaluations: Theory and evidence from a field experiment in a bank. Management Sci. 65(12):5861–5883.Link, Google Scholar
Mercer and Mettl (2020) High–Potential identification survey 2020. Accessed June 1, 2021, https://blog.mettl.com/...2&utm_medium=social&utm_source=facebook&hss_channel=fbp-171382302924212&fbclid=IwAR0kqz01Q52sE5C664ctGNQvuv7dj5CIjy36PkiI_ErrGXTiqFXypH3EMQQ.Google Scholar- (1998)
What happens within firms? A survey of empirical evidence on compensation policies . Haltiwanger J, Manser ME, Topel R, eds. Labor Statistics Measurement Issues (University of Chicago Press, Chicago), 329–356.Google Scholar - (2010)
Managing talent in organizations . Silzer RF, Dowell B, eds. Strategy-Driven Talent Management (Jossey-Bass, San Francisco), 549–593.Google Scholar - (2010)
Identifying and assessing high-potential talent . Silzer RF, Dowell B, eds. Strategy-Driven Talent Management (Jossey-Bass, San Francisco), 213–279.Google Scholar - Strack R, Caye JM, Lassen S, Bhalla V, Puckett J, Espinosa EG, Francour F, et al. (2010) Creating people advantage 2010: How companies can adapt their HR practices for volatile times. Boston Consulting Group, Boston.Google Scholar
Talent Management Institute (2021) Talent management and the 9-box grid: What you must know. Accessed July 7, 2023, https://www.tmi.org/blog/talent-management-and-the-9-box-grid-what-you-must-know.Google ScholarTalent Strategy Group (2015) Potential: Who’s doing what to identify their best? Talent Strategy Group. Accessed June 16, 2021, https://www.hoganassessments.com/wp-content/uploads/2017/01/NTMN20Potential20Study202015.pdf.Google ScholarWhatfix (2022) The 9-box grid: Benefits & limitations in 2023. Accessed July 7, 2023, https://whatfix.com/blog/9-box-grid/.Google Scholar- WorldatWork (2017) WorldatWork research report: Performance management and rewards 2017. Accessed March 7, 2023, https://worldatwork.org/media/CDN/dist/CDN2/documents/pdf/resources/research/performance-mngmnt-rewards-2017.pdf.Google Scholar