Entrepreneur Debt Aversion and Financing Decisions: Evidence from COVID-19 Support Programs
Abstract
An entrepreneur’s negative attitude toward debt (debt aversion) affects the financing decisions of the businesses they run. Controlling for a range of observable traits, firms run by highly debt-averse entrepreneurs are about 10 percentage points less likely to use debt. The same entrepreneurs are also almost 25% less likely to take up government-guaranteed debt during the COVID-19 crisis. These firms show less interest in COVID-19 support policies if they perceive them to involve debt based on experiments randomizing the framing and labeling of otherwise nearly identical hypothetical COVID-19 support policies as debt or grants.
This paper was accepted by Camelia Kuhnen, finance.
Funding: This work was financially supported by the Jenny and Antti Wihuri Foundation. S. Torstila thanks the Foundation for Economic Education and the OP Research Foundation for funding.
Supplemental Material: The online appendix and data files are available at https://doi.org/10.1287/mnsc.2022.03007.
1. Introduction
There is a disconnect between the way debt is discussed in standard finance textbooks and in everyday use. In textbooks, debt is presented as a value-neutral instrument, with an emphasis on the benefits of intertemporal substitution. In everyday use, however, debt is often presented as an evil to be avoided. Many traditional literary sources strongly advise against taking on debt for reasons of self-reliance (“A man in debt is so far a slave”), self-restraint (“Never spend anything before thou have it; for borrowing is the canker and death of every man’s estate”), or threat to social ties (“Neither a borrower nor a lender be; for loan oft loses both itself and friend”).1 The word debt is even etymologically connected to the concepts of guilt and sin in several world languages.2
As a consequence, it appears plausible that people have some level of debt aversion, that is, a generalized negative attitude toward the idea of borrowing. This has been documented in a number of contexts. For example, Field (2009) studies the impact of psychological responses to debt on career choices and finds that framing tuition support as debt, instead of a financially identical tuition waiver, makes it significantly less appealing. Almenberg et al. (2021), using a survey of households in Sweden, show that 56% of people find taking on debt unpleasant and that these attitudes are passed on within families.
Although risk-averse individuals may avoid debt when it increases risk, debt aversion also includes psychological and cultural components that are not captured by classical notions of payoff uncertainty and risk aversion. Haliassos et al. (2017) show evidence that culture is an important determinant of debt use. Despite this growing field of work, entrepreneurs not subject to agency problems are often assumed to operate with a profit-maximizing objective, a fact that is reflected in, for example, government policies designed to support firms.
In this paper, we study whether an entrepreneur’s personal attitude toward debt has an effect on the financing policy of the firm they manage.3 We find that a large share of entrepreneurs are debt averse; that is, they report being uncomfortable with taking on debt. Debt-averse entrepreneurs are less likely to use debt within their firm or to use debt-based rescue packages offered in response to the COVID-19 pandemic. We also conduct experiments that show that debt-averse entrepreneurs are less interested in a hypothetical COVID-19 rescue package if it is labeled as debt compared with a financially equivalent alternative not labeled as debt. Finally, in a follow-up survey, we ask entrepreneurs about their actions if they were offered a direct subsidy or a loan worth one month’s revenue and find that entrepreneurs are twice as likely to invest if offered a direct grant compared with a loan.
We conduct a survey of approximately a thousand small- and medium-sized enterprises (SMEs) in Finland.4 We exclude firms where the survey respondent is a hired manager, leaving us with a sample of 917 owner-managers (whom we shall refer to as entrepreneurs).5 The firms are generally small, with about half the sample employing 5 or fewer people, and the other half employing between 6 and 250 people. In the survey, we ask respondents about their attitude toward debt; their subjective assessment of several personality traits, including optimism, financial literacy, risk aversion, and trust in people and banks; their expectations for their business; and the measures they have taken in response to COVID-19. We link survey responses to financial and other registry information about the firms. We also conduct a simple survey experiment where entrepreneurs compare hypothetical financing options, half of which are framed as debt and half as financially similar nondebt alternatives.
The Finnish government’s COVID-19 rescue packages for SMEs were similar to those implemented in most of northern Europe (for example, Germany, Switzerland, the United Kingdom, and Sweden) and focused on government credit guarantees. The credit guarantee scheme was administered through the private banking system, with banks screening loans and applying for the government credit guarantee on behalf of the firms. The guarantees generally covered 50%–80% of the loan amount. Government ministers have stated that the take-up of government-guaranteed debt used has been substantially lower than expected (Kukkonen 2020). The low take-up of loans is not just a Finnish phenomenon but rather has been the norm across European countries with debt-based programs—For example, The Economist notes that the take-up of partially guaranteed loans has been poor in both the United Kingdom and Spain (The Economist 2020), whereas Core and De Marco (2024) document low take-up of government-guaranteed loans in Italy, Custodio et al. (2021) in Portugal, and Kren et al. (2021) in Ireland. Given the pressure on liquidity caused by the COVID-19 pandemic, why are many firms still so reluctant to use government-guaranteed debt? Our hypothesis is that individual-level debt aversion is correlated with the decision not to take up government-guaranteed debt.
The entrepreneurs in our sample are generally uncomfortable with debt. On a scale of 0–10, with 0 being disagree completely and 10 agree completely, 63% of entrepreneurs answered over 5 to the question “Do you agree with the following statement?: I consider taking on debt to be unpleasant.” Approximately 45% gave an answer of 8, 9, or 10, which we group as High debt aversion in our main analysis.6 We also ask what respondents were taught about debt as children (giving six options) and find that these correlate with reported debt aversion: For instance, being taught that debt was ”something to be avoided” was strongly associated with higher debt aversion.
We find that high entrepreneur debt aversion is associated with a significantly lower likelihood of the firm using debt, both currently and in the past. High debt-averse entrepreneurs are approximately nine percentage points less likely to have debt and to have used debt in the past five years (compared with baseline rates of 48% and 60%). In addition, a one-standard-deviation increase in debt aversion is associated with an approximately seven percentage points lower likelihood of currently having debt. We include in the analysis a separate measure of general risk appetite.7 The results show that debt aversion and risk appetite both have a significant association with the decision to apply for a new loan: High debt aversion decreases the likelihood of applying for a new loan, whereas high risk appetite increases the likelihood.
Some may worry that the results above are driven by factors other than debt aversion. For example, what if past bad experiences with debt cause both debt aversion and low levels of debt? What if managers of riskier firms are more likely to report higher levels of debt aversion? We address this in two ways: first, by looking at firms which are similar in terms of observables and face an unexpected financing need due to the COVID-19 pandemic, and second, by running a simple survey experiment in which firms are offered very similar policy options that differ only in their labeling as debt or a grant. Our second approach builds on a growing experimental literature in economics and other fields studying the effect of social norms on decision making. For example, Bursztyn et al. (2020a) find that a significant portion of Pakistani men are willing to forego a payment labeled as coming from the U.S. government in order to preserve their anti-American identity.8
Our first analysis uses the fact that the COVID-19 pandemic caused a severe unexpected liquidity shock for a large number of firms. The timing of the shock was largely unanticipated and hit most firms at the same time. This provides us with a setting in which firms face unexpected financing needs, alleviating concerns about debt-averse managers self-selecting to low-financing-need firms. The magnitude of the liquidity shock in our sample is correlated with industry, but we control for this, as well as many (self-reported) variables related to the magnitude of the COVID-19 shock on the firm and the need for external financing.9 In case high debt aversion is associated with low willingness to take on new debt even in this exceptional context, we would expect that our results reflect a lower bound on the effect size. We find not only that high debt-averse entrepreneurs were less likely to use debt before the crisis, but also that high debt-averse entrepreneurs are five percentage points less likely to have applied for a new bank loan during the crisis, relative to a sample average of 16%.
However, there may still be concerns that, for example, unobserved characteristics of firms run by non–debt-averse managers caused a larger liquidity shock.10 To mitigate this, we conduct a three-part experiment to see whether simply framing or labeling a contract as debt makes entrepreneurs less interested in it. The experimental design partially resembles that of Caetano et al. (2019) for student loans. We have three “pairs” of financing options, and each respondent is randomly shown one from each pair and asked to evaluate how interested they would be in using it, on a scale of 1–10. Both the order of the three questions and the alternative to be evaluated by the respondent are randomized. The pairs consist of identical or nearly identical policies, where one is framed or labeled as more loan-like and the other either as a direct grant or debt but with some debt-like features made more salient. We find that across all policy pairs, respondents are more willing to take up support framed as direct support rather than a loan or where the loan-like features are made less salient.
The experiments were designed to resemble alternative financial support mechanisms drafted by the government. The objective of the experiments is to provide evidence of whether subtle differences in framing affect entrepreneur interest. That is, we attempt to provide two options that are similar enough (except in an obvious way, their framing as debt) that other personality traits should be uncorrelated with take-up. The conclusions drawn are not reliant on the alternative financial support mechanisms presented being strictly identical: Arguably, full contractual terms would need to be available before it would be possible to conclude that any of the alternatives would or would not be fully equivalent. The question of interest is whether any difference between the framings is more plausibly interpreted in terms of any other differences between the financing alternatives or in terms of debt aversion. Importantly, any alternative story would also need to explain why the difference in interest between the two options is correlated with debt aversion.
The first experiment asks the respondents about their interest in either a loan out of which 75% is forgiven if the firm does not lay off workers (somewhat similar to the U.S. CARES Act Paycheck Protection Program) or a grant covering 75% of the firm’s personnel expenses.11
The second experiment is a more subtle labeling of a policy relevant to the European Union (EU) area, where governments have lent back to firms the value-added tax (VAT) that they paid earlier in 2020. We call the two options either “VAT loan” or “VAT return,” with exactly identical financial terms used in the description; that is, the VAT return is temporary, carries an interest, and has the same maturity as the loan.
The last experiment is about making the loan-like characteristics more salient. One policy alternative is a government-guaranteed loan requiring private collateral for 20% of loan value, whereas the other is a government-guaranteed loan where 80% is forgiven if the firm becomes insolvent as a result of COVID-19.
We also conduct an additional analysis with our experiments where we correlate other traits (optimism, risk appetite, etc.) with the choices in the experiment. The idea of this analysis is to test whether other traits consistently correlate with choices in our experiments: For instance, if the difference in interest between grant and loan forgiveness was correlated with risk appetite, it would suggest that participants did not view the choices as being equally risky, which in turn would jeopardize the validity of the experiment with regard to debt aversion. We find that no trait other than debt aversion consistently correlates with the difference in interest between the two choices.
What are the implications of entrepreneurial debt aversion for firms and entrepreneurs? It is difficult to make strong welfare claims regarding the use of COVID-19 support programs, but we find that highly debt-averse managers were more likely to cancel investments in response to the COVID-19 pandemic than others. They were also much more likely to report high levels of stress during the crisis. We also show that firms run by highly debt-averse managers tend to be smaller than others after controlling for industry, firm age, and a range of manager characteristics (including education). Although we cannot rule out that this effect is driven by an omitted variable correlated with debt aversion, it is highly plausible that firms that avoid debt (the main source of external financing for SMEs) are less likely to invest and hence grow slower than firms run by managers who have a more neutral view of debt.12
In an additional analysis conducted as part of a follow-up survey in August 2020, we ask firms how they would respond to hypothetical offers of either a direct grant or a loan worth one month of revenue. Almost all firms would spend the grant on their business, with almost half of firms replying that they would invest the grant. This suggests that most firms see profitable investment opportunities. However, the share of firms investing if offered a loan is less than half of the share investing a grant, whereas most firms would choose to decline the loan if offered.
To make sure that our results are not driven by unusual behavior during the COVID-19 pandemic, we repeat our analysis of the relationship between the use of debt and entrepreneur debt aversion using a new sample from the Yrittäjägallup-survey conducted in April 2023 by the Federation of Finnish Enterprises. To further validate our measure of debt aversion, we also include two alternative questions related to debt aversion introduced by Albrecht and Meissner (2022). The results using the new survey data from 2023 are similar to our main results. A higher level of debt aversion is significantly negatively associated with the likelihood of having debt. Using a new measure of debt aversion (a composite of the two questions by Albrecht and Meissner) and the two new questions individually also yields similar results as our main measure, with higher levels of debt aversion being associated with a significantly lower likelihood of having debt.
Our study builds on, and contributes to, several strands of literature. First, our study is related to recent work in household finance on individual-level attitudes toward debt. Almenberg et al. (2021) find that more than half of households report being uncomfortable with taking on debt and that these attitudes are correlated with their use of debt. In the context of U.S. student loans, experimental and quasi-experimental studies (Field 2009, Caetano et al. 2019) show that student loans with loan forgiveness enjoy lower take-up than financially equivalent grant programs. There is also a broader literature on the psychology of debt (Prelec and Loewenstein 1998, Almenberg and Karapetyan 2014, Meissner 2016). Zinman (2009) shows that individuals with a combined debit/credit card often prefer to use the debit card, even when the credit card amounts to an interest-free loan when paid at the end of the month. Prior literature also shows that social and cultural norms are important determinant of borrower behavior (Guiso et al. 2013). Although it may seem unsurprising that these attitudes also affect use of debt in firms that are essentially extensions of the entrepreneurs, public policy is often designed with profit-maximizing firms in mind. It is also interesting that an entrepreneur’s debt aversion affects choices where the risk of debt is less relevant for them personally, such as in the take-up of government guarantees (without personal guarantees) in limited liability companies.
Second, we contribute to the growing literature showing evidence that managerial attitudes affect corporate policy (Cronqvist et al. 2012, Graham et al. 2013, Cronqvist and Yu 2017, Korkeamaki et al. 2017) by providing, to the best of our knowledge, the first direct evidence that attitudes toward financial instruments (as opposed to expectations or risk aversion) affect corporate policy. For reviews of how managerial attitudes, biases, and experiences play a role in behavioral corporate finance (Malmendier 2018, Guenzel and Malmendier 2020). The managerial attitudes approach has helped explain why there is considerable heterogeneity in observed capital structures beyond what is predicted by traditional models such as tradeoff theory and pecking order theory. However, one persistent puzzle that remains is that the observed leverage levels of firms tend to be substantially lower than predicted by traditional models (Graham 2000), and a large number of firms have no debt at all (Korteweg 2010, Strebulaev and Yang 2013, El Ghoul et al. 2018). We take findings from the household finance literature on the psychology of debt and link these to the financial policies of SMEs, showing that many entrepreneurs’ personal views toward debt affect financial policy in the firms they manage. We also show that firms run by debt-averse managers tend to grow more slowly.13
Third, our results also have implications for the entrepreneurial finance literature. Debt aversion may act as a constraint to entrepreneurship because new firms often depend on personally guaranteed debt (Robb and Robinson 2014) and a partial explanation for the link between personal wealth and entrepreneurship (Hurst and Lusardi 2004). This is also consistent with evidence that personal attitudes may affect entry into entrepreneurship (Puri and Robinson 2013). In an argument that is close to ours, Nguyen et al. (2020) find evidence that many Vietnamese SMEs do not apply for loans and show that this is correlated with a survey answer response stating that they “do not want to incur debt.” Although plausible, it is not clear to what extent this survey response measures managerial debt aversion as opposed to just not wanting debt for business-related reasons or because of risk aversion. Our survey directly asks about attitude toward debt, providing a more plausible empirical measure of debt aversion. Our use of COVID-19 as a setting and our experimental analyses mirroring prior experimental work also provide a more plausible causal interpretation.
We also add to the emerging literature on the effectiveness of government policies when response to policies is shaped by imperfect information, lack the capability to process information, or are affected by attitudes and social norms (Coibion et al. 2018; D’Acunto et al. 2020, 2023; Custodio et al. 2021). Much of this literature has focused on individuals rather than firms, whereas a growing strand of the literature has shown that the expectations and actions of firms often deviate from the full information rational expectations framework (Bachmann and Elstner 2015, Coibion et al. 2018, Andrade et al. 2020). Weber et al. (2022) also show that when it comes to subjective inflation expectations, firms are not very different from households. Some recent evidence, such as Bedendo et al. (2023), has also documented differences in take-up of COVID-19 support packages across managers from different cultures. Finally, we contribute to the literature on the impact of COVID-19 on SMEs and the design of government rescue packages. The pandemic has significantly impacted firms around the world (Barrero et al. 2020, Bartik et al. 2020, Humphries et al. 2020) and underscored the importance of effective government policies. Our paper is not just relevant for COVID-19 support programs but rather any credit guarantee-based support programs aimed at SMEs.
A big picture implication of our results is that governments should incorporate insights from behavioral economics into their dealings with firms. Even with “nudge units” existing around the world to incorporate behavioral economics into policy, government policy often presumes that firms operate in a profit-maximizing framework. For this reason, rescue policies for firms struggling due to the pandemic may not be as widely adopted as assumed.
Section 2 provides some background information on our setting: the early stages of the COVID-19 pandemic in Finland. Section 3 describes the data. Section 4 presents summary statistics from our sample, a table looking at determinants of debt aversion, and the main results documenting the impact of debt aversion on the use of debt, the use of debt-based government programs during COVID-19, and the perceived attractiveness of hypothetical rescue policies (our experimental results). Section 5 presents the results of additional analyses, such as robustness tests using alternative time periods, definitions of debt aversion, and others.
2. Background Information
We use Finland as the institutional setting for this research because government policy early on in the COVID-19 crisis aimed to help firms by improving access to credit and because even small Finnish SMEs are required to prepare annual accounts, which are made publicly available. In this section, we provide a brief overview of the impact of the COVID-19 pandemic on Finland and measures taken by the government to curb the spread of the disease and to help firms.
Overall, the first wave of COVID-19 did not spread widely in Finland compared with other Western European countries. Because testing was not widespread at the beginning of the outbreak, we use death rates as a proxy for the spread of the disease. As of August 3, 2020, Finland had seen 329 COVID-19–related deaths, from a population of 5.5 million. The virus did not spread evenly across Finland, with the province of Uusimaa (including the capital city, Helsinki) having a death rate double the national average (other hard-hit areas include the border region with Sweden). The first documented case was found relatively early, on January 29, when a Chinese tourist tested positive. In early March, the number of documented cases started to rise rapidly. Finland imposed (once again, compared with Western Europe) a relatively light set of social distancing measures.
The first measures were enacted on 16 March when the government announced that schools and nonessential government services would be closed, people aged over 70 were encouraged to limit contacts, borders were closed to non-Finns/nonresidents,14 and gatherings of more than 50 people were banned. On 20 March, Finland saw its first death from the virus; on March 27, internal borders between the province of Uusimaa and the rest of country were closed to nonessential traffic; and on March 30, bars and restaurants were ordered to close (takeaway and delivery were still possible). The travel ban on the Uusimaa province was lifted on April 15, and other restrictions were lifted starting from May as the rate of new infections fell (on May 4, libraries and other government services were allowed to reopen; on May 14, schools reopened for 2 weeks before the summer holidays; and on June 1, restaurants and certain bars were allowed to reopen with restrictions). Between June and July, the government eased capacity restrictions on restaurants and bars.
The government announced its first support package for firms on March 20. This support package consisted of two elements, chosen mainly because they could be deployed fast: credit guarantees administered through Finnvera, a government-owned body that normally provides export credit and other credit guarantees; and direct “development support” grants administered through Business Finland, a government entity that normally administers direct grants to firms such as research and development (R&D) subsidies. The government did not loan out money directly, but instead, Finnvera guarantees were offered via the private banking system. The guarantees typically covered 80% of the loan amount meaning that banks retained some credit risk and hence screened applicants. The annual cost of the credit guarantee was capped at 1.75% of the loan amount plus a 0.1% one-time administrative fee.
The second element of the support package was direct support in the form of development grants offered by Business Finland (for firms with more than five employees) or grants from local municipalities or regional economic development authorities, henceforth ELY-centers (for firms with less than five employees). The Business Finland development grants ranged from 10,000 euros to 100,000 euros and required firms to submit a plan for a new product or service or a development to an existing product or service: They could not be used to, for instance, retain staff or compensate for lost revenue. In addition, they required the firms themselves to contribute 20% of the costs. The development grants were widely criticized as being poorly targeted and inaccessible for the firms that needed them the most. However, our survey suggests that the various forms of direct support were fairly popular, with 44% of firms having applied for these grants, including over half of surveyed firms in the hospitality (restaurants and hotels) industry.
Finally, following the release of a report recommending direct grants to firms in May, the government announced direct support for hard-hit firms in hard-hit industries, consisting of grants based on past expenses. The details of direct support to firms were not yet available to the public while our survey was conducted, but the firms responding to our survey knew that the government was working on a scheme and some preliminary details (such as the fact that support would be contingent on both a drop in revenues for the firm as well as for the industry the firm operates in), although obviously nothing had been confirmed at that stage.
3. Data and Methodology
3.1. Description of the Data
Our data come from a survey of Finnish SMEs that we commissioned, conducted between May 27 and June 8, 2020, by TNS Kantar (a firm specializing in market research) and aimed to survey 1,000 Finnish SMEs.15 The survey was sent to member firms of the Federation of Finnish Enterprises, a trade body for entrepreneurs, as well as firms whose contact details were available in the Bisnode Finland database. We aimed to oversample firms with more than five employees in the survey. In total, 1,008 firms answered the survey.16 The respondents were mainly entrepreneurs (91%), with 6.3% being nonentrepreneur chief executive officers (CEOs) and 2.6% being chief financial officers (CFOs) or other management (0.1% declined to answer this question). In our results, we focus on the sample of entrepreneurs. All the firms in our sample are private firms; this makes analysis of non–owner-managed firms difficult as it is not clear whether the key decision maker on financial policy is the hired CEO/CFO or the owner.17
Of the firms in our sample, 61% have fewer than 5 employees while 0.5% have over 50 employees, meaning that most firms are very small. Median sales (self-reported) in 2019 are 203,000 euros with the 10th and 90th percentile firms having sales of 19,000 and 2,100,000 euros, respectively. About half (48%) of the firms report having debt.18 Summary statistics on our sample are presented in Table 1. Most firms in our sample report that they either will survive or probably survive the crisis. Fewer than 10% of firms report that they are likely to fail or will fail, though this may be a function of the fact that our survey was conducted relatively late into the first wave of the crisis. However, more than half of the firms in our sample report that they would not survive longer than 6 months without additional financing or assistance.
|

Table 1. Summary Statistics
| Mean | Standard deviation | p10 | p50 | p90 | N | |
|---|---|---|---|---|---|---|
| Firm | ||||||
| 1 employee | 0.386 | 0.487 | 0 | 0 | 1 | 917 |
| 2–4 employees | 0.238 | 0.426 | 0 | 0 | 1 | 917 |
| 5–9 employees | 0.209 | 0.407 | 0 | 0 | 1 | 917 |
| 10–50 employees | 0.141 | 0.348 | 0 | 0 | 1 | 917 |
| 51–250 employees | 0.023 | 0.150 | 0 | 0 | 0 | 917 |
| 250+ employees | 0.003 | 0.057 | 0 | 0 | 0 | 917 |
| Sales () (self-r.)(w.) | 1117 | 3712 | 19 | 204 | 2100 | 804 |
| Firm debt () (self-r.)(w.) | 252 | 866 | 0 | 40 | 425 | 515 |
| Has debt | 0.480 | 0.500 | 0 | 0 | 1 | 917 |
| Had debt last 5y | 0.606 | 0.489 | 0 | 1 | 1 | 917 |
| Accounting ratios | ||||||
| Debt/assets | 0.143 | 0.211 | 0 | 0 | 0.514 | 564 |
| Net debt/EBIT | −0.797 | 3.883 | −5.000 | −0.924 | 5.044 | 450 |
| Net debt/turnover | −0.063 | 0.237 | −0.346 | −0.051 | 0.246 | 537 |
| Cash/assets | 0.305 | 0.263 | 0.016 | 0.242 | 0.742 | 542 |
| Attitudes | ||||||
| High debt aversion | 0.449 | 0.498 | 0 | 0 | 1 | 899 |
| Debt aversion | 6.337 | 2.894 | 2 | 7 | 10 | 899 |
| Risk appetite | 5.976 | 2.169 | 3 | 6 | 9 | 904 |
| Optimism | 7.255 | 1.923 | 5 | 8 | 9 | 901 |
| Distrust people | 5.406 | 2.653 | 2 | 6 | 9 | 903 |
| Distrust banks | 5.132 | 2.769 | 1 | 5 | 9 | 907 |
| Stress increased very much | 0.179 | 0.383 | 0 | 0 | 1 | 917 |
| Firm actions | ||||||
| Applied new bank loan | 0.156 | 0.363 | 0 | 0 | 1 | 917 |
| Applied any loan | 0.184 | 0.388 | 0 | 0 | 1 | 917 |
| Applied direct support | 0.534 | 0.499 | 0 | 1 | 1 | 917 |
| Applied equity | 0.098 | 0.298 | 0 | 0 | 0 | 917 |
| Has laid off | 0.060 | 0.238 | 0 | 0 | 0 | 917 |
| Has furloughed | 0.273 | 0.446 | 0 | 0 | 1 | 917 |
| Canceled inv. | 0.171 | 0.377 | 0 | 0 | 1 | 917 |
| Unpaid ent. comp. | 0.209 | 0.407 | 0 | 0 | 1 | 917 |
| Unpaid taxes | 0.128 | 0.334 | 0 | 0 | 1 | 917 |
| Unpaid wages | 0.009 | 0.093 | 0 | 0 | 0 | 917 |
Note. Summary statistics for the sample.
Filling out the survey took on average eight minutes. The first part of the survey asked for background information, such as the size of the firm, the position of the respondent (entrepreneur, hired CEO, other management etc.), the age, gender and education of the respondent and the firm’s 2019 sales and industry. We then asked firms for the impact of COVID-19 on their revenue (increased, decreased, stayed the same etc.) and an estimate of the size of the effect. About 63% of firms responded that revenues had fallen because of COVID-19, with the average change in revenues being minus 25%. We also asked whether the firm currently has debt / whether the firm has had debt in the past five years as well as whether the owners of the firm had been required to offer guarantees or post collateral for this debt.
We asked firms about the damage caused by COVID-19 to their firm and the measures taken in response. In particular, we asked whether firms had furloughed or laid off employees (and what proportion of workers had been laid off and furloughed): 29% and 6% had done so, respectively. In addition, we asked whether the firm had cut or postponed investments, missed payments to customers (and whether customers had missed payments), or skipped other payments such as taxes or the entrepreneur’s salary.
We included multiple questions about the respondent’s expectations regarding their firm and the economy in general. First, we asked respondents whether their firm will survive the crisis or not, how many months their firm would survive without any external assistance or financing, and their expectation of when revenue will return to 2019 levels. We also included more “neutral” expectations questions such as estimates of Finnish gross domestic product (GDP) in 2020 and 2021 and the probability of GDP falling by more than 15% (an extremely pessimistic estimate compared with most forecasts at the time) and the probability of their firm’s revenue falling by more than 30% over the entire year.
The next section included a range of questions on the financing and assistance options used by the firm. In particular, we asked firms what types of financing/assistance they had applied and received for during the crisis. Direct support programs were most popular, with more than 44% of firms having applied for at least one. Only about 16% of firms had applied for new bank loans, and 19% had applied for payment extensions on current loans (with overlap between the two options). We also asked firms how much they had applied for and for the firms that received loans, what the interest rate on these loans was (on average, 2.8%), and whether personal collateral or guarantees were required. We also ask the firms that did not apply for a loan why they did not do so (more than 50% responded that they did not need a loan, with the second most common reason being that taking on new debt would increase the riskiness of the firm).
We then conducted an experiment (described above) where all respondents received three questions, but the content of these questions was randomized. There were three “pairs” of questions, with each respondent receiving one of the two questions in each pair. The questions described a hypothetical policy option offered by the government and asked the respondent to rate (on a scale of 0–10) how likely they would be to use it if it had been offered at the beginning of the crisis. The first pair of policy options included a loan with a standard guarantee from Finnvera, with the randomization affecting the way the guaranteed portion of the loan is treated in bankruptcy: Half of respondents received a policy with no special treatment, whereas half received a policy where the guaranteed portion is written off in bankruptcy if the firm can show it became insolvent because of COVID-19. The second and third policy options involved various policies being framed either as debt or a grant.
Finally, we asked respondents for their subjective assessments of their risk and financial risk appetite (0–10 scale), whether they consider themselves optimistic, whether they consider themselves good in financial matters (subjective financial literacy), whether they feel people can be trusted, whether they feel banks can be trusted, and two questions on debt aversion. The first debt aversion question asked respondents what they had been taught about debt as a child (more than 60% had been taught that it is something to be used in moderation, 10% that it was a necessary evil, and only 7% that it was a tool for transferring wealth from periods when wealth is high to those when it is low), as well as whether they agree/disagree with the statement “I consider taking debt unpleasant.” We also asked whether the respondent knew anyone who had declared bankruptcy and whether they wanted their kids to take over their business after they retired.
There are limitations to our approach. First, the survey was conducted between May 27 and June 8, 2020, when local infections had fallen from their peak, and some restrictions were being lifted. Thus, the answers to questions on the viability of the firm and recovery times may be less pessimistic than the attitudes at the peak of the first wave of the crisis. In addition, there may be some selection bias in the firms that participated in our survey.19 However, it is not clear how this would bias our cross-sectional results. Although the survey was clearly framed as an academic survey, entrepreneurs might also have viewed it as an opportunity to lobby for direct support for firms. However, it is unlikely that entrepreneurs would have used the “personality trait” questions (our variable of interest) as their instrument for lobbying. Finally, the survey was carried out at a time when there was media speculation that direct support (grants) might be provided to firms.20 It is possible that anticipation of direct support affected our results. Given that our survey mostly asks firms about their use of debt in the past months and explicitly includes a question about “anticipation of better support programs in the future” as a reason for not applying for debt-based relief (with very few firms providing this as a reason), we do not think this would influence our results significantly.
Another concern may be that the questions on financing options used “primed” participants to respond in a different way to the questions on attitudes toward debt. Several things help assuage this concern: The first question on use of debt within the firm was at the beginning of the survey whereas the attitude toward debt question was at the end. Although the use of debt during the crisis question was separated from the attitude toward debt question only by the hypothetical rescue scenarios and other attitudes questions, the debt element was not highlighted here: The question was a multiple choice question where many financing options were presented at once. In addition, the questions on debt attitudes were presented along with a number of questions on attitudes toward various things such as risk.
3.2. Follow-up Survey
About two months after our survey, in August 2020, we sent a follow-up report to firms. In this report, we provided industry-level information (for the industry the firm was operating in) on the size of the COVID-19 shock and measures taken in response. In addition, we linked to a policy report we had created and posted on the Aalto University website detailing the impact of COVID-19 across the entire economy (along with some industry-level figures for all industries). We asked the firms receiving the report to fill out a small survey, and roughly 110 firms did (about 20% of the roughly 500 firms that elected to receive the industry reports). In this survey, we asked them whether they thought the firms they managed had too much, too little, or the right amount of debt. In addition to this, we asked firms about their responses to hypothetical government-backed loans (with either a 3% market interest rate or 1% subsidized interest rate) or grants of one month of revenue.21 We presented the respondents with nine options for both debt and equity.
3.3. Federation of Finnish Enterprises Survey in 2023
Because our main survey was performed during the COVID-19 pandemic in 2020, one possible concern is that our findings are affected by the unusual circumstances at that point in time. To explore the stability of our findings in more “normal” times, as well as to further validate our measure of debt aversion, we add a set of questions to a wave of the Yrittäjägallup survey conducted in April 2023. Yrittäjägallup is a recurring SME survey conducted by the Federation of Finnish Enterprises.
We include our original debt aversion question, a question about the firm’s use of debt, and a new measure consisting of two alternative questions related to debt aversion introduced by Albrecht and Meissner (2022). The new questions are Please rate the following statement (1: strongly agree to 6: strongly disagree): “Debt is an integral part of today’s life,” and What do you think, how does the average participant in this survey/experiment rate the following statement (1: strongly agree to 6: strongly disagree): “There is no excuse for borrowing money,” and the new measure of debt aversion combines the two. Albrecht and Meissner (2022) validate these survey measures with experimental data on debt aversion (also used in Meissner and Albrecht (2022)).
3.4. Key Variable Definitions
Our main variables of interest are attitudes toward debt (debt aversion) and the use of debt. We look at use of debt in two contexts. First, we look at the firm’s use of debt-based rescue packages during the COVID-19 pandemic. Second, we study the use of debt prior to the pandemic, which we obtain from both the survey and from linked financial information. Below, we briefly discuss the key measures we use in our analysis and the survey questions they are based on.
Debt aversion: How well does the following argument describe your relationship with debt? “I consider taking debt unpleasant” (0–10 scale).
Sixty-one percent of respondents answered above 5 and 43% answered 8, 9, or 10. We define high debt aversion as a dummy that takes the value one if the respondent answers either 8, 9, or 10.22 The distribution of responses to the question is presented in Figure 1. We operationalize debt aversion in a second way by asking five questions on “What were you taught about debt as a child?”23 The responses to this question are presented in Figure 2. We find significant correlations between the directly self-reported debt aversion and four of the six possible answers to what the entrepreneur has been taught about debt as a child. The strongest positive correlation with debt aversion is for the question “Should be avoided,” and the strongest negative correlation with “Useful to split large purchases.”
Debt use during COVID-19: Has your company applied for new financing during COVID-19 from some of the following...?
Firms are then presented with a list of potential financing sources (loans, direct support, deferred payments on existing loans) and answer options (No; No, but will use if the crisis continues; Yes, we have applied but not heard back; Yes, we have applied and been rejected; and Yes, we have applied and received this). We create a dummy variable that takes the value one if a firm has applied for a loan (regardless of result), encompassing the answers to several financing options (loan from a bank, loan-back of mandatory pension contributions, and loan from other sources): 18.4% of firms applied for a loan of any sort during the crisis.
General debt use: How much debt does your company have?
Notes. Distribution of entrepreneur responses to the question: “Do you agree with the statement: I consider taking on debt to be unpleasant?” The scale is from 0 (“disagree completely”) to 10 (“agree completely”).
Notes. Which of the following statements describe what you were taught about debt when you were a child? Respondents could choose multiple options.
Given the variation in debt use across firm size and industry, we generally use a dummy specification where firms that have any debt are assigned one and others zero. Just under half of firms report having debt. This may be an underestimation as many firms may have debt-like liabilities (such as deferred payments or trade credit) that they do not consider debt. Firms that report having zero debt are presented with an extra question asking them whether they have had any debt in the past five years. In robustness tests, we combine these two measures into a dummy variable that takes the value one if a firm has debt now or has had debt at any point in the past five years. In addition to these survey-based indicators of debt use, we also construct accounting-based variables of debt use for the firms where we have the relevant accounting items available.
3.5. Determinants of Debt Aversion
We first provide a brief descriptive analysis of the determinants of debt aversion. Although we acknowledge that the results we present are correlations and not causal, they provide important context on debt aversion and also provide a useful “sanity check” of our debt aversion measure. We therefore regress a person’s level of debt aversion (defined in the section above) on their response to what they were taught about debt as a child, their attitudes (trust in banks, trust in people, optimism, and risk appetite), and demographics.
First, we focus on attitudes about debt that the respondents were taught as children. We perform a regression analysis with debt aversion as the dependent variable, using indicators for various statements about debt attitudes that the respondent was passed on as a child. The results are shown in Panel A of Table 2. Those that were taught that debt is “something to be used in moderation” or “should be avoided” are more likely to view taking on debt as unpleasant, whereas those who were taught that debt is “useful for splitting large purchases” or “useful for transferring money over time” are less likely to view taking on debt as unpleasant.
|
Table 2. Determinants of Debt Aversion
| Panel A: Debt aversion and childhood debt attitudes | ||||||||
|---|---|---|---|---|---|---|---|---|
| (1) | (2) | (3) | (4) | (5) | (6) | (7) | (8) | |
| Should be used in moderation | 0.375* | 0.641*** | 0.722*** | |||||
| (0.205) | (0.199) | (0.189) | ||||||
| Promise to be kept | −0.278 | −0.100 | 0.016 | |||||
| (0.214) | (0.205) | (0.203) | ||||||
| Should be avoided | 1.820*** | 1.790*** | 1.749*** | |||||
| (0.200) | (0.209) | (0.203) | ||||||
| Necessary evil | 0.508* | 0.562* | 0.566* | |||||
| (0.300) | (0.294) | (0.301) | ||||||
| Useful to split large purchases | −1.775*** | −1.267*** | −0.996*** | |||||
| (0.256) | (0.258) | (0.306) | ||||||
| Useful to transfer money over time | −1.578*** | −0.890** | −0.579** | |||||
| (0.414) | (0.408) | (0.293) | ||||||
| Constant | 6.108*** | 6.421*** | 5.871*** | 6.285*** | 6.637*** | 6.435*** | 5.731*** | |
| (0.169) | (0.114) | (0.111) | (0.102) | (0.103) | (0.099) | (0.198) | ||
| Age and gender | No | No | No | No | No | No | No | Yes |
| Personality traits | No | No | No | No | No | No | No | Yes |
| Education level fixed effects | No | No | No | No | No | No | No | Yes |
| Education field fixed effects | No | No | No | No | No | No | No | Yes |
| N | 899 | 899 | 899 | 899 | 899 | 899 | 899 | 865 |
| 0.004 | 0.002 | 0.075 | 0.003 | 0.053 | 0.017 | 0.132 | 0.230 | |
| Panel B: Debt aversion and entrepreneur characteristics | ||||||
|---|---|---|---|---|---|---|
| (1) | (2) | (3) | (4) | (5) | (6) | |
| ln(Age) | −0.825* | −0.788* | −0.804** | |||
| (0.483) | (0.474) | (0.397) | ||||
| Female | 0.835*** | 0.636*** | 0.520*** | |||
| (0.191) | (0.201) | (0.190) | ||||
| Risk appetite | −0.360*** | −0.347*** | −0.349*** | |||
| (0.045) | (0.047) | (0.045) | ||||
| Optimism | 0.069 | 0.057 | 0.050 | |||
| (0.054) | (0.056) | (0.061) | ||||
| Distrust people | 0.055 | 0.044 | 0.042 | |||
| (0.042) | (0.043) | (0.044) | ||||
| Distrust banks | 0.112*** | 0.125*** | 0.129*** | |||
| (0.040) | (0.041) | (0.034) | ||||
| Vocational | 0.177 | 0.032 | ||||
| (0.319) | (0.319) | |||||
| Polytechnic | 0.527* | 0.457 | ||||
| (0.308) | (0.309) | |||||
| University | −0.249 | −0.199 | ||||
| (0.311) | (0.309) | |||||
| Constant | 9.576*** | 6.038*** | 7.112*** | 6.220*** | 9.905*** | |
| (1.897) | (0.125) | (0.509) | (0.256) | (1.899) | ||
| Education level fixed effects | No | No | No | No | No | Yes |
| Education field fixed effects | No | No | No | No | No | Yes |
| N | 880 | 899 | 884 | 899 | 865 | 865 |
| 0.003 | 0.019 | 0.083 | 0.011 | 0.110 | 0.128 | |
Notes. The dependent variable is Debt aversion, ranging from 0 (lowest) to 10 (highest). In Panel A, the independent variables are dummies indicating chosen answers to the question “Which of the following statements best describe what you were taught about debt when you were a child?” Indicated controls for Age and gender include ln(Age) and a dummy indicating female entrepreneurs. Personality traits include Risk appetite, Optimism, Distrust people, and Distrust banks. Heteroscedasticity-consistent robust standard errors are shown in parentheses.
*, **, and ***Significance levels at 0.1, 0.05, and 0.01, respectively.
We then study the level of debt aversion across different demographic groups. The results are shown in Panel B of Table 2. We find that higher entrepreneur age is associated with lower levels of debt aversion, whereas female entrepreneurs exhibit higher levels of debt aversion. There is also a significant negative correlation between risk appetite and debt aversion, whereas entrepreneurs who distrust banks are also more debt averse. The differences across different levels of education are not large, but those who studied at a polytechnic appear slightly more debt averse than others.
4. Main Results
4.1. Debt Aversion and General Use of Debt
We then study the relationship between entrepreneur debt aversion and the general use of debt prior to the pandemic. We construct two outcome dummy variables, Has debt and Had debt 5y, indicating whether the firm has debt currently and whether it has had debt at some point during the last five years. We then perform two sets of regressions as follows:
The results are shown in Panel A of Table 3. We find a significant negative relationship that is slightly mitigated by the inclusion of control variables. Highly debt-averse entrepreneurs are 9%–14% points less likely to have debt compared with a baseline of about 48% of firms having debt. This difference is statistically significant and economically large. We find similar results when including debt aversion as a continuous variable.24
|
Table 3. Debt Use and Cash Holdings vs. Debt Aversion
| Panel A: Current and historical debt use | ||||||||
|---|---|---|---|---|---|---|---|---|
| Has debt | Had debt 5y | |||||||
| (1) | (2) | (3) | (4) | (5) | (6) | (7) | (8) | |
| High debt aversion | −0.135*** | −0.094*** | −0.128*** | −0.090*** | ||||
| (0.033) | (0.030) | (0.031) | (0.025) | |||||
| Debt aversion | −0.025*** | −0.019*** | −0.024*** | −0.020*** | ||||
| (0.005) | (0.005) | (0.004) | (0.004) | |||||
| Risk appetite | 0.016** | 0.014* | 0.014* | 0.012 | ||||
| (0.008) | (0.008) | (0.008) | (0.008) | |||||
| Optimism | 0.007 | 0.006 | −0.002 | −0.002 | ||||
| (0.009) | (0.009) | (0.008) | (0.008) | |||||
| Distrust people | 0.009 | 0.009 | 0.007 | 0.007 | ||||
| (0.006) | (0.006) | (0.006) | (0.006) | |||||
| Distrust banks | −0.006 | −0.005 | −0.008 | −0.007 | ||||
| (0.006) | (0.006) | (0.006) | (0.007) | |||||
| Firm size fixed effects | No | Yes | No | Yes | No | Yes | No | Yes |
| Industry fixed effects | No | Yes | No | Yes | No | Yes | No | Yes |
| Survival fixed effects | No | Yes | No | Yes | No | Yes | No | Yes |
| Survival time fixed effects | No | Yes | No | Yes | No | Yes | No | Yes |
| Education level fixed effects | No | Yes | No | Yes | No | Yes | No | Yes |
| Education field fixed effects | No | Yes | No | Yes | No | Yes | No | Yes |
| N | 899 | 883 | 899 | 883 | 899 | 883 | 899 | 883 |
| 0.018 | 0.214 | 0.021 | 0.217 | 0.017 | 0.236 | 0.021 | 0.240 | |
| Panel B: Debt and cash holdings | ||||||||
|---|---|---|---|---|---|---|---|---|
| Debt/assets | Net debt/EBIT | Net debt/turnover | Cash/assets | |||||
| (1) | (2) | (3) | (4) | (5) | (6) | (7) | (8) | |
| High debt aversion | −0.037* | −0.561 | −0.033 | 0.036 | ||||
| (0.020) | (0.441) | (0.022) | (0.023) | |||||
| Debt aversion | −0.008* | −0.113* | −0.006 | 0.006 | ||||
| (0.004) | (0.060) | (0.005) | (0.005) | |||||
| Risk appetite | 0.006 | 0.006 | 0.124 | 0.116 | 0.003 | 0.002 | −0.003 | −0.003 |
| (0.004) | (0.005) | (0.091) | (0.088) | (0.005) | (0.005) | (0.005) | (0.005) | |
| Optimism | 0.003 | 0.002 | 0.066 | 0.057 | 0.010* | 0.009 | −0.007 | −0.006 |
| (0.005) | (0.004) | (0.089) | (0.089) | (0.006) | (0.006) | (0.006) | (0.006) | |
| Distrust people | 0.004 | 0.004 | −0.010 | −0.010 | 0.001 | 0.001 | −0.001 | −0.001 |
| (0.005) | (0.005) | (0.091) | (0.093) | (0.005) | (0.005) | (0.004) | (0.004) | |
| Distrust banks | −0.004 | −0.004 | −0.083 | −0.077 | −0.001 | −0.001 | −0.005 | −0.005 |
| (0.004) | (0.004) | (0.068) | (0.067) | (0.004) | (0.004) | (0.004) | (0.004) | |
| Firm size fixed effects | Yes | Yes | Yes | Yes | Yes | Yes | Yes | Yes |
| Industry fixed effects | Yes | Yes | Yes | Yes | Yes | Yes | Yes | Yes |
| Survival fixed effects | Yes | Yes | Yes | Yes | Yes | Yes | Yes | Yes |
| Survival time fixed effects | Yes | Yes | Yes | Yes | Yes | Yes | Yes | Yes |
| Education level fixed effects | Yes | Yes | Yes | Yes | Yes | Yes | Yes | Yes |
| Education field fixed effects | Yes | Yes | Yes | Yes | Yes | Yes | Yes | Yes |
| N | 543 | 543 | 435 | 435 | 516 | 516 | 521 | 521 |
| 0.164 | 0.167 | 0.181 | 0.183 | 0.192 | 0.193 | 0.298 | 0.298 | |
Notes. The dependent variable is shown above each column. Has debt is a dummy taking the value one if the firm reported having existing debt. Had debt 5y is a dummy taking the value one if the firm reported having had debt at some point during the last five years. In Panel B, the dependent variables are calculated based on financial statement data matched to our survey. The samples consist of all firms where the dependent variable is available. Standard errors are clustered by municipality and shown in parentheses.
*, **, and ***Significance levels at 0.1, 0.05, and 0.01, respectively.
Using financial statement data for those firms for which it is available, we then construct a number of ratios indicating the use of debt and the level of cash holdings and study the effect of debt aversion on those measures.25 The results are shown in Panel B of Table 3. Firms run by high debt-averse entrepreneurs have significantly lower levels of debt, with nearly 3.8% points lower debt/assets ratio, representing 26% decrease relative to the sample average of 14%. The results for other financial ratios are typically directionally consistent (i.e., debt aversion is associated with lower levels of debt) but not statistically significant.
To explore whether the negative relationship between debt aversion and the use of debt is linear, we modify the regression analysis presented in Panel A of Table 3 and, instead of continuous debt aversion, include dummies indicating different quartiles of debt aversion. The results are presented in Figure 3. The relationship between the use of debt and the level of debt aversion is monotonic and visually not far away from being linear, although the effect seems to more pronounced for the highest debt aversion quartile.
Notes. This figure shows the estimated regression coefficient for each debt aversion quartile dummy from the following regression: where Has debt is a dummy taking the value one if the firm reported having existing debt; X is the same vector of controls as in Table 3 (column (2)). We repeat the same regression for Had debt 5y, a dummy taking the value one if the firm reported having had debt at some point during the last five years.
4.2. Debt Aversion and Use of Debt During the COVID-19 Pandemic
As discussed above, the COVID-19 pandemic provides a setup where many firms unexpectedly need liquidity, and debt is the main option on offer. Hence, we study firms’ decisions to take-up new loans during the pandemic, depending on the manager’s debt aversion. We define a dummy variable Applied new bank loan, taking the value of one if the firm has applied for a new bank loan during the pandemic. We then perform a similar regression as above. We include some additional controls to better capture firm-level heterogeneity in exposure to the pandemic. These include sales impact fixed effects (once again, based on response options, e.g., sales decreased, sales stayed the same, sales grew) and time to normality fixed effects (response options, e.g., sales were not impacted, less than one month, one to two months.).
The results are shown in Table 4. The coefficient of high debt aversion is consistently negative and significant at either the 5% or 10% level, depending on the specification. Entrepreneurs that are highly debt averse are approximately five percentage points less likely to have applied for a new bank loan during the crisis compared with a baseline rate of 16% that applied for bank loans. Risk appetite is also significantly negatively correlated with the used of debt during the pandemic, suggesting that more risk-averse entrepreneurs are less likely to take on new debt. Optimism and trust are not significantly correlated with the use of debt. We also note that the relationship between debt aversion and take-up of new loans during the pandemic appears nonlinear. The results are statistically more significant for a dummy indicating high levels of debt aversion than when including debt aversion as a continuous variable.26
|
Table 4. New Bank Loans During COVID-19 Pandemic vs. Debt Aversion
| (1) | (2) | (3) | (4) | (5) | (6) | |
|---|---|---|---|---|---|---|
| High debt aversion | −0.058** | −0.047* | −0.045* | |||
| (0.026) | (0.025) | (0.024) | ||||
| Debt aversion | −0.007 | −0.006 | −0.006 | |||
| (0.005) | (0.005) | (0.005) | ||||
| Risk appetite | 0.010* | 0.011* | 0.010* | 0.011* | ||
| (0.006) | (0.006) | (0.006) | (0.006) | |||
| Optimism | −0.008 | −0.009 | −0.009 | −0.010 | ||
| (0.008) | (0.008) | (0.008) | (0.008) | |||
| Distrust people | 0.005 | 0.004 | 0.004 | 0.004 | ||
| (0.005) | (0.006) | (0.005) | (0.006) | |||
| Distrust banks | 0.005 | 0.005 | 0.005 | 0.005 | ||
| (0.004) | (0.004) | (0.004) | (0.004) | |||
| Firm size fixed effects | No | Yes | Yes | No | Yes | Yes |
| Industry fixed effects | No | Yes | Yes | No | Yes | Yes |
| Survival fixed effects | No | Yes | Yes | No | Yes | Yes |
| Survival time fixed effects | No | Yes | Yes | No | Yes | Yes |
| Sales impact fixed effects | No | No | Yes | No | No | Yes |
| Time to normal fixed effects | No | No | Yes | No | No | Yes |
| Education level fixed effects | No | Yes | Yes | No | Yes | Yes |
| Education field fixed effects | No | Yes | Yes | No | Yes | Yes |
| N | 899 | 883 | 883 | 899 | 883 | 883 |
| 0.006 | 0.185 | 0.193 | 0.003 | 0.184 | 0.192 |
Notes. The dependent variable is Applied new bank loan, a dummy taking the value one if the firm reported having applied for a new bank loan during the COVID-19 crisis. Standard errors are clustered by municipality and shown in parentheses.
*, **, and ***Significance levels at 0.1, 0.05, and 0.01, respectively.
4.3. Experiments on Framing
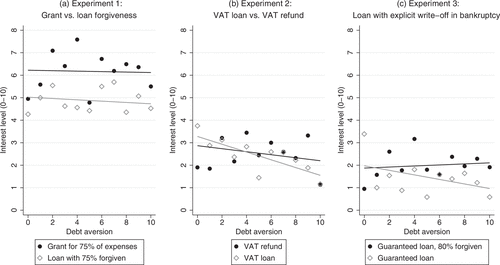
In this section, we conduct a set of experiments to study the impact of debt aversion on the take-up of government support for SMEs. We compare the level of interest in three “pairs” of hypothetical policies, and each respondent is randomly shown one from each pair. The pairs consist of identical or nearly identical policies, where one is framed as more loan-like and the other either as a direct grant or debt but with making some debt-like features more salient. In each pair, the respondent is asked to rate (on a 0–10 scale) how likely they would be to use the presented policy if it was offered and they were at the beginning of the COVID-19 crisis. For each question, we create a Debt framing dummy variable that takes the value one if the respondent was shown the policy option where the policy is framed as being debt based, or in the case of Experiment 3, where the debt-like features are more salient.
The framing of the questions is as follows.
Common introduction: In this question, we will present one support option that has been a subject of public conversation. Considering your company’s state at the beginning of COVID-19 crisis, would you have applied for support with the following terms?
Experiment 1:
Control: The government will pay 75% of salaries if employees are not temporarily laid off or permanently dismissed.
Treatment: The government offers a loan of which 75% will be forgiven if employees are not temporarily laid off or permanently dismissed.
Experiment 2:
Control: A VAT refund, where VATs paid at the beginning of this year would be temporarily refunded to companies. The refund would have to be paid back in two years with a 3% annual interest.
Treatment: A VAT loan, where VATs paid at the beginning of this year would be temporarily lent back to companies. The loan would have to be paid back in two years with a 3% annual interest.
Experiment 3:
Control: A bank will lend with 6% interest. The loan is 80% guaranteed by Finnvera. The cost of Finnvera’s guarantee is 1.75% of the loan amount. You will need the other 20% to be collateralized by something else; 80% of the loan amount is forgiven if your company will face a permanent insolvency due to COVID-19 crisis.
Treatment: A bank will lend with 6% interest. The loan is 80% guaranteed by Finnvera. The cost of Finnvera’s guarantee is 1.75% of the loan amount. You will need the other 20% to be collateralized by something else.
A graphical presentation of the results is shown in Figures 4 and 5. Table 5 shows the corresponding regression results. In these analyses, there are two aspects of interest. First, general debt aversion would suggest generally higher interest for the support alternatives that are framed as nondebt, or less debt like. Second, we might expect the difference in interest to be larger for entrepreneurs that are more debt averse. These two aspects are illustrated by Figure 5. The level difference at low levels of debt aversion indicates whether options are perceived differently regardless of debt aversion. A difference in slopes of the fitted lines implies different sensitivity to the debt framing depending on entrepreneur debt aversion.
Note. Distribution of expressed level of interest in each alternative on a scale of 0 (no interest at all) to 10 (highest level of interest).
Note. Average level of interest in each alternative on a scale of 0 (no interest at all) to 10 (highest level of interest), plotted against the respondent debt aversion.
|
Table 5. Experiments: Framing as Debt
| Panel A: Summary statistics | ||||||
|---|---|---|---|---|---|---|
| Mean | Standard deviation | p10 | p50 | p90 | N | |
| Grant vs. loan forgiveness | ||||||
| Interest level | 5.485 | 3.983 | 0 | 7 | 10 | 792 |
| Zero interest | 0.261 | 0.440 | 0 | 0 | 1 | 792 |
| VAT loan vs. VAT refund | ||||||
| Interest level | 2.308 | 3.176 | 0 | 0 | 8 | 851 |
| Zero interest | 0.504 | 0.500 | 0 | 1 | 1 | 851 |
| Loan with explicit write-off | ||||||
| Interest level | 1.656 | 2.746 | 0 | 0 | 7 | 815 |
| Zero interest | 0.585 | 0.493 | 0 | 1 | 1 | 815 |
| Panel B: Grant vs. loan forgiveness of 75% employee costs | ||||||
|---|---|---|---|---|---|---|
| Interest level (0–10) | Zero interest (dummy) | |||||
| (1) | (2) | (3) | (4) | (5) | (6) | |
| Debt framing | −1.331*** | −0.756** | −0.254 | 0.082*** | −0.004 | −0.081 |
| (0.249) | (0.304) | (0.660) | (0.028) | (0.037) | (0.085) | |
| Debt framing High debt a. | −0.785 | 0.123** | ||||
| (0.510) | (0.060) | |||||
| High debt aversion | 0.524 | −0.027 | ||||
| (0.373) | (0.037) | |||||
| Debt framing Debt aversion | −0.137 | 0.021* | ||||
| (0.100) | (0.012) | |||||
| Debt aversion | 0.115 | −0.013 | ||||
| (0.074) | (0.008) | |||||
| Controls | No | Yes | Yes | No | Yes | Yes |
| Firm size fixed effects | No | Yes | Yes | No | Yes | Yes |
| Industry fixed effects | No | Yes | Yes | No | Yes | Yes |
| Survival fixed effects | No | Yes | Yes | No | Yes | Yes |
| Survival time fixed effects | No | Yes | Yes | No | Yes | Yes |
| Education level fixed effects | No | Yes | Yes | No | Yes | Yes |
| Education field fixed effects | No | Yes | Yes | No | Yes | Yes |
| N | 792 | 778 | 778 | 792 | 778 | 778 |
| 0.028 | 0.274 | 0.275 | 0.009 | 0.247 | 0.246 | |
| Panel C: VAT loan vs. VAT refund | ||||||
|---|---|---|---|---|---|---|
| Interest level (0–10) | Zero interest (dummy) | |||||
| (1) | (2) | (3) | (4) | (5) | (6) | |
| Debt framing | −0.267 | 0.014 | 0.650 | 0.025 | −0.051 | −0.166** |
| (0.192) | (0.314) | (0.622) | (0.033) | (0.046) | (0.082) | |
| Debt framing High debt a. | −0.276 | 0.155** | ||||
| (0.457) | (0.064) | |||||
| High debt aversion | −0.475 | 0.047 | ||||
| (0.348) | (0.046) | |||||
| Debt framing Debt aversion | −0.116 | 0.028** | ||||
| (0.084) | (0.012) | |||||
| Debt aversion | −0.061 | 0.001 | ||||
| (0.068) | (0.010) | |||||
| Controls | No | Yes | Yes | No | Yes | Yes |
| Firm size fixed effects | No | Yes | Yes | No | Yes | Yes |
| Industry fixed effects | No | Yes | Yes | No | Yes | Yes |
| Survival fixed effects | No | Yes | Yes | No | Yes | Yes |
| Survival time fixed effects | No | Yes | Yes | No | Yes | Yes |
| Education level fixed effects | No | Yes | Yes | No | Yes | Yes |
| Education field fixed effects | No | Yes | Yes | No | Yes | Yes |
| N | 851 | 835 | 835 | 851 | 835 | 835 |
| 0.002 | 0.140 | 0.144 | 0.001 | 0.160 | 0.154 | |
| Panel D: Loan with explicit write-off in bankruptcy | ||||||
|---|---|---|---|---|---|---|
| Interest level (0–10) | Zero interest (dummy) | |||||
| (1) | (2) | (3) | (4) | (5) | (6) | |
| No write–off | −0.687*** | −0.589*** | 0.059 | 0.145*** | 0.163*** | 0.068 |
| (0.157) | (0.219) | (0.441) | (0.029) | (0.046) | (0.089) | |
| No write–off High debt a. | −0.204 | −0.061 | ||||
| (0.405) | (0.066) | |||||
| High debt aversion | −0.036 | 0.102* | ||||
| (0.309) | (0.053) | |||||
| No write–off Debt aversion | −0.117* | 0.011 | ||||
| (0.067) | (0.013) | |||||
| Debt aversion | 0.010 | 0.004 | ||||
| (0.055) | (0.010) | |||||
| Controls | No | Yes | Yes | No | Yes | Yes |
| Firm size fixed effects | No | Yes | Yes | No | Yes | Yes |
| Industry fixed effects | No | Yes | Yes | No | Yes | Yes |
| Survival fixed effects | No | Yes | Yes | No | Yes | Yes |
| Survival time fixed effects | No | Yes | Yes | No | Yes | Yes |
| Education level fixed effects | No | Yes | Yes | No | Yes | Yes |
| Education field fixed effects | No | Yes | Yes | No | Yes | Yes |
| N | 815 | 797 | 797 | 815 | 797 | 797 |
| 0.016 | 0.144 | 0.149 | 0.022 | 0.125 | 0.124 | |
Notes. The dependent variable is shown above each column. Interest level is the reported level of interest on a scale of 0 (lowest interest) to 10 (highest interest). Zero interest is a dummy taking the value one if the respondent has no interest at all in this form of support. Standard errors are clustered by municipality and shown in parentheses.
*, **, and ***Significance levels at 0.1, 0.05, and 0.01, respectively.
In Table 5, for each experiment, we present three regression specifications for two separate outcomes. The first outcome is the reported interest level on a scale of 0–10, and the second is a dummy that takes the value of 1 if the reported interest is 0. The first specification is a simple analysis of whether receiving the debt-framed choice lowers interest across all participants. Given that most of our participants are debt averse, this dummy will capture debt aversion and any other differences between the two options. In the second specification, we include the High debt aversion variable and an interaction between High debt aversion and the Debt framing dummy. In this case, the Debt framing dummy captures the difference in interest between the options for all participants with reported debt aversion below eight; that is, it may still include debt-averse entrepreneurs. In the final specification, we include the Debt aversion score (0–10 scale) and an interaction of this variable with the Debt framing dummy. It is important to emphasize that the interpretation of the Debt framing dummy in this specification is different from the prior two. In this specification, the Debt framing dummy represents the difference in interest between the two options for people reporting a debt aversion value of zero. That is, the Debt framing dummy no longer includes debt-averse individuals. This is important to note because, as will be discussed below, in most of our experiments the Debt Framing dummy is statistically and economically significant in the first two specifications but not the third. This indicates that people reporting low debt aversion perceive the options in the experiments to be fairly similar with differences being driven by debt-averse participants.
The first experiment focuses on framing and asks the respondents about their interest in either a loan, of which 75% is forgiven if the firm does not lay off workers or a grant covering 75% of the firm’s personnel expenses. In this case, the loan actually objectively dominates the grant option because we do not specify that the loan amount is restricted to the amount of personnel expenses. Therefore, in principle, the forgiven loan amount could be larger than the direct grant.27 Figure 4 shows a clearly visible difference in the level of interest between these two options, notably in favor of the grant covering 75% of personnel expenses. Panel B of Table 5 shows that the loan-with-write-off option is less popular than the grant. The interaction terms Debt framing High debt aversion and Debt framing Debt aversion are economically but not statistically significant when the outcome variable is interest level and significant at the 10% level when the outcome variable is the zero interest dummy. In the full sample, the loan receives −1.33 points lower interest on a 0–10 scale, equivalent to 33% of the standard deviation of the interest variable. People with debt aversion levels from 1 to 7 have 0.8 points lower levels of interest and people with high debt aversion scores (8–10) reporting about 1.5 points less interest (compared with an average level of interest of about 5.5 points).
The second experiment is a much more subtle labeling of a policy discussed in the Finnish media, whereby the government would lend back to firms the VAT that they have paid earlier in the year. We call this option either “VAT loan” or “VAT return,” with identical financial terms in the description. As one might expect, the differences are much smaller than with the first experiment. In this case, as shown in Figure 5, there is no difference in interest at low levels of debt aversion but a visible difference in the slope. In other words, more debt-averse entrepreneurs are sensitive to the debt framing, whereas low debt-averse entrepreneurs are not. The regression results in Table 5 provide some support for this interpretation. The likelihood of reporting zero interest for the debt option, relative to refund option, is significantly higher for high debt-averse entrepreneurs. For this high debt-averse group, simply changing the name of the support to “loan” is enough to increase the zero-interest responses by 15 percentage points. Directionally, the results are similar for the average interest level measured as a continuous variable, but the difference is not statistically significant.
The last experiment is about making the loan-like characteristics more salient. One policy is a normal government-guaranteed loan and the other is a government-guaranteed loan where 80% is forgiven if the firm becomes insolvent as a result of COVID-19. Both formulations state the need for 20% collateral. Given equity-holders generally receive nothing in a Finnish bankruptcy, it is not clear that this forgiveness of 80% of the loan has any real impact. In both cases, the entrepreneur would highly likely lose the collateral but would have any other liability nullified by bankruptcy. If interpreted as an increase in the likelihood of the entrepreneur to receive some nonzero amount at the bankruptcy, it might be perceived as a reduction in the downside risk of the loan. Not mentioning the write-off option (No write-off) decreases interest by about 0.6 points (25% of the standard deviation) and increases the proportion of participants reporting zero interest by 14–16 percentage points. Although the interaction between No write-off and High debt aversion is also associated with lower interest, it appears to be associated with a lower percentage of respondents reporting zero interest. Neither difference is statistically significant.
Based on Figure 5, the results appear somewhere between the first two experiments. There seems to be a general level difference favoring the alternative with explicit write-off in bankruptcy, as well as a slight difference in the slope of the line. The regression analysis in Table 5 shows a significant difference in the general level of interest, with the average level of interest being significantly higher with the explicit forgiveness alternative. This is also true in the case of zero interest responses. The interaction term between Debt framing and high debt aversion is not significantly different from zero, but high debt-averse entrepreneurs are generally more likely to have zero interest in either version of the loan. This makes sense, as both options are explicitly framed as loan, so one might expect debt aversion to reduce interest in both.
Figure 4 shows that loan-type instruments are generally less preferred than similar instruments not described as loans (Experiments 1 and 2), especially when loan forgiveness is specifically discussed (Experiment 2). Experiment 2 involves the cleanest comparison between exactly the type of financial instruments, but with one labeled as debt and the other one not. The differences between the two treatments are much smaller than in Experiment 1. However, Figure 5 shows that Experiment 2 is also the one in which differences in willingness to take up debt are stronger. For the high debt-averse group, simply changing the name of the support to “loan” is enough in substantially increase the share of zero-interest responses.
Across all experiments, the results are generally consistent with debt aversion being negatively associated with the level of debt, but the association between debt aversion and the choice to avoid debt completely (i.e., show zero interest in the hypothetical policies) is generally statistically and economically more robust. This is consistent with the results in Table 3, where the association between debt aversion and the decision to use debt is more robust than the relationship between debt aversion and the level of debt.
4.4. Controlling for Other Traits in Experiments
One concern may be that participants do not view the experimental options as being identical or nearly identical (other than their framing as debt based or not). In Table 6, we conduct an additional analysis where we test whether the other personality traits we collected data on predict differences in take-up between the debt-framed and non–debt-framed options. Most importantly, we are interested in whether the difference in interest between the two options is associated with any of our other personality traits. For instance, do more risk-averse people show less interest in debt-framed options than non–debt-framed options? We also include traits that have been shown to be correlated with risky investment decisions, such as distrust in banks and general distrust in people (Guiso et al. 2008, D’Acunto et al. 2023).
|
Table 6. Experiment: Controlling for Other Traits
| Grant vs. forgiveness | VAT loan vs. refund | Debt write–off | ||||
|---|---|---|---|---|---|---|
| (1) | (2) | (3) | (4) | (5) | (6) | |
| Debt framing | 0.208 | 0.273 | −0.146 | −0.103 | 0.206 | 0.197 |
| (0.165) | (0.171) | (0.179) | (0.151) | (0.182) | (0.156) | |
| High debt aversion | −0.014 | −0.027 | 0.030 | 0.049 | 0.093* | 0.098* |
| (0.044) | (0.037) | (0.050) | (0.046) | (0.053) | (0.052) | |
| Debt framing High debt aversion | 0.120* | 0.130** | 0.145** | 0.151** | −0.081 | −0.053 |
| (0.064) | (0.058) | (0.072) | (0.064) | (0.073) | (0.069) | |
| Optimism | 0.013 | 0.009 | −0.002 | −0.016 | 0.012 | 0.005 |
| (0.011) | (0.009) | (0.012) | (0.011) | (0.014) | (0.012) | |
| Debt framing Optimism | −0.007 | −0.019 | 0.003 | 0.002 | −0.020 | −0.035** |
| (0.018) | (0.016) | (0.019) | (0.017) | (0.019) | (0.016) | |
| Risk appetite | −0.026** | −0.010 | −0.005 | 0.006 | −0.013 | −0.012 |
| (0.012) | (0.010) | (0.012) | (0.010) | (0.012) | (0.011) | |
| Debt framing Risk appetite | −0.006 | −0.006 | 0.009 | 0.000 | 0.007 | 0.016 |
| (0.017) | (0.014) | (0.017) | (0.014) | (0.017) | (0.014) | |
| Distrust people | 0.004 | 0.011 | 0.015 | 0.014* | −0.008 | −0.012 |
| (0.009) | (0.011) | (0.010) | (0.009) | (0.011) | (0.012) | |
| Debt framing Distrust people | −0.003 | −0.006 | 0.010 | 0.005 | 0.017 | 0.024* |
| (0.013) | (0.012) | (0.014) | (0.012) | (0.014) | (0.014) | |
| Distrust banks | −0.003 | −0.001 | −0.009 | −0.007 | 0.002 | 0.006 |
| (0.008) | (0.007) | (0.009) | (0.010) | (0.010) | (0.010) | |
| Debt framing Distrust banks | −0.017 | −0.015 | −0.006 | 0.002 | −0.004 | −0.002 |
| (0.012) | (0.012) | (0.014) | (0.016) | (0.014) | (0.011) | |
| Firm size fixed effects | No | Yes | No | Yes | No | Yes |
| Industry fixed effects | No | Yes | No | Yes | No | Yes |
| Survival fixed effects | No | Yes | No | Yes | No | Yes |
| Survival time fixed effects | No | Yes | No | Yes | No | Yes |
| Education level fixed effects | No | Yes | No | Yes | No | Yes |
| Education field fixed effects | No | Yes | No | Yes | No | Yes |
| N | 781 | 778 | 836 | 835 | 799 | 797 |
| 0.045 | 0.252 | 0.025 | 0.160 | 0.032 | 0.134 | |
Notes. The outcome variable in each column is the Zero interest dummy indicating that the respondent’s interest level in any given program is zero. The first two columns cover the hypothetical rescue packages from experiment 1 (a grant for 75% of payroll expenses or a loan with 75% forgiveness if it spent on payroll. The second option is the Debt framing option in this experiment). Columns 3 and 4 cover experiment 2 (where a rescue package is labeled as a VAT refund or a VAT loan, with the second option being the Debt framing option.). Columns 5 and 6 cover experiment 3 (where a rescue package consisting of a government-guaranteed loan is presented, with half of participants seeing an explanation that the loan will be written off in the event of bankruptcy: the Debt framing option is the text without an explicit mention of the write-off). Standard errors are clustered by municipality and shown in parentheses.
*, **, and ***Significance levels at 0.1, 0.05, and 0.01, respectively.
In this analysis, we focus on the Zero interest dummy instead of the 0–10 interest measure as the outcome measure. We use the High debt aversion dummy as our measure of debt aversion. The other personality traits are mainly on a 0–10 scale with standard deviations of about 2–3 points on the scale.
The High debt aversion Debt framing interactions are significant in the first two experiments, with debt framing increasing the percentage of people reporting zero interest by 12 percentage points in the first experiment and 15 percentage points in the second. In the third experiment, the coefficient is statistically insignificant but associated with a five- to seven-percentage-point decrease in the percentage of people reporting zero interest (similar to the results above).28
No other interaction term comes close to being economically as significant (recall the standard deviation of the traits ranges from 2 to 3 points on a 10-point scale). Distrust in banks appears to be negatively associated with the difference in interest (i.e., people who distrust banks are more interested in the debt-framed options) in the first experiment (not statistically significant) and optimism seems to be negatively associated with the difference in the third (more optimistic people are more interested in debt-framed options), but outside of these, most interaction coefficients are statistically and economically indistinguishable from zero.
This suggests that if there some trait other than debt aversion that is leading to a correlation between debt aversion and the choices people make, it would need to be something beyond the traits we have tested here.
4.5. Use of Proceeds from a Grant vs. Loan
In an additional analysis conducted as part of a follow-up survey (answered by roughly 10% of our original sample), we ask firms how they would respond to hypothetical offers of either a direct grant or a loan worth one month of revenue. The responses are presented in Figure 6. Almost all firms would spend the grant on their business, with almost half of firms (45%) replying that they would invest the grant. Other common responses include covering expenses during the crisis, hiring new employees, and paying employees a bonus. However, only 20% of owners would invest if they were offered a loan, whereas most firms would actually choose to decline the loan if offered.
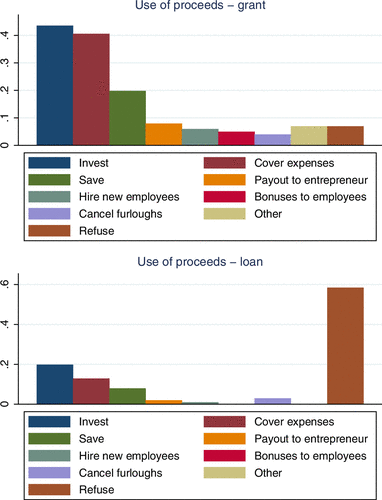
Notes. The share of respondents selecting each option for the use of proceeds from a hypothetical grant or a loan amounting to one month’s revenue. Respondents could choose multiple options.
Two possible interpretations for this result are likely. First, it may be that firms have no great investment opportunities, but when offered money for free through a grant, they are willing to use the grant toward potentially bad projects. Second, firms have viable investment opportunities, but debt aversion causes them to underinvest. Although we have no perfect way to distinguish these alternatives, our results generally suggest that debt aversion is likely to have a role in this and result in underinvestment. As discussed in Section 5.2, highly debt-averse managers are more likely to have cancelled investments and to experience high levels of stress during the pandemic, consistent with this interpretation.
5. Additional Analysis
5.1. Debt Aversion and Firm Size
What are the implications of debt aversion on firms? One plausible hypothesis is that entrepreneurs who are reluctant to take on new debt may grow more slowly. This would imply that high levels of debt aversion are associated with smaller firm size. We test this hypothesis by regressing various measures of firm size (using prepandemic financial data) on our measure of debt aversion. The results are presented in Table 7. We find that, controlling for our range of personality traits and some firm characteristics (most importantly, industry and firm age), firms run by debt-averse managers tend to have lower sales and fixed assets, suggesting that unwillingness to take on debt is a constraint on firm growth.29
|
Table 7. Debt Aversion and Firm Size
| ln(Fixed Assets 2019) | ln(Turnover 2019) | |||||||
|---|---|---|---|---|---|---|---|---|
| (1) | (2) | (3) | (4) | (5) | (6) | (7) | (8) | |
| High debt aversion | −0.541*** | −0.340* | −0.295*** | −0.079 | ||||
| (0.183) | (0.174) | (0.104) | (0.092) | |||||
| Debt aversion | −0.087*** | −0.055* | −0.050*** | −0.013 | ||||
| (0.027) | (0.033) | (0.019) | (0.016) | |||||
| Risk appetite | 0.101*** | 0.099*** | 0.059*** | 0.059*** | ||||
| (0.034) | (0.034) | (0.019) | (0.020) | |||||
| Optimism | −0.004 | −0.011 | −0.004 | −0.005 | ||||
| (0.046) | (0.046) | (0.030) | (0.030) | |||||
| Distrust people | −0.027 | −0.028 | −0.038* | −0.038* | ||||
| (0.036) | (0.036) | (0.020) | (0.020) | |||||
| Distrust banks | −0.051 | −0.047 | −0.007 | −0.006 | ||||
| (0.051) | (0.051) | (0.017) | (0.017) | |||||
| Industry fixed effects | No | Yes | No | Yes | No | Yes | No | Yes |
| Legal form fixed effects | No | Yes | No | Yes | No | Yes | No | Yes |
| Firm age fixed effects | No | Yes | No | Yes | No | Yes | No | Yes |
| Education level fixed effects | No | Yes | No | Yes | No | Yes | No | Yes |
| Education field fixed effects | No | Yes | No | Yes | No | Yes | No | Yes |
| N | 456 | 433 | 456 | 433 | 813 | 771 | 813 | 771 |
| 0.017 | 0.326 | 0.016 | 0.326 | 0.009 | 0.312 | 0.009 | 0.312 | |
Notes. The dependent variable in columns 1–4 is the natural logarithm of fixed assets in 2019 (ORBIS data), whereas the dependent variable in columns 5–8 is the log of turnover in 2019 (also from ORBIS). Standard errors are clustered by municipality and shown in parentheses.
*, **, and ***Significance levels at 0.1, 0.05, and 0.01, respectively.
We find that firms run by highly debt-averse entrepreneurs are about 29% smaller in terms of fixed assets and 7.8% smaller in terms of turnover. Risk appetite is also strongly positively associated with firm size using both measures, but other personality traits do not appear to be strongly associated with it. Of course, we cannot make any strong causal claims given the evidence is correlational, but at least this is consistent with debt aversion limiting firm growth.
5.2. Other Outcomes and Debt Aversion
In addition to looking at whether High debt aversion affects the probability of taking a loan, we test its correlation with other measures taken during the crisis. If entrepreneur debt attitudes lead to lower take-up of loans, firms may take other costly measures to deal with the liquidity shock of COVID-19. The results are shown in Table 8. We find that debt-averse entrepreneurs, although less likely to apply for loans, appear more likely to apply for direct support, in column 3 (although this is not statistically significant) and are more likely to cancel investments (column 7). In other measures, such as raising new equity, laying off or furloughing workers, or leaving wages unpaid, high debt-averse entrepreneurs’ firms do not look significantly different from other firms.
|
Table 8. Outcomes vs. High Debt Aversion
| (1) | (2) | (3) | (4) | (5) | (6) | (7) | (8) | (9) | (10) | (11) | |
|---|---|---|---|---|---|---|---|---|---|---|---|
| Bank loan | Any loan | Direct support | Equity | Layoffs | Furloughs | Canceled investments | Entrepreneur compensation | Taxes | Wages | Stress | |
| High debt aversion | −0.047* | −0.054** | 0.045 | −0.003 | −0.021 | 0.011 | 0.057** | 0.003 | −0.014 | 0.002 | 0.086*** |
| (0.025) | (0.026) | (0.030) | (0.024) | (0.017) | (0.023) | (0.024) | (0.033) | (0.021) | (0.007) | (0.022) | |
| Risk appetite | 0.010* | 0.018*** | 0.001 | 0.004 | −0.001 | −0.004 | 0.010* | 0.010 | 0.006 | 0.003 | 0.003 |
| (0.006) | (0.006) | (0.007) | (0.005) | (0.003) | (0.007) | (0.005) | (0.008) | (0.004) | (0.002) | (0.005) | |
| Optimism | −0.008 | −0.006 | 0.029*** | 0.017** | 0.007** | 0.008 | 0.001 | −0.010* | 0.004 | −0.003 | −0.020*** |
| (0.008) | (0.008) | (0.008) | (0.007) | (0.004) | (0.007) | (0.006) | (0.006) | (0.006) | (0.002) | (0.006) | |
| Distrust people | 0.005 | 0.007 | 0.006 | 0.005 | −0.003 | 0.003 | 0.003 | 0.004 | −0.003 | 0.002 | 0.004 |
| (0.005) | (0.005) | (0.005) | (0.006) | (0.003) | (0.005) | (0.005) | (0.006) | (0.005) | (0.002) | (0.006) | |
| Distrust banks | 0.005 | 0.005 | −0.003 | 0.003 | 0.003 | 0.000 | 0.010** | 0.003 | 0.005 | 0.001 | −0.003 |
| (0.004) | (0.004) | (0.006) | (0.005) | (0.003) | (0.006) | (0.004) | (0.005) | (0.005) | (0.001) | (0.006) | |
| Firm size fixed effects | Yes | Yes | Yes | Yes | Yes | Yes | Yes | Yes | Yes | Yes | Yes |
| Industry fixed effects | Yes | Yes | Yes | Yes | Yes | Yes | Yes | Yes | Yes | Yes | Yes |
| Survival fixed effects | Yes | Yes | Yes | Yes | Yes | Yes | Yes | Yes | Yes | Yes | Yes |
| Survival time fixed effects | Yes | Yes | Yes | Yes | Yes | Yes | Yes | Yes | Yes | Yes | Yes |
| Education level fixed effects | Yes | Yes | Yes | Yes | Yes | Yes | Yes | Yes | Yes | Yes | Yes |
| Education field fixed effects | Yes | Yes | Yes | Yes | Yes | Yes | Yes | Yes | Yes | Yes | Yes |
| N | 883 | 883 | 883 | 883 | 883 | 883 | 883 | 883 | 883 | 883 | 883 |
| 0.185 | 0.191 | 0.278 | 0.115 | 0.166 | 0.375 | 0.206 | 0.198 | 0.197 | 0.070 | 0.266 |
Notes. The dependent variable is shown above each column. Bank loan indicates having applied for a new bank loan, similar to our main results in Table 4. Any loan indicates having applied for any new loan. Direct support indicates having applied for direct support. Equity indicates having sought new equity. Layoffs and Furloughs indicate having laid off or furloughed employees, respectively, during the crisis. Canceled investments indicates having canceled investments. Entrepreneur compensation indicates having reduced entrepreneur compensation. Taxes and Wages indicate having left taxes or wages unpaid, respectively. Stress indicates that the entrepreneur reported that COVID-19 increased their stress levels “very much.” Standard errors are clustered by municipality and shown in parentheses.
*, **, and ***Significance levels at 0.1, 0.05, and 0.01, respectively.
We also ask whether COVID-19 increased the stress levels of entrepreneurs (giving them five choices: Not at all, slightly increased, increased, increased very much, and prefer not to answer). The Stress outcome variable in this table is coded as one if stress levels increased very much. Overall, 18% of entrepreneurs reported stress levels increasing very much during the crisis, with high debt aversion entrepreneurs being 8.6 percentage points more likely to report highly increased stress levels.
5.3. Subsample Analysis
We then focus on subsamples in Table 9. The goal of these analyses is to look at firms where the obstacles to taking new debt are lower and/or where the need for new financing is higher. We study firms where entrepreneurs had not pledged personal assets as collateral in the past, limited liability firms (for these two types of firms, new government-guaranteed debt is less likely to increase the risks faced by the entrepreneur), firms that applied for any form of financing (i.e., firms that need financing), and excluding firms that said they did not apply for debt because they did not need it (an alternative way to define a group of firms that need finance).
|
Table 9. Applied for New Bank Loan vs. Debt Aversion: Subsamples
| (1) | (2) | (3) | (4) | |
|---|---|---|---|---|
| No pledges | Limited | App. fin. | Ex. no need | |
| High debt aversion | −0.069*** | −0.045 | −0.069* | −0.064 |
| (0.021) | (0.034) | (0.039) | (0.040) | |
| Risk appetite | 0.004 | 0.011 | 0.018* | 0.026*** |
| (0.006) | (0.007) | (0.010) | (0.009) | |
| Optimism | 0.003 | −0.010 | −0.028** | −0.019* |
| (0.004) | (0.009) | (0.012) | (0.010) | |
| Distrust people | 0.007 | 0.009 | 0.008 | 0.004 |
| (0.005) | (0.007) | (0.009) | (0.008) | |
| Distrust banks | 0.000 | −0.000 | 0.004 | 0.004 |
| (0.005) | (0.005) | (0.006) | (0.007) | |
| Firm size fixed effects | Yes | Yes | Yes | Yes |
| Industry fixed effects | Yes | Yes | Yes | Yes |
| Survival fixed effects | Yes | Yes | Yes | Yes |
| Survival time fixed effects | Yes | Yes | Yes | Yes |
| Education level fixed effects | Yes | Yes | Yes | Yes |
| Education field fixed effects | Yes | Yes | Yes | Yes |
| N | 557 | 600 | 547 | 531 |
| 0.236 | 0.185 | 0.198 | 0.208 |
Notes. The dependent variable is Applied new bank loan, a dummy taking the value one if the firm reported having applied for a new bank loan during the COVID-19 crisis. Each column represents a separate subsample. No pledges includes only the firms where the management has not provided any personal guarantees for firm liabilities. Limited includes only limited companies. App. fin. includes only the firms that applied for some type of financing during the pandemic. Ex. no need excludes the firms that report not needing new financing. Standard errors are clustered by municipality and shown in parentheses.
*, **, and ***Significance levels at 0.1, 0.05, and 0.01, respectively.
The estimated effect of high debt aversion is negative and economically significant in all four subsamples and statistically significant for subsamples in columns 1 and 3. The magnitude of the coefficient is larger (about 1.5 times the baseline effect) in the no collateral pledged subsample and the two subsamples of firms that plausibly need financing. The lack of statistical significance for the subsample in column 4 does not strengthen the case for an obstacle in policy design, but the larger coefficient and the fact that the standard deviation is larger in this smaller subsample do not allow us to rule out such an obstacle in policy design either.
5.4. New Sample and Alternative Measures of Debt Aversion
To make sure that our results are not driven by unusual behavior during the COVID-19 pandemic, we repeat our analysis of the relationship between the use of debt and entrepreneur debt aversion using a new sample from the Yrittäjägallup survey conducted in April 2023 by the Federation of Finnish Enterprises. To further validate our measure of debt aversion, we also include two alternative questions related to debt aversion introduced by Albrecht and Meissner (2022): Debt integral and No excuse for debt. The first one measures the entrepreneur’s own attitudes toward debt, whereas the second one measures their expectations of others’ attitudes toward debt.
This analysis is presented in Table 10. Panel A shows the results using the same measure of debt aversion as the rest of our analysis but with the new sample. The results are similar to our main results. A higher level of debt aversion is significantly negatively associated with the likelihood of having debt.
|
Table 10. New Sample and Alternative Measures of Debt Aversion
| Panel A: Original debt aversion measure | ||||
|---|---|---|---|---|
| (1) | (2) | (3) | (4) | |
| High debt aversion | −0.228*** | −0.196*** | ||
| (0.030) | (0.029) | |||
| Debt aversion | −0.051*** | −0.044*** | ||
| (0.005) | (0.005) | |||
| Firm size fixed effects | No | Yes | No | Yes |
| Industry fixed effects | No | Yes | No | Yes |
| Organizational form fixed effects | No | Yes | No | Yes |
| N | 1,023 | 1,022 | 1,014 | 1,012 |
| 0.054 | 0.155 | 0.083 | 0.173 | |
| Panel B: Alternative debt aversion measures | ||||||
|---|---|---|---|---|---|---|
| (1) | (2) | (3) | (4) | (5) | (6) | |
| Debt integral | −0.095*** | −0.085*** | −0.083*** | |||
| (0.011) | (0.011) | (0.012) | ||||
| No excuse for debt | 0.026** | 0.026** | 0.011 | |||
| (0.011) | (0.011) | (0.011) | ||||
| −6.394*** | ||||||
| (1.251) | ||||||
| Firm size fixed effects | No | Yes | No | Yes | Yes | Yes |
| Industry fixed effects | No | Yes | No | Yes | Yes | Yes |
| Organizational form fixed effects | No | Yes | No | Yes | Yes | Yes |
| N | 1,008 | 1,007 | 929 | 928 | 921 | 921 |
| 0.056 | 0.163 | 0.006 | 0.121 | 0.162 | 0.140 | |
Notes. This table presents regression results using a new sample from the Federation of Finnish Enterprises survey in 2023 (Yrittäjägallup). The dependent variable is Has debt, a dummy taking the value one if the firm reported having debt. Panel A shows the results using the same debt aversion measure as our other analyses. Panel B shows the same results using two alternative questions related to debt aversion as well as a new measure of debt aversion, introduced by Albrecht and Meissner (2022). Debt integral is the level of agreement (1–6) with the statement Please rate the following statement (1: strongly agree to 6: strongly disagree): “Debt is an integral part of today’s life.” No excuse for debt is the response (1–6) to the question What do you think, how does the average participant in this survey/experiment rate the following statement (1: strongly agree to 6: strongly disagree): “There is no excuse for borrowing money.” is the predicted debt aversion parameter proposed by Albrecht and Meissner (2022), calculated as . Robust standard errors are shown in parentheses.
*, **, and ***Significance levels at 0.1, 0.05, and 0.01, respectively.
Panel B shows the same results, but using the two alternative debt aversion measures by Albrecht and Meissner (2022), as well as the predicted debt aversion parameter () calculated from these two variables. These measures yield similar results as our main measure, with higher levels of debt aversion associated with a significantly lower likelihood of having debt.
5.5. Further Analyses and Robustness Checks
In the Online Appendix, we perform a number of additional analyses and robustness checks. These are briefly summarized in this section and include the following.
International evidence. In the Online Appendix, Section A.1, we provide international evidence of debt aversion, use of debt, and the relationship between the two. These analyses use data from the Eurobarometer, European Central Bank’s Survey on Access to Finance of Enterprises survey, and World Bank Enterprise Surveys. Generally, Finland does not appear particularly different from other European countries when it comes to attitudes toward debt or the use of debt by SMEs. We also show that country-level proxies for debt aversion (however imperfect) seem to be associated with use of debt by firms. This suggests that there is no reason to assume that our findings would be unique to the Finnish context.
Stability of debt aversion over time. In the Online Appendix, Section A.2.1, we show the distribution of Debt aversion in a new 2023 survey against the distribution in our main survey conducted during the pandemic in 2020. The shape of the distribution is very similar in these two surveys, suggesting that distribution of debt aversion is stable over time and does not look different during the obviously unusual COVID-19 period.
Correlation of debt aversion measures. In the Online Appendix, Section A.2.2, we show binned scatterplots presenting the correlations between our main measure of debt aversion, as well as the two alternative measures by Albrecht and Meissner (2022), used in Table 10. Debt aversion (our main measure) exhibits a monotonic positively relationship with Debt integral. It is also correlated with No excuse for debt, but this correlation is not as strong as for Debt integral. The latter observation is similar to when plotting the two measures by Albrecht and Meissner (2022) against each other, with a near-monotonic but not very strong relationship between the two debt aversion measures.
Additional descriptive charts. In the Online Appendix, Section A.3, we present additional summary charts from our main survey. These include the distribution of firms by number of employees, firm actions during the pandemic, entrepreneurs’ expectations on firm survival, COVID-19 impact on firm sales, financing options applied for, and reasons for not applying for new debt.
Results including nonentrepreneurs. In our main analysis, we exclude respondents that are not entrepreneurs (i.e., owner-managers). In the Online Appendix, Section A.4, we replicate our main analysis, but include all respondents, including hired managers (CEOs, CFOs, and other) that are not owners of the firm. The results are robust to including these respondents. Given the limited number of hired managers in the data, we cannot perform a comparison between them and owner-managers.
Different thresholds for high debt aversion. In the Online Appendix, Section A.5.1, we repeat our baseline regression analysis for various different thresholds for defining the High debt aversion dummy variable. The results remain similar regardless of the definition.
Negative binomial regressions for experiments. In the Online Appendix, Section A.5.2, we repeat the regression analysis of our experiments (reported in five in the main text), using negative binomial regressions instead of ordinary least squares (OLS) regressions. The results remain similar to our OLS regression results.
New bank loans and debt aversion by sector. The likelihood of applying for new loans during COVID-19 might depend on the firm’s sector. Hence, in the Online Appendix, Section A.6, we repeat the analysis including interaction terms between high debt aversion and sector of the firm. Debt aversion appears to matter fairly uniformly across different sectors, although the effect seems weaker in transport and storage than in other main sectors.
6. Conclusion
Our results support the idea that entrepreneur attitudes toward debt affect the use of debt within the firms they manage. This has implications for government policy, which aimed to support the economy during the COVID-19 pandemic by providing liquidity to firms facing revenue shortfalls. Although the use of debt-based packages has many advantages (it is less costly for governments, they help screen out bad firms, etc.), we document that widely held entrepreneurial attitudes may hinder the effectiveness of these policies.
The statistical significance of our results varies, but the economic magnitudes are consistent within analyses and our various analyses all support the same conclusion. Cross-sectional analysis and natural experiment-style analysis around the COVID-19 pandemic and experimental results all suggest that debt-averse entrepreneurs are less likely to use debt within their firm. We show that firms run by debt-averse entrepreneurs have less debt in general, are less likely to use debt-based COVID-19 rescue packages, and, in an experimental setting, prefer policies framed as grants. Our results also suggest that debt-averse entrepreneurs are more likely to cancel investments during the pandemic.
Our findings have important policy implications. SME support programs may struggle to have an impact if they are structured as debt instead of other forms of support. Our experimental analyses suggest that simply framing support policies in nondebt terms may to some extent help increase their effectiveness.
The authors thank Camelia Kuhnen (editor), two anonymous referees, Martin Brown, Brighton Chotiputsilp, Vicente Cuñat, Julian Franks, Juanita Gonzalez-Uribe, Tobin Hanspal, Alex He, Matti Keloharju, Nazirul Khalim, Christine Laudenbach, Diogo Mendes, Daniel Metzger, Marcelo Ortiz, Miguel Palacios, Kim Peijnenburg, Vesa Puttonen, Asad Rauf, David Robinson, Christoph Schneider, Srinivasan Selvam, Raj Sharma, Oliver Spalt, Andre van Hoorn, Alexander Wagner, Ern Hui Wee, and Ziwei Zhao, as well as conference participants at the 2023 China International Conference on Finance, 2023 CIRET/EK/Statistics Finland/Bank of Finland/KOF Workshop on surveys for economic development in difficult times, 2022 Financial Management Association Asia-Pacific Conference, the 2022 Endless Summer Conference on Financial Intermediation and Corporate Finance, the 2022 Midwest Finance Association Conference, the 2022 Barcelona School of Economics Summer Forum, the 2022 Research in Behavioral Finance Conference, the 2022 Corporate Finance Day, the 2021 Paris December Finance Meeting, the 2021 HEC Entrepreneurship Workshop, the 2021 conference on Behavioral Finance, Governance and Accounting, the 2020 Conference on the Theories and Practices of Securities and Financial Markets, and the 2021 Annual Meeting of the German Finance Association, and seminar participants at the Rotterdam School of Management, University of St. Gallen, and the Benelux Corporate Finance Network for helpful comments; Taavi-Okko Tasanko for excellent research assistance; and the Federation of Finnish Enterprises for help in administering our survey, as well as for allowing us to add questions to their own Yrittäjägallup-survey conducted in April 2023. S. Torstila thanks University of California Berkeley, Haas School of Business, where part of this work was completed.
1 Quotes from Emerson (1871, p. 39), Raleigh (1632, p. 61), and Shakespeare (1623, p. 156), respectively.
2 See The Economist (2015).
3 Our sample consists of owner-managers of Finnish SMEs, which may include second-generation owner-managers. We refer to all owner-managers in our sample as entrepreneurs for conciseness.
4 A natural worry is whether Finnish respondents are internationally representative. Perhaps they are more debt averse? Although there is suggestive evidence that entrepreneurs in many developed economies may be debt averse (for instance, very low application rates for COVID-19 support loans across Europe), we also show direct evidence suggesting the levels of debt aversion in our sample are comparable or lower than those of respondents of the U.S. Survey of Consumer Expectations (SCE). The SCE included as a one-time question items related to debt aversion (Hundtofte 2018). When asked “What were you taught as a child about debt?,” 52% of SCE respondents agreed with the nonexclusive option “Something to be avoided,” 29% with “A necessary evil,” and only 9% with “A useful way to shift money from periods when you have it to periods when you do not.” We ask our respondents the same questions and obtain 25%, 10%, and 8%, respectively. This suggests that our respondents are less debt averse than U.S. SCE respondents, which is possibly because our respondents are entrepreneurs.
5 We present results including non–owner-managers, such as hired CEOs or CFOs, in the Online Appendix.
6 We run all our analyses using both the 0–10 score and the dummy.
7 The measure is based on subjective self-reported risk aversion because we had limited space in the survey. Dohmen et al. (2011) find that self-reported risk appetite is correlated with choices in experimental lotteries and real-world behavior.
8 Similar methods have been used in other contexts. Caetano et al. (2019) use labeling and framing experiments to study the effect of debt aversion norms on student loan take-up, and Bursztyn et al. (2018) find that labeling credit cards as “Platinum” credit cards increases take-up compared with unlabeled ones offering identical benefits, showing that people value the status that comes with a credit card. There has also been experimental work showing the impact of changing these social norms, such as (for example) Bursztyn et al. (2020b), who show that Saudi Arabian men underestimate social support for women working outside the home and that revealing the true level of support leads to more women applying for jobs outside the home.
9 Most firms in our sample expect the impact of the virus to be temporary: More than half of the firms expect revenue to recover to pre-COVID levels within six months of our survey (conducted at the end of May), in line with Landier and Thesmar (2020), who show that analysts expect the impact of the virus to be temporary for U.S. public firms.
10 Another potential concern might be that applying for debt during the crisis lowered debt aversion, causing us to observe an ex post relationship between debt aversion and use of debt even if one did not exist at the time of applying.
11 In this case, the loan actually objectively dominates the grant option, as we do not specify, unlike the Paycheck Protection Program, that the loan amount is restricted by the amount of personnel expenses. In principle, in our wording, the forgiven loan amount could be larger than the direct grant. Despite this, the respondents are more interested in the grant.
12 An obvious question that may arise is whether slower growth is also bad for the entrepreneur: For example, are these firms less profitable? Unfortunately, the specificities of the Finnish tax code make this analysis difficult to conduct. Entrepreneurs face a choice between taking a dividend from the firm or paying themselves a salary. The fact that for many entrepreneurs a salary is more tax efficient than a dividend means that profitability figures may be uninformative about the prospects of a company for many firms in our sample.
13 Although we can control for a range of firm and manager characteristics, we want to stress that there may still be unobserved differences between firms run by highly debt averse and other managers and hence we cannot make a causal claim linking firm growth and debt aversion.
14 Excluding certain essential traffic.
15 In related work, Paaso et al. (2020) use more detailed descriptive data obtained from the same survey, such as data on regional and industry differences in levels of COVID-19–related financial distress, to provide timely support for domestic policymakers during the crisis. The analysis in this article does not overlap with the analysis in the descriptive article.
16 We had 1,009 responses, but one firm responded twice.
17 We present results using the full sample of firms in the Online Appendix.
18 This is considerably lower than Robb and Robinson (2014), whose sample only includes newly created firms in the United States, and in line with Fuhrer et al. (2021), who show that about 40% of all Swiss firms have debt outstanding.
19 For example, it could be that entrepreneurs of failed firms are not interested in answering surveys or entrepreneurs with struggling firms might not have the time to do so.
20 Such direct support was indeed decided on after the survey had been concluded, later in June.
21 We randomized the order of the debt and grant questions and did not allow respondents to move back in the survey.
22 In the Online Appendix, we show that our main results are not sensitive to the definition of High debt aversion.
23 The possible (nonexclusive) answers are “Should be used in moderation,” “A promise to be kept,” “Should be avoided,” “A necessary evil,” “Useful to split large purchases,” and “Useful to transfer money over time.”
24 We cluster standard errors by municipality. In the Online Appendix, we show that these results are robust to different levels of clustering.
25 To reduce the impact of outliers, we winsorize these variables at the 5% level at both tails.
26 In the Online Appendix, we also show these results by sector.
27 In case the firm does not need or want the 25% of the loan that is not forgiven, it could always keep (or invest) the cash and use it later to pay back the loan. Hence, it should not matter very much whether or not the firm is liquidity constrained.
28 Debt framing in this table is equivalent to No write-off in the previous table. That is, the debt-framed option refers to the option without a mention of the write-off of debt in bankruptcy.
29 We control for firm age by including a fixed effect for each year of age.
References
- (2022) The debt aversion survey module: An experimentally validated tool to measure individual debt aversion. Maastricht University Working paper, Maastricht, Netherlands.Google Scholar
- (2014) Hidden costs of hidden debt. Rev. Finance 18(6):2247–2281. Crossref, Google Scholar
- (2021) Attitudes towards debt and debt behavior. Scandinavian J. Econom. 123(3):780–809.Crossref, Google Scholar
- (2020) No firm is an island? How industry conditions shape firms’ expectations. J. Monetary Econom. 125(C):40–56.Google Scholar
- (2015) Firm optimism and pessimism. Eur. Econom. Rev. 79(C):297–325.Crossref, Google Scholar
- (2020) COVID-19 is also a reallocation shock. NBER Working Paper No. 27137, National Bureau of Economic Research, Cambridge, MA.Google Scholar
- (2020) The impact of COVID-19 on small business outcomes and expectations. Proc. Natl Acad. Sci. USA 117(30):17656–17666.Crossref, Google Scholar
- (2023) Managers’ cultural origin and corporate response to an economic shock. J. Corporate Finance 80(C):102412.Crossref, Google Scholar
- (2020) Did targeting financial constraints during COVID-19 make sense? Chicago Booth School of Business Research paper, Chicago, IL.Google Scholar
- (2020b) Misperceived social norms: Women working outside the home in Saudi Arabia. Amer. Econom. Rev. 110(10):2997–3029.Crossref, Google Scholar
- (2018) Status goods: Experimental evidence from platinum credit cards. Quart. J. Econom. 133(3):1561–1595.Crossref, Google Scholar
- (2020a) Political identity: Experimental evidence on anti-Americanism in Pakistan. J. Eur. Econom. Assoc. 18(6):2532–2560.Crossref, Google Scholar
- (2019) Measuring aversion to debt: An experiment among student loan candidates. J. Family Econom. Issues 40(1):117–131.Crossref, Google Scholar
- (2018) How do firms form their expectations? New survey evidence. Amer. Econom. Rev. 108(9):2671–2713.Crossref, Google Scholar
- (2024) Information technology and credit: evidence from public guarantees. Manage Sci. 70(9):6202–6219.Google Scholar
- (2017) Shaped by their daughters: Executives, female socialization, and corporate social responsibility. J. Financial Econom. 126(3):543–562.Crossref, Google Scholar
- (2012) Behavioral consistency in corporate finance: CEO personal and corporate leverage. J. Financial Econom. 103(1):20–40.Crossref, Google Scholar
- (2021) Information frictions and firm take up of government support: A randomised controlled experiment. Imperial College London Working paper, London.Google Scholar
- (2023) Trust and contracts: Empirical evidence. Georgetown University Working paper, Washington, DC.Google Scholar
- (2020) Human frictions in the transmission of economic policy. University of Chicago, Becker Friedman Institute for Economics Working Paper No. 2019-07. Chicago, IL.Google Scholar
- (2023) IQ, expectations and choice. Rev. Econ. Stud. 90(5): 2292–2325.Google Scholar
- (2011) Individual risk attitudes: Measurement, determinants, and behavioral consequences. J. Eur. Econom. Assoc. 9(3):522–550.Crossref, Google Scholar
- (2018) Zero-leverage puzzle: An international comparison. Rev. Finance 22(3):1063–1120.Crossref, Google Scholar
- (1871) The Conduct of Life (James R. Osgood and Company, Boston).Google Scholar
- (2009) Educational debt burden and career choice: Evidence from a financial aid experiment at NYU Law School. Amer. Econom. J. Appl. Econom. 1(1):1–21.Crossref, Google Scholar
- (2021) Firms’ participation in the Swiss COVID-19 loan programme. Swiss J. Econom. Statist. 157(2):1–22.Google Scholar
- (2000) How big are the tax benefits of debt? J. Finance 55(5):1901–1942.Crossref, Google Scholar
- (2013) Managerial attitudes and corporate actions. J. Financial Econom. 109(1):103–121.Crossref, Google Scholar
- (2020) Behavioral corporate finance: The life cycle of a CEO career. NBER Working Paper No. w27635, National Bureau of Economic Research, Cambridge, MA.Google Scholar
- (2008) Trusting the stock market. J. Finance 63(6):2557–2600.Crossref, Google Scholar
- (2013) The determinants of attitudes toward strategic default on mortgages. J. Finance 68(4):1473–1515.Crossref, Google Scholar
- (2017) Incompatible European partners? Cultural predispositions and household financial behavior. Management Sci. 63(11):3780–3808.Link, Google Scholar
- (2020) The evolving impacts of COVID-19 on small businesses since the CARES Act. Cowles Foundation Discussion Paper No. 2230, NYU Stern School of Business, New York.Google Scholar
- (2018) Credit aversion. Better.com Working paper, New York.Google Scholar
- (2004) Liquidity constraints, household wealth, and entrepreneurship. J. Political Econom. 112(2):319–347.Crossref, Google Scholar
- (2017) CEO power and matching leverage preferences. J. Corporate Finance 45(C):19–30.Crossref, Google Scholar
- (2010) The net benefits to leverage. J. Finance 65(6):2137–2170.Crossref, Google Scholar
- (2021) New survey evidence on COVID-19 and Irish SMEs: Measuring the impact and policy response. Central Bank of Ireland Research Technical paper, Dublin, Ireland.Google Scholar
- (2020) The government offers companies value-added taxes back as a loan: How would that ease the plight of businesses. Helsingin Sanomat, Finland.Google Scholar
- (2020) Earnings expectations in the COVID crisis. Rev. Asset Pricing Stud. 10(4):598–626.Google Scholar
- (2018) Economics and finance. Bernheim BD, DellaVigna S, Laibson D, eds. Handbook of Behavioral Economics: Foundations and Applications, vol. 1 (Elsevier, Amsterdam), 277–379. Google Scholar
- (2016) Intertemporal consumption and debt aversion: An experimental study. Experiment. Econom. 19(2):281–298.Crossref, Google Scholar
- (2022) Debt aversion: Theory and measurement. Maastricht University Working paper, Maastricht, Netherlands.Google Scholar
- (2020) Debt aversion, education, and credit self-rationing in SMEs. Small Bus. Econom. 57(3):1125–1143.Google Scholar
- (2020) Business outlook and financing alternatives of Finnish entrepreneurs during the COVID-19 crisis. Nordic J. Bus. 70(1):59–77.Google Scholar
- (1998) The red and the black: Mental accounting of savings and debt. Marketing Sci. 17(1):4–28.Link, Google Scholar
- (2013) The economic psychology of entrepreneurship and family business. J. Econom. Management Strategy 22(2):423–444.Crossref, Google Scholar
- (1632) Sir Walter Raleigh’s Instructions to His Son, and to Posterity (Benjamin Fisher, London).Google Scholar
- (2014) The capital structure decisions of new firms. Rev. Financial Stud. 27(1):153–179.Crossref, Google Scholar
- (1623) Mr. William Shakespeare’s Comedies, Histories and Tragedies, Published According to the True Original Copies (First Folio) (Edward Bloun and Isaac Jaggard, London).Google Scholar
- (2013) The mystery of zero-leverage firms. J. Financial Econom. 109(1):1–23.Crossref, Google Scholar
The Economist (2015) As we forgive our debtors. The Economist (July 16), https://www.economist.com/erasmus/2015/07/16/as-we-forgive-our-debtors.Google ScholarThe Economist (2020) Politicians in America and Europe scramble to help small firms. The Economist (May 2), https://www.economist.com/finance-and-economics/2020/05/02/politicians-in-america-and-europe-scramble-to-help-small-firms.Google Scholar- (2022) The subjective inflation expectations of households and firms: Measurement, determinants, and implications. J. Econ. Perspect. 36(3):157–184.Google Scholar
- (2009) Debit or credit? J. Banking Finance 33(2):358–366.Crossref, Google Scholar