Human Performance at Solving 0-1 Knapsack Problems: Results from a Large-Scale Field Experiment
Abstract
The 0-1 knapsack problem is a fundamental problem of discrete choice that permeates many diverse fields and applications, but relatively little is known about what instances human solvers find more difficult than others. This paper reports the results of the first large-scale randomized controlled field experiment investigating this question, conducted in partnership with a global mobile gaming platform. A total of 100,000 different knapsack instances were predesigned for this study and randomly assigned to each player attempt at the knapsack problem. For our base-case analysis, there were 17,950,838 distinct player accounts who made a total of 150,284,195 submitted solution attempts. Contrary to expectations, players performed better on problems that were rated as more difficult by two traditional measures of knapsack difficulty (the Pearson correlation between value and weight vectors and Sahni complexity), but performed worse on problem instances that featured large optimality gaps from a suite of heuristic solution algorithms. These suggest that optimality gaps can serve as promising measures of human-perceived knapsack difficulty and potentially could be used to measure human-perceived problem difficulty for other types of discrete choice problems. We found evidence that players improved their performance with repeated attempts at the knapsack task overall, but less-experienced players of the mobile game improved more quickly than more-experienced players. Through the construction of a new measure of human-perceived difficulty rating for each knapsack instance, we found evidence that players who were assigned to instances with a higher difficulty rating in the past tended to perform better on future attempts.
This paper was accepted by Manel Baucells, behavioral economics and decision analysis.
Funding: S. Agarwal’s research is supported by the Ministry of Education, Singapore, under its Social Science and Humanities Research Thematic [Grant SSRC2024-SSHRTG-022] and the National Natural Science Foundation of China [Grant 72495154]. J. Goh’s research is supported by a Startup [Grant R-314-000-110-133] and a 2021 Humanities and Social Sciences Faculty Research Fellowship from the National University of Singapore.
Supplemental Material: The online appendix and data files are available at https://doi.org/10.1287/mnsc.2023.00747.
1. Introduction
Choices are an inescapable part of the fabric of human life. Even in the pursuit of economic activity, where the role of algorithmic decision-making has become increasingly ubiquitous, humans are still key to decision-making and problem-solving. The very fact that you, our reader, are engaging with this paper in front of you right now, instead of countless other worthwhile activities, is a consequence of a human choice embedded within the economic activity of research and scholarship.
This paper focuses on a specific choice problem called the 0-1 knapsack optimization problem (henceforth, the knapsack problem for brevity), a classic problem of discrete choice. Informally, this problem involves choosing a subset of items (from some set) with the largest total value but with total weight less than some given constant. Formally, suppose that we are given a set of unique items, a knapsack capacity , a value vector and weight vector , both having strictly positive components. Then, the knapsack problem can be written as the following optimization problem:
Much is known about the theoretical properties of problem (1), including the factors that render the problem easier or more difficult for mechanistic solution algorithms. We review these in Section 2. Nonetheless, the large body of work about the knapsack problem’s computational properties do not necessarily map neatly to the primary question of this study: What features of the knapsack problem cause humans to perform better or worse on it?
Attention to this question is important because there are a variety of operational contexts where humans are the decision agents who have to encounter and resolve problems with knapsack-like tradeoffs. One example is in the logistics industry where people are typically the ones who decide how to pack items into shipping boxes, or how to arrange packages within a shipping container. Such bin-packing problems are generalizations of the knapsack problem with a similar (albeit, more complicated) tradeoff of how to choose an optimal assortment of items to fit within the limited physical dimensions of a given container. A second example is in project management, where a typical decision by a manager, who is constrained by a budget (K) has to choose a subset of resources (x) to dedicate to a project (with a total cost of ) to maximize total project value (). As a third example, consider an administrator who is tasked with scheduling appointments for a professional service delivered by a firm. Within a given window of time, the firm’s service capacity is limited (e.g., typically constrained by its labor supply), and the administrator would have to decide which customers/cases to take on in that period (i.e., they choose x) that would deliver the greatest net value to the firm (i.e., ), while ensuring that the total workload does not exceed the firm’s service capacity (i.e., ). A final example can be found in the context of healthcare operations. Healthcare providers, through their delivery of care, could have to choose some portfolio of therapeutic actions from a larger set of available treatments for their patients. In this example, , the “value” of treatment option i, can be interpreted as the expected health benefit of that treatment and , its “weight,” could represent its corresponding negative side-effect. Providers would then be aiming to maximize the net health benefit of the treatments while controlling their net side-effects below some tolerance level K.
We recognize that the knapsack problem as modeled in (1) is highly simplified and does not capture many complexities inherent in these actual problems. For instance, it does not capture uncertainties in the weight or value vectors, potential substitutions and complementarities among combinations of choices, or any sequential elements of decision-making, which can be salient issues in many real operational problems, and indeed, even in the examples discussed above. Nevertheless, despite its stylized nature, the knapsack problem remains an important object of study. It is one of the fundamental problems in integer programming, and beneath its mathematical formalism lies a tradeoff that appears in a striking variety of applications: How should a decision-maker choose an optimal assortment under a budget constraint? It is this same central tradeoff that is common across the operational examples described above.
The secondary goal of this study was to understand how people learn from repeated exposure to different knapsack instances. We were keen to understand whether people got better at solving the knapsack problem over time (i.e., does training work?), and whether the nature of knapsack instances that a player was exposed to in the past would have any bearing on their performance in the future (i.e., are there better and worse ways of training?). Specifically, motivated by evidence from psychology that “desirable difficulties” when learning can lead to long-run improved performance (see, e.g., Bjork and Bjork 2020), we aimed to understand how participants’ future performance was affected by the average difficulty of knapsack problems that they faced in the past.
To our knowledge, there have been few empirical investigations of behavioral knapsack problems. Only a few studies that have investigated the subject of human-perceived knapsack difficulty, all of which have been conducted in controlled laboratory settings (Meloso et al. 2009, Murawski and Bossaerts 2016, Franco et al. 2021). Our present work extends this line of investigation through an experiment conducted in a field setting, by using a substantially larger number knapsack instances and participants, the latter of which come from a wide range of geographies around the globe. We compare our approach with these laboratory studies in Section 2.2. In summary, we view the main contributions of this study as follows:
1) First Behavioral Knapsack Field Experiment. This work represents the first field-based randomized controlled experiment to investigate drivers of human performance on the knapsack problem. Moreover, this field experiment, with more than 150 million problem attempts made by over 17 million participants across the globe, was conducted on a substantially larger scale compared with the previous laboratory studies investigating similar knapsack problems (Meloso et al. 2009, Hidalgo-Herrero et al. 2013, Murawski and Bossaerts 2016, Franco et al. 2021).
2) Mobile Games for Field Experimentation. The large scale and scope of this field experiment was made possible due to our collaboration with a popular mobile game platform. To our knowledge, this is the largest controlled field experiment of human choice behavior that has been conducted to date. Our study demonstrates that mobile game platforms are viable means of conducting large-scale field experiments to understand human choice behavior.
3) Optimality Gaps as Measures of Human-Perceived Problem Difficulty. The results of our experiment uncovered new insights that were not present in previous laboratory studies. Specifically, we found that larger optimality gaps from a variety of solution heuristics consistently engendered higher levels of human-perceived knapsack problem difficulty. This finding was robust to different model specifications and data sample constructions.
4) Evidence of Longitudinal Learning in the Knapsack Task. Our study demonstrated that players tended to improve in their solutions as they solved more knapsack problems. Interestingly, we also found that learning was heterogeneous along two important dimensions: First, players who faced more “difficult” instances in the past tended to perform better in the future. Second, players who were more experienced in the mobile game (e.g., had played it longer, were more active on the platform) tended to have better initial performance at the knapsack task, but their performance improved more slowly in subsequent attempts compared with less-experienced players.
The structure of this paper is as follows. In Section 2, we discuss existing literature that is related to our present study. Section 3, which follows, describes the methods used in this study, including the overall study design and context, how the knapsack instances were generated, our empirical approach, and the suite of sensitivity analyses we conducted to investigate the robustness of our findings. Results of our analysis are reported in Section 4, and we conclude with a discussion of the implications of our results in Section 5. Supplemental methods, figures, and tables are provided in the Electronic Companion.
2. Related Literature
Our present study relates to two broad streams of research: (a) complexity analysis of the knapsack problem and (b) experimental studies of human decision-making on optimization problems, and, in particular, knapsack tasks.
2.1. Complexity Analysis of the Knapsack Problem
There is a well-established literature that investigates drivers of complexity of the knapsack problem from a computational perspective. For instance, a textbook result is that the knapsack problem is known to be NP-hard but a dynamic programming algorithm can solve it to optimality with time, and thus it admits a pseudo-polynomial time solution (Kellerer et al. 2004). Thus, the scaling properties of the knapsack problem are well-established. Computational experiments conducted by numerous studies have also revealed that even with fixed values of N and K, certain instances of knapsack problems create difficulties for computerized algorithms to solve. For instance, Chvátal (1980) assumed that the weight and value vectors were identical and developed a set of four conditions on the components of this vector such that all recursive algorithms would perform poorly. Indeed, computational experiments by a number of different studies have consistently shown that problem instances in which weight and value vectors have strong correlations tend to be those that pose the most difficulties for different knapsack solution algorithms (Martello and Toth 1988, 1997; Pisinger 1999, 2005; Smith-Miles et al. 2021); a notable exception was Balas and Zemel (1980) who reported that for their proposed algorithm, which exploits a linear programming (LP) relaxation of the knapsack problem, a key driver of difficulty instead was the optimality gap between the relaxed and exact problems.
Our present study is a field experiment investigating human solvers of the knapsack problem and its design is informed by this body of work. Specifically, the main independent variables that we used (which we call “instance-level complexity measures,” see Section 3.4) was directly drawn from this literature.
2.2. Experimental Studies of Human Decision-Making on Optimization Problems
Our present study falls within the literature studying how human solvers behave on optimization tasks. This is an expansive body of work encompassing many different classes of optimization problems, including combinatorial optimization problems such as the traveling salesman problem (e.g., MacGregor and Ormerod 1996), optimal stopping problems such as the secretary problem (e.g., Seale and Rapoport 1997), and problems involving dynamic learning and optimization such as the multiarmed bandit problem (e.g., Banks et al. 1997). Studies of the “experimental newsvendor,” comprise an important stream within this literature (see, e.g., Schweitzer and Cachon 2000, Rudi and Drake 2014, Lee and Siemsen 2017) for operations management. Broadly, these studies use the newsvendor model from inventory management as an experimental device, and seek to understand a fundamental tradeoff that appears in innumerable contexts and settings, namely, How should a decision-maker choose an optimal quantity under demand uncertainty? Our present study is thematically similar to the experimental newsvendor studies in the sense that we also seek to understand how humans make decisions when confronted with a core tradeoff: namely, how to choose an optimal assortment of items under a budget constraint.
Closer to our work are experimental studies that focus specifically on how humans perform on the knapsack problem. Meloso et al. (2009) interpreted the knapsack problem as a representation of the process of intellectual discovery, and assessed how human subjects performed on eight instances of the knapsack problem under different reward structures in a controlled laboratory setting. They showed a market-based reward structure outperformed a prize-based reward structure at incentivizing subjects to find optimal solutions. More germane to this present work are the recent studies by Hidalgo-Herrero et al. (2013), Murawski and Bossaerts (2016), and Franco et al. (2021), who conducted behavioral laboratory experiments to understand the factors that result in knapsack problems that are more difficult for human subjects to solve. Hidalgo-Herrero et al. (2013) experimentally compared the different decision heuristics employed by eleven year-old children and college-age students (with different levels of exposure to computer science) when they were tasked to solve four different knapsack problem instances. Murawski and Bossaerts (2016) found that subjects failed to find optimal solutions more frequently for knapsack problems with larger number of items and a higher complexity score, which they term the Sahni-k score. The study by Franco et al. (2021) investigated both the optimization form of the knapsack problem described here as well as a decision variant of the problem. They introduced two measures, termed the typical-case complexity and instance complexity and found that subjects’ performance tended to decline when these measures were higher. Other related behavioral laboratory studies on the knapsack problem have tackled the question from a different angle by investigating different types of decision heuristics and biases that participants employ to solve these problems (Schiffels et al. 2018, Pape et al. 2022).
The experimental work on human-experienced knapsack difficulty has thus far been conducted in controlled, behavioral laboratory settings. Across the studies cited above, participant sizes ranged from 20 to slightly over 200 participants, and each employed fewer than 20 knapsack instances. Building on the growing consensus about the complementarity of field and laboratory experiments in behavioral research (Harrison and List 2004), our study extends the investigation of this question to the relatively less-controlled environment of the field for the first time. Although our setting limits the depth to which we can identify precise behavioral mechanisms in participants, and imposes specific design constraints (discussed in detail in Section 3.3), it confers strengths three other dimensions: First, participants in our setting operate in a comparatively natural environment; the increased realism of our setting increases the likelihood that our findings are translatable to practice. Second, we substantially expand the number of unique knapsack instances tested, using a total of 100,000 unique knapsack instances in this study. Doing so means that we sample the space of instances much more finely compared with previous studies, and this can confer greater confidence that any causal relationships found from our analysis hold true over the broader instance space, as opposed to relationships that might only hold on a lower-dimensional manifold of the space. Finally, we greatly expand the both the size and nature of the study population, where our knapsack submissions come from over 17 million player accounts spread across several regions of the world. The larger population and global nature of the participant pool increase the likelihood that potential findings from this study are generalizable beyond any specific populations or geographies.
These differences imply that the findings and insights generated from our analyses can potentially differ from those found thus far in the literature. For instance, our primary analysis revealed the new insight that optimality gaps are good measures of human-experienced problem difficulty, and from our analysis of learning behaviors found that subjects tended to perform better in the future when they were exposed to “harder” problems in the past (see Section 4 for details).
3. Methods
3.1. Study Context and Description of Primary Game
This study was conducted in collaboration with the publisher of a mobile game. The mobile game (henceforth, called the primary game) has a large global player base, which formed the study population for this investigation. Players of the primary game were distributed across five distinct and independently operating server regions, spanning the Americas and Asia. These regions have been de-identified and coded as regions A, B, C, D, and E.
Although a thorough understanding of the mechanics of the primary game is not essential to the knapsack experiment in this study, we briefly describe the primary game to provide some additional context for this study as a whole, and in particular, for the independent variables used as controls (see Section 3.4, “player statistics in the main game”). The primary game is a multiplayer first-person shooter where players participate in a series of “battle royale” matches. In each such match, each player controls a digital avatar that engages in simulated virtual combat with up to 150 other player opponents using assorted weaponry over a gradually shrinking map. Players are eliminated from a match when they have taken a certain amount of damage; the “last player standing” wins the match. When players are not engaging in matches, they can choose and customize their avatars. Some of these choices and customizations require the use of in-game premium currency, which is primarily acquired through purchase with real-world currency. Players can also belong to in-game social groups called “clans,” which allow players to earn extra in-game rewards.
There are two mechanisms by which players skill levels are rated, each serving a different purpose. The first is a player’s “rank.” This information is communicated to the player and takes on discrete levels. Players earn in-game rewards by progression up these ranks. Players also have the option of displaying their rank on their in-game profile page for other players to view. The second is an internal mechanism that is called a “match-making rating” (MMR) score. This information is not communicated to players and is used by an algorithm to assign players (i.e., with similar MMR scores) to matches for gameplay. Player rank and MMR scores change with player performance during their matches. Factors taken into account in determining how these rating scores change for a given player in a given match include: the number of opponents remaining when this player was eliminated from that match, the length of time until elimination, the number of opponents that this player eliminated during the match, and the damage inflicted on opponents during the match.
As is typical of many mobile games, the game publisher periodically releases limited time special events to engage their playerbase. These events often take the form of minigames or puzzles that are separate from the primary game. Players who participate in these events would typically be able to gain bonuses or other rewards to their primary gameplay.
3.2. Overview of Knapsack Minigame
The present field experiment, the “knapsack minigame,” was embedded into one such limited time event, which ran from September 29, 2021 to October 17, 2021 (with the exact starting and ending dates varying slightly by server regions). The minigame was designed in collaboration with our industry partners with a contextual setting and visual elements that were familiar to players of the primary game. During the event, players were able to earn tokens to participate in the minigame by completing simple tasks in the primary game (tasks were as simple as logging into the game, or playing a match of the main game). By design, each player could earn at most three participation tokens per day, giving them at most three attempts at the knapsack minigame per day; unused tokens could not be carried over to the following day. When players entered the knapsack minigame, they would be randomly assigned one of 100,000 predesigned instances of the knapsack problem to solve.
Figure 1 illustrates a schematic of the minigame’s user interface. Because our goal in this experiment was to understand how different knapsack instances are related to human performance, we held the number of items and the knapsack capacity constant throughout all minigames. These 12 items were arranged in a grid. Each item’s display comprised a visual icon of the item, along with its weight and value. We designed the value-weight pairs of the 12 items to exhibit variation in terms of known measures of theoretical complexity across the 100,000 problem instances (see Section 3.4.1 and Section EC.1.1 for details). Two separate displays at the top right corner of the interface showed players their remaining knapsack capacity available and the total value of all items that they had selected thus far. To place an item into the knapsack, a player would tap on the icon corresponding to that item, upon which that icon would be highlighted in yellow and displayed with a green ‘tick’ symbol; a further tap on that same icon would remove the item from the knapsack, thereby clearing the yellow highlight and green tick indicators. Items that could no longer be selected (because doing so would violate the knapsack weight constraint) would be switched to a bolded red font as a convenient way to indicate to players that they were unselectable. Players who tried to tap on the icons representing unselectable items would be given a brief error message.
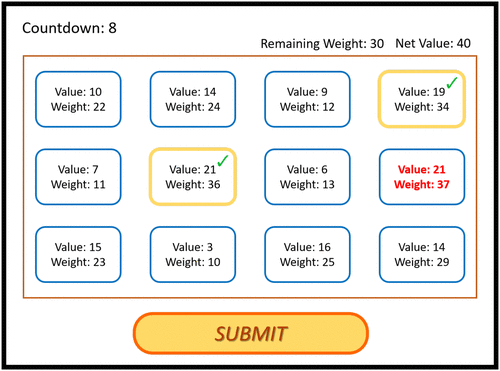
Notes. Weights and values of each item are displayed with each item. In this example, two items have been selected (row 1, column 4 and row 2, column 2) for a total value of 40, and total weight of 70. One of the remaining items (row 2, column 4) can no longer be selected.
To maintain compatibility with the fast pace of the primary game while still allowing sufficient time to complete the knapsack task, players were given 30 seconds in each minigame attempt to select a subset of the 12 items to place in their knapsack. Players who were satisfied with their choices could submit their choices before the allotted time by tapping the ‘SUBMIT’ button at the lower part of the screen. A countdown timer at the top left of the screen informed players of the remaining time left for their choices. Upon timeout, the system would automatically submit the choice set that was currently selected by the player. We recorded the sequence of player decisions and their final submitted solution of each minigame attempt in the data set.
Participants were rewarded based on the total value of their submitted knapsack. Namely, the cumulative total value that each participant accrued across all their knapsack attempts could be exchanged for various bonus items throughout the duration of the event. These items would confer benefits on players’ gameplay, including aesthetic enhancements and bonuses to various aspects of a player’s primary gameplay. The authors of this study were not involved in the design of these bonus items. Instead, these were designed by representatives at gaming company who had substantial expertise and experience calibrating such rewards for previous limited-time events in order to encourage high participation and engagement.
For our base-case analysis, we excluded all player attempts that ended in timeouts. We also designated each player’s first three attempts at the knapsack minigame as practice runs for players to get familiar with the minigame and its rules, and excluded these submissions from our base-case analysis. We varied these assumptions in sensitivity analyses where we investigated the robustness of our findings to different constructions of the data sample (please see Section 3.5 for a full description of all sensitivity analyses conducted).
The final data set for our base-case analysis comprised 150,284,195 total minigame attempts made by 17,950,838 unique player accounts across the gaming platform’s global player base. Table 1 presents summary statistics of the final data set, broken down by server region.
|

Table 1. Summary Statistics of Selected Variables in the Final Data Set
| Region | A | B | C | D | E |
|---|---|---|---|---|---|
| Overall statistics | |||||
| Num. minigame attempts | 1,719,964 | 27,406,396 | 13,020,861 | 18,260,964 | 89,876,010 |
| Num. unique player accounts | 205,205 | 2,891,493 | 1,377,389 | 1,411,535 | 12,065,216 |
| Solution quality | 0.66 0.27 | 0.66 0.27 | 0.66 0.27 | 0.71 0.25 | 0.60 0.27 |
| Instance-level complexity measures | |||||
| Correlation between value and weight vectors | 0.94 0.03 | 0.94 0.03 | 0.94 0.03 | 0.94 0.03 | 0.94 0.03 |
| Sahni complexity measure | 2.90 1.66 | 2.90 1.66 | 2.90 1.66 | 2.90 1.66 | 2.90 1.66 |
| Optimal number of items in knapsack | 3.85 0.80 | 3.85 0.80 | 3.85 0.80 | 3.85 0.80 | 3.85 0.80 |
| Minimum gap from Sahni heuristics | 0.00 0.01 | 0.00 0.01 | 0.00 0.01 | 0.00 0.01 | 0.00 0.01 |
| Maximum gap from Sahni heuristics | 0.17 0.09 | 0.17 0.09 | 0.17 0.09 | 0.17 0.09 | 0.17 0.09 |
| Gap from greedy value heuristic | 0.24 0.10 | 0.24 0.10 | 0.24 0.10 | 0.24 0.10 | 0.24 0.10 |
Note. Means and, where applicable, standard deviations of features reported.
3.3. Field Experiment Design Considerations
There were some advantages conferred by the setting of study as a minigame within the “live” operations of a mobile gaming platform. First, players were naturally incentivized to participate in the minigame. Although our partner organization declined to provide concrete statistics, they had mentioned to us at the onset of our study that historically, approximately 80% of active players would participate in such minigame events. Likely, this high participation rate was a combination of extrinsic incentives (e.g., in the form of in-game rewards) that players would obtain and intrinsic incentives (e.g., the introduction of a novel, limited-time, element into standard gameplay). Second, this setting meant that we had access to a large and diverse set of participants engaging with our experiment through the natural pursuit of a leisure activity. One advantage that this confers is that it avoids the artificiality of a pure laboratory setup, though we acknowledge that our setting is nonetheless an approximation of an actual economic setting.
On the other hand, our study’s setting also necessitated certain design considerations. We believe that these design considerations can also serve as a guide to future studies that aim to use mobile games to perform behavioral experiments. Perhaps the most important overarching consideration, which influenced our experiment’s design along several dimensions, was that we had to operate within certain norms. Broadly, we can categorize these considerations into two groups: those that stemmed from norms inherited from the primary FPS game in particular, and those that stemmed from norms of video gaming in general.
3.3.1. Norms from the Primary FPS Game.
Firstly, these norms influenced the visual aspect of our minigame design. To ensure player engagement and enjoyment of the minigame, it was obvious that we had to have fresh and appealing minigame visuals. It was, however, also critical that our visual design had to organically fit with the virtual world of the primary game to preserve the sense of immersiveness when players engaged with the minigame. Therefore, we engaged with our industry collaborators not only during the deployment phase of the experiment when we were ready to go live. Instead, we also involved them in the early phases of the experimental design and collaboratively brainstormed how to develop a story for the minigame that would make sense to players of the primary game and yet would allow us to run the experiment.
These same norms also influenced our choice of a relatively short timeout for the minigame. The primary game, being a FPS, generally emphasized fast-paced action and decisions. Generally, minigames for this primary game typically do not last long either. We were also concerned that an overly long timeout on the minigame would cause players to perceive the minigame as “work” and a source of frustration. Finally, because we could not monitor participants’ solution process (unlike a typical laboratory experiment), we were concerned about the possibility that players would transcribe their problem instance into a computerized solver to cheat. We therefore used a short timeout to mitigate the likelihood that players could feasibly do so. To reduce the impact of the timeout on our results, our base-case analysis was conducted on the sample of player submissions that did not end in a timeout (150 million submissions across the five regions, see Table 1). We also conducted a sensitivity analysis using an alternative data construction that included submissions from timeouts to assess whether this exclusion substantially biased our results (please see Section 3.5).
3.3.2. Norms of Video Gaming in General.
These norms imposed limits on the nature of variations that we could investigate in the study. In video games, it is typical for a game’s top-level user interface (often called a heads-up display, or HUD) to be relatively constant, even if the elements within the interface can vary. Therefore, we held the total number of items (fixed at ) and their arrangement (in a grid) constant throughout the experiment. Instead, we only varying only the knapsack weights and values across instances—these were also the elements that players would generally accept as variable. These norms also meant that we had to design the experiment such that its instructions and objectives were easy to understand with a low learning curve. Nonetheless, we expected that players would have to spend a few initial attempts to get familiar with the mechanics and rules of the knapsack minigame. Therefore, in our base-case analysis, each player’s first three attempts were designated as practice runs for players excluded from the final data sample used in our main analysis. We varied this threshold in sensitivity analyses (please see Section 3.5).
Video gaming norms also influenced how we incentivized and rewarded participants. In a behavioral laboratory, it would perhaps be feasible to only reward participants for complete (i.e., optimal) solutions. However, such an all-or-nothing reward system would be an exception rather than the norm in video games, and even in the context of this game. As such, in keeping with these norms, we chose to reward players for partial solutions, even if they were not able to solve the given problem to optimality. Specifically, in each attempt, participants were rewarded based on the total value of their knapsacks, so that they would feel a sense of progress and achievement even if they failed to attain an optimal knapsack. This consideration also influenced our analytical strategy. Instead of using a binary dependent variable to indicate whether an optimal solution was attained, we focused on a dependent variable that measured participants’ relative solution quality, that is, our dependent variable was defined as the ratio of the total value of a participant’s submitted knapsack to the total value from an optimal knapsack.
Apart from these norms, our lack of control over the participants’ solution process, relative to a laboratory experiment, meant that we could not directly monitor how participants were solving these problems, and, in particular, whether they were using computerized algorithms to aid them or gaining unfair advantages by collaborating. We therefore designed our experiment to mitigate the possibility of these occurring. We used a large pool (100,000) of knapsack instances to ensure that the probability of players encountering a duplicate instance was negligibly small. We also did this to minimize the possibility that players would be able to share presolved solutions of problem instances, for example, through online forums or other means, which might be a feasible means of gaining an unfair advantage if we had only used a small number of distinct instances.
3.4. Empirical Strategy
3.4.1. Outcome Variable, Regressors, and Hypothesis Development.
Our main outcome of interest in this study was the solution quality of each minigame attempt, defined as the ratio between the total value of the player’s submission to the optimal value of that knapsack instance, which has also been called “economic performance” in previous studies (Murawski and Bossaerts 2016). We used linear regression to estimate the relationship with (a) a set of instance-level independent variables that represented various measures of knapsack complexity, the primary focus of this paper; (b) the count of each participants’ past attempts, which was intended to model learning behaviors within the knapsack minigame, a secondary focus of this paper; and (c) a set of participant-level controls of their gameplay statistics from the primary game. We provide a comprehensive summary of these features in Table EC.2, and discuss these features below.
The primary goal of this study was to assess how different measures of knapsack “complexity” would cause players to perform better or worse, on average. We considered six such measures, designed based on theoretical constructs and findings from existing research. We note that each of the six measures were constructed so that a higher value of that measure represents greater instance complexity; in other words, a priori, we expect a negative relationship between each measure and solution quality. To provide greater insight into these measures, in Section EC.1.2 of the Electronic Companion, we illustrate how these measures were computed for two selected examples of knapsack instances that were part of this experiment. We elaborate on each measure below.
The first measure in this group was the Pearson correlation between value and weight vectors. We included this because a body of computational research has shown that most algorithms tend to find highly correlated instances difficult to solve (Martello and Toth 1988, 1997; Pisinger 1999, 2005). Intuitively, as the Pearson correlation increases, individual items become less distinguishable from the perspective of item-level value density (value divided by weight). Therefore, we make the following hypothesis:
Participants’ performance declines as the Pearson correlation increases.
The second complexity measure included in this group was the Sahni complexity of the instance (Meloso et al. 2009, Murawski and Bossaerts 2016, Franco et al. 2021). This measure is based on a class of popular heuristics to the knapsack problem called Sahni-k, where k is a nonnegative integer parameter (Sahni 1975). In this heuristic, a brute force search is first used to find an optimal knapsack with exactly k items, after which the remainder of the knapsack is filled using a greedy algorithm that added items in decreasing order of value density until no more items can be put in. The Sahni complexity is then defined as the smallest value of k that attains the optimal value of the knapsack. For example, a knapsack instance with a Sahni complexity measure of zero means that an optimal knapsack can be achieved by a fully greedy algorithm. Intuitively, an instance with a low value of this Sahni measure can be interpreted to mean that the effective size of the knapsack is smaller since we only need to solve a “smaller” instance by brute force to attain the fully optimal solution, and thus should be easier to solve. Previous laboratory research with human solvers found that higher values of the Sahni complexity measure tended to result in knapsack solutions of lower solution quality (Murawski and Bossaerts 2016), and therefore, we make the following hypothesis:
Participants’ performance declines as the Sahni complexity measure increases.
The third measure in this group was the size (i.e., number of items) in that instance’s optimal knapsack. It was possible for a given instance of knapsack problem to have multiple optima, and thus, different optimal sizes. Therefore, in our base-case model, we defined “size” as the simple average between the size of the smallest optimal knapsack and the size of the largest optimal knapsack; this definition was varied in our sensitivity analyses. We expected that when the optimal knapsack size increased, participants would have more options to tradeoff and should thereby encounter more difficulty, which led us to make the hypothesis:
Participants’ performance declines as the size of the optimal knapsack increases.
The final three complexity measures in this group were based on the notion of optimality gaps from different heuristics of solving the knapsack problem. To our knowledge, the role of optimality gaps as measures of human-experienced knapsack difficulty has not been investigated empirically. However, similar complexity measures based on optimality gaps have been proposed in previous theoretical work (Balas and Zemel 1980). In the present study, the first two heuristics were constructed from the Sahni-k heuristic algorithms. Originally, we had intended to use one heuristic per value of k, for for a total of five measures. However, preliminary analyses revealed that the optimality gaps produced from these heuristics had high linear correlations (see Figure EC.2), which could lead to issues of multicollinearity in the subsequent regression analyses. We therefore pared this down from five to two measures by computing the minimum and maximum of these five optimality gaps. Our third and final heuristic was a naïve heuristic that greedily put in items in descending order of values, with no regard for their weight. Given a knapsack instance, if a heuristic solution applied to that instance had a relatively large optimality gap (i.e., difference between the true optimal value and value from that heuristic), we expected the instance to pose more difficulty for humans to solve, which led us to the following three hypotheses:
Participants’ performance declines as the minimum optimality gap of the Sahni heuristics increases.
Participants’ performance declines as the maximum optimality gap of the Sahni heuristics increases.
Participants’ performance declines as the optimality gap from the greedy value heuristic increases.
The first three panels of Figure 2 illustrate the distribution of a selection of these complexity measures across the 100,000 knapsack instances. The bottom right panel of the figure is a heatmap of the correlation matrix of these six measures. From the figure, we observe a reasonable dispersion of instances across the plotted measures, and that the correlations among these measures are at most moderate in extent.
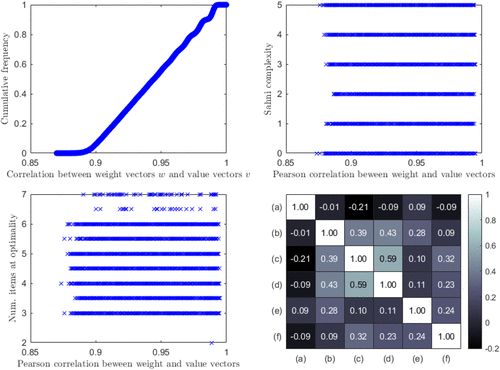
Notes. Top left: Cumulative distribution of Pearson correlation between weight vectors w and value vectors v over the 100,000 simulated knapsack instances. Top right: Scatter plot of Pearson correlation (between w and v) against Sahni complexity measure. Bottom left: Scatter plot of Pearson correlation (between w and v) against number of items in optimal knapsack. Bottom right: Correlation matrix of complexity measures. Legend: (a) Pearson correlation between w and v, (b) Sahni complexity, (c) number of items in optimal knapsack, (d) minimum optimality gap from Sahni heuristics, (e) maximum optimality gap from Sahni heuristics, (f) optimality gap from greedy value heuristic.
In addition to the instance-level complexity measures described above, we also controlled for a group of player-level statistics relating to their performance and activity in the primary game. These features were included in the regression model to serve as controls, but were otherwise not a central focus of this study. Features in this group included statistics of player activity (both in the most recent 30 days leading up to the knapsack event and throughout their time on the mobile platform), measures of player skill (their rank, MMR scores, number of opponents eliminated, win rate), and measures of their social and behavior on the platform (whether they were a member of a clan and how much, if at all, they had spent on in-game premium currency).
Remark: It is important to emphasize that the instance-level complexity measures were only functions of the parameters of each knapsack instance, which was in turn randomly assigned to each minigame attempt. This meant that any relationship found between features in this group and the outcome can be interpreted as causal effects. The summary statistics in Table 1 corroborate this. Because knapsack instances were randomly assigned to each knapsack attempt, we can observe that the statistics (both means and standard deviations) of each of these six measures are balanced across the five regions.
3.4.2. Regression Model Specification.
We can now formally specify the regression model used in our primary analysis, as follows:
In (2) above, i is used to index individual players and j to index their knapsack attempts. On the LHS of (2), the outcome variable represents the solution quality of the jth knapsack attempt by player i, which we defined as the ratio between the total value of the player’s submitted knapsack to the total value attained by an optimal knapsack. On the RHS, the vector represents the six instance-level complexity measures of the jth attempt made by player i, represents the count of player i’s attempts thus far and is a vector that captures the primary gameplay statistics of player i. We assumed that the residual, , had zero mean and a block-diagonal covariance matrix, where each block corresponded to an individual player. In other words, when we report the results of our regression model, the standard errors that accompany the point estimates of the regression coefficients should be interpreted as Liang-Zeger standard errors that are clustered at the level of individual players (Liang and Zeger 1986).
We conducted secondary analyses that separately investigated (a) the shape of how average solution quality varied with instance-level complexity measures, and (b) how players’ activity in the primary game were associated with performance and learning, and (c) longitudinal player learning behavior. The results of these analyses are respectively described in Sections 4.3, 4.4, and 4.5.
3.5. Sensitivity Analyses
We conducted a suite of sensitivity analyses to investigate the robustness of this study’s primary findings to alternate specifications of the regression model, in which we added groups of independent variables sequentially (this was equivalent to using the base-case specification (2) but adding constraints on different groups of coefficients to zero). In addition, we investigated whether our results were robust to alternative constructions of the data sample. To do so, we retained the base-case specification in (2) but re-estimated the model using different assumptions in constructing the data, by:
(a) Including player attempts that ended with timeouts,
(b) Defining the optimal knapsack size as the number of items in the smallest optimal knapsack or the number of items in the largest optimal knapsack.
(c) Excluding the first 6, 9, or 12 minigame attempts instead of just the first three,
(d) Only including minigame attempts from players who were active on the mobile platform for 5, 10, or 15 days within the last 30 days of the start of the knapsack event, or
(e) Only including minigame attempts from players who were active on for more than 30, 60, or 90 days in total since the point that they joined the platform.
3.6. Trial Pre-Registration and Approval
This study was preregistered at the American Economic Association’s randomized controlled trial registry (RCT ID: AEARCTR-0008307) before the start of data collection. We believe that such preregistration is an important step to reduce reporting bias, increase research transparency, and avoid the pitfall of inappropriate posthoc rationalization of our results. In addition, ethical approval was sought and obtained from our host institution (NUS Business School, approval number BIZ-AO-21-0623) before data collection. Players consented to the use of anonymized gameplay data for research within the terms and conditions of the primary game.
4. Results
4.1. Results from Base-Case Model
We report regression results of our base-case model in Table 2. It is striking that, apart from some minor exceptions, the estimated coefficients for all features were generally directionally consistent across all five regions, which provides some reassurance that the results display a reasonable degree of internal consistency. To assess possible multicollinearity, we computed the variance inflation factors (VIFs) of our primary regressors of interest, which we report in Figure EC.3. The largest VIF in our model was around 1.77, well below the conventional threshold of 4.0. In contrast, when we repeated this regression model using the original set of Sahni optimality gaps as regressors, several of the regressors had VIF values above 4.0 (see Figure EC.4). These results give us some assurance that multicollinearity is not a substantial cause of concern in our primary regression model, and further substantiates our choice of using our pared down set of six regressors as measures of instance-level complexity.
|
Table 2. Regression Results of Main Model
| Region | A | B | C | D | E |
|---|---|---|---|---|---|
| Intercept | 0.671*** (0.026) | 0.796*** (0.008) | 0.826*** (0.012) | 0.493*** (0.008) | 0.613*** (0.004) |
| Instance-level complexity measures | |||||
| Correlation between value and weight vectors | 0.338*** (0.007) | 0.350*** (0.002) | 0.343*** (0.003) | 0.329*** (0.002) | 0.311*** (0.001) |
| Sahni complexity measure | 0.004*** (0.000) | 0.004*** (0.000) | 0.004*** (0.000) | 0.004*** (0.000) | 0.004*** (0.000) |
| Optimal number of items in knapsack | −0.015*** (0.000) | −0.015*** (0.000) | −0.016*** (0.000) | −0.022*** (0.000) | −0.017*** (0.000) |
| Minimum gap from Sahni heuristics | −0.504*** (0.019) | −0.503*** (0.005) | −0.500*** (0.007) | −0.497*** (0.005) | −0.441*** (0.003) |
| Maximum gap from Sahni heuristics | −0.029*** (0.002) | −0.026*** (0.001) | −0.030*** (0.001) | −0.040*** (0.001) | −0.023*** (0.000) |
| Gap from greedy value heuristic | −0.051*** (0.002) | −0.041*** (0.001) | −0.046*** (0.001) | −0.083*** (0.001) | −0.055*** (0.000) |
| Measure of player learning | |||||
| Num. minigame attempts per player | 0.010*** (0.000) | 0.010*** (0.000) | 0.010*** (0.000) | 0.008*** (0.000) | 0.012*** (0.000) |
| Control for primary game player stats? | Yes | Yes | Yes | Yes | Yes |
| R2 | 0.0887 | 0.0850 | 0.0920 | 0.0808 | 0.0555 |
| Num. observations | 1,719,964 | 27,406,396 | 13,020,861 | 18,260,964 | 89,876,010 |
| Num. covariates | 27 | 27 | 27 | 27 | 27 |
| F-statistic | 6,441.3 | 97,969.2 | 50,756.7 | 61,746.6 | 202,976.8 |
Notes. Means and standard errors (in parentheses) of regression coefficients. Standard errors are clustered at the level of individual player accounts.
From the table, we observe that the two traditional measures of greater knapsack difficulty (i.e., higher correlation between value and weight vectors and higher Sahni complexity) generally had estimated regression coefficients that were positive and statistically significant at the 0.1% level. This meant that, all else being equal, players performed better on knapsack problems that were rated as more difficult according to these measures, representing counterevidence against Hypotheses 1 and 2. This finding was contrary to our initial expectations based on findings from the literature.
For the remaining four features, the direction of the estimated effect was negative and statistically significant at the 0.1% level across all five regions, in line with our expectations. In other words, all else being equal, players performed worse on knapsack instances that featured larger numbers of items in an optimal knapsack, and on instances in which heuristics also failed to tackle well. These represented evidence in support of Hypotheses 3 through 6.
On average, we found that higher solution quality was associated with larger numbers of past minigame attempts by players, and this was again significant at the 0.1% level across all five regions. Participants were likely able to gain proficiency through the course of the event, and were learning to improve their performance over subsequent attempts, even though they were presented with different instances of the problem at each attempt. It is likely that on average, players were experimenting more in their initial attempts, and they reaped the rewards of more effective gameplay in their later attempts. We conducted several secondary analyses to investigate player learning more deeply: In Section 4.4, we study whether players exhibited heterogeneity in their learning effectiveness by primary game characteristics, in Section 4.5, we assess how assigning players to initial knapsack instances of differing difficulties affected their performance in later attempts, and in Section 4.6 we investigate the issue of player dropouts in greater depth.
4.2. Results from Sensitivity Analyses
From Tables EC.3 to EC.7, we observe that across all five server regions, the directional effects of all regressors were robust to the inclusion/exclusion of other groups of independent variables. Specifically, across all five server regions and model specifications, consistent with what we found in our base-case analysis, players performed better for instances that were theoretically rated as more difficult using the Pearson correlation measure and the Sahni complexity measure. As in the case of the base model, the other instance-level measures (the optimal number of items and the three measures using optimality gaps) had negative effects on player performance, and this was again consistent across all five server regions and all specifications in which these measures were included. The positive association between the number of past minigame attempts and solution quality was similarly robust.
We also obtained directionally consistent findings with alternative methods of constructing the data sample. Tables EC.8 to EC.19 reports detailed regression results of these alternative data constructions, and these results are summarized in Figure 3. For each of the six instance-level measures, the 13 different data construction approaches (1 base construction plus 12 different constructions from the sensitivity analyses) resulted in 13 respective point estimates. Figure 3 visually summarizes these estimates as Tukey-style box-and-whisker plots (McGill et al. 1978). We observe that the estimates for each of the six measures are relatively well-clustered, and importantly, are all directionally consistent: Positive effects were observed for the Pearson correlation and Sahni complexity measures (top two panels), whereas negative effects were observed for the other four measures (bottom four panels).
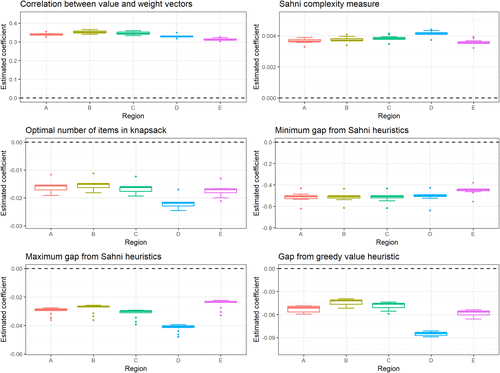
Notes. Estimated effects of knapsack instance characteristics on player solution quality with different constructions of final data set. Zero level represented as horizontal dashed line in each subplot.
It is worth discussing our sensitivity analysis of timeouts in greater depth. Attempts that end in timeouts may reflect more difficult knapsack instances for players, who may be taking longer to deliberate on these instances. Conversely, a given player who timed-out in an attempt could be exerting more effort at working on their given knapsack instance, which could lead higher solution qualities. Although attempts ending in timeouts represented a small fraction of all player attempts, ranging from 3.3% to 4.0% across regions, the two possibilities discussed above imply that omitting timeouts from our base-case analysis may contribute bias to our estimates, and in an indeterminate direction. Therefore, it is reassuring that the results of this sensitivity analysis (reported in Table EC.8) showed that the overall directional effects in our base-case analysis continued to hold even when timed-out attempts were included, and that the estimated coefficients were generally similar in magnitude across regions. This suggests that despite these potential biases incurred by the timeout mechanism, it was not likely a substantive driver of our core results.
4.3. Dependence of Solution Quality on Instance-Level Measures
In our primary analysis, we estimated the average directional effects of each of the six instance-level complexity measures on solution quality. The analysis had allowed us to conclude whether players’ submitted solution qualities would improve or decline as each of the six measures increased or decreased. However, it did not allow us to make richer conclusions about the shape of these dependencies, that is, when these would intensify or attenuate with each of the measures.
To investigate this question, we repeated our primary analysis using a polynomial regression model specification instead of a linear model. To be precise, we replaced model (2) with (3) below:
In (3), d is a parameter that represents the degree of the polynomial used in this regression (the case of corresponds to the base case model (2)); , where represents the (6-tuple) vector of instance-level complexity measures with each component raised to with pth power; and is a (6-tuple) vector of regression coefficients corresponding to the term. As in the base-case model, we assumed that standard errors were clustered at the level of individual players (Liang and Zeger 1986). In our analysis, as a robustness check, we also estimated a second variation of model (3) where we only retained the six regressors corresponding to instance-level complexity measures.
Because these regression coefficients do not lend themselves to simple interpretations, we opted for a visual representation of the results. For a given d, we estimated the coefficients in model (3) and the variance-covariance matrix of the model with clustered standard errors. Next, for each given instance-level complexity measure, we found their minimal and maximal values in the data, and generated a sequence of points between these values. We then used the estimated coefficients of (3) to compute the predicted value of the outcome variable (i.e., solution quality) for each point in this sequence and with all other independent variables set at the mean values; similarly, we used the variance-covariance matrix to compute 95% confidence intervals around the estimated solution quality. We then repeated this process for each instance-level complexity measure.
We tested different values of the degree parameter d and found little substantive differences in the plots from onwards. We henceforth only report results for . Figure 4 illustrates these plots for each of the six instance-level complexity measures for Region A, which was the region with the smallest number of minigame attempts and unique player accounts, and thus had the largest standard errors. Figure EC.5 shows that the shape of dependence of solution quality on each of the instance-specific complexity measures were generally consistent across the five regions. The results for the second model variant with only instance-level complexity measures as regressors were highly similar; we omit presenting these results for brevity.
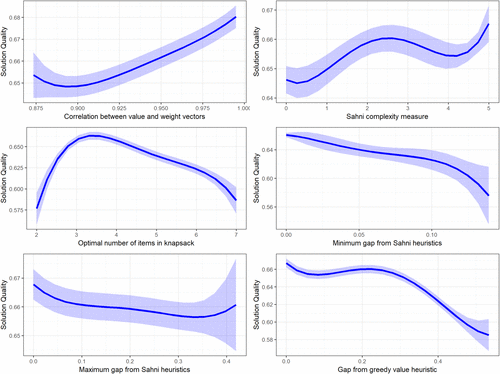
Note. Estimates were obtained from Region A and degree was used in the regression.
These results corroborated our primary findings in aggregate, but also revealed richer details about how each measure affected solution quality. At the lower end of the range of our tested Pearson correlation (between 0.875 to 0.900), there was a mild negative relationship between estimated solution quality and correlation. The overall increasing association between Sahni complexity and solution quality was modulated by an oscillating pattern, and there was a mild negative relationship between Sahni complexity in solution quality for complexity values from around 2 to 4. Previous studies had found similar negative relationships between Sahni complexity and solution quality, and this oscillatory pattern with locally positive and negative components could be one way to explain why our present findings differed from previous studies (Meloso et al. 2009, Murawski and Bossaerts 2016). Solution quality was positively related to the number of items in the optimal knapsack as the latter varied from 2 to 3; and was negatively related thereafter. This negative relationship seemed almost linear until the latter exceeded 6, after which the negative relationship appeared to intensify. Solution quality exhibited consistent negative relationships between the three remaining optimality gap-based complexity measures across the range of each of these three measures. The strength of these relationships intensified in the upper range of the “minimum gap from the Sahni heuristics” complexity measure, and attenuated in the upper ranges of the remaining two complexity measures.
The results above describe the impact on player performance from variations in individual measures, holding all else equal. To assess the impact on performance from multiway variations of groups of measures, particularly if these variations come from features with differing individual directional effects (e.g., an instance with a high level of Sahni complexity and large optimality gaps, which occurs with some regularity since these features are moderately positively correlated (see bottom right panel of Figure 2)), one would substitute their respective values into the regression model (2) to estimate players’ performance. Figures EC.6 through EC.10 display the results of two-way variations for all pairs of measures for each of the five regions. It is worth noting that the results are again qualitatively consistent across regions, suggesting that these findings are robust. These results can be used to determine which of the factors are comparatively more important. For example, from Figure EC.6, we observe that problems that have high values of Sahni complexity and high values of the optimality gap from a greedy heuristic are estimated to have low quality scores, that is, the overall effect of the latter dominates. One can use these results to make similar inferences for the joint effect of other pairs of measures.
4.4. Variation of Player Performance and Learning with Primary Game Statistics
Having found evidence of player learning (see Table 2), we now investigate potential sources of heterogeneity in players’ learning effectiveness and their performance in the minigame. Specifically, we seek to understand whether heterogeneity in these outcomes may be driven by variations in player’s performance in the primary game.
We estimated variations of our primary regression model (2) by separately adding interaction terms between the count of each player’s minigame attempts () and key primary gameplay statistics of that player (components of ). Summarized results of these analyses are reported in Table EC.20. In all model variants, estimated coefficients on player’s minigame attempts were positive and significant at the 0.1% level across all five regions. These again demonstrate that players learn with repeated minigame attempts, further corroborating the results from our base-case analysis.
These results also shed light into sources of heterogeneity in player performance and learning effectiveness. Most measures of player engagement (e.g., clan membership, number of active days since joining the platform) and skill (e.g., player rank, opponent damage, number of opponents defeated, win rate, MMR score) were associated with higher performance on the knapsack minigame across all five server regions, at significant levels of 5% or lower. However, the time that players spent online—encompassing both match time and nonmatch activities (e.g., socializing with other players outside of matches)—was negatively associated with minigame performance, regardless of whether this was measured as time spent within the last 30 days or the total time spent since joining the platform. One way to summarize the former set of results is that “experienced” players of the primary game tended to perform better on the minigame on average. The latter set of results refine this notion by suggesting that it was the experience gained via gameplay in matches itself that was positively associated with better minigame outcomes, instead of the total time spent engaging with the platform. These results add to the literature investigating how games can be used for cross-context skills acquisition (see, e.g., Pilegard and Mayer 2018, Liu and Jeong 2022).
Estimated coefficients on the interaction terms were generally negative across all the five regions, for all player statistics that we evaluated. Together with the results in the previous paragraph, this means that although less experienced players start out performing poorer on the minigame on average, they tend to learn more efficiently with repeated attempts compared with more experienced players. One potential explanation of this is that players are starting at different points on a typical concave-shaped learning curve (Newell and Rosenbloom 1981): At the outset, more experienced players start out further out on the learning curve, potentially exhibiting better performance because their skills and experience in the primary game translate into better performance on the knapsack game. Conversely, less-experienced players may start out earlier on the learning curve, face a steeper slope and thereby learn more effectively.
4.5. Longitudinal Learning Behaviors
In this set of secondary analyses, our broad goal was to gain deeper insights into how players were learning from their past minigame attempts. We were interested to understand if there was evidence of path-dependence in players’ learning. The central question that we sought to answer was: Does the difficulty of previous problems encountered by players affect their performance in future minigame attempts? This question is motivated by findings in the psychological literature that facing “desirable difficulties” can improve learning outcomes (see, e.g., Bjork and Bjork 2020, and references therein).
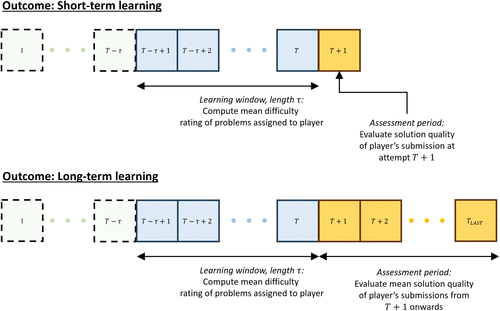
There were two specific outcomes in players that we aimed to evaluate in this set of analyses: their short-term and long-term learning. The analytical strategy that we used to investigate both outcomes shared a common framework, which we will now describe. In this framework, the unit of observation was a unique player account (note the contrast with our primary analysis in Sections 4.1 through 4.3, where a unit of observation was a single minigame attempt). Data across all five regions were pooled for this analysis.
Central to our framework are the twin notions of a learning window, from which we constructed our key independent variable of interest, and an assessment period, from which we constructed our outcome variables. Each run of our analysis is parameterized by two positive integers, which we denote by T and , which we varied across different runs. We considered each players’ th to their Tth minigame attempt as their learning window, so that T can be interpreted as the player’s last learning attempt and as the length of the learning window. The assessment period refers to one or more subsequent minigame attempts after the players’ learning window. For the outcome of short-term learning, the assessment period was the player’s th minigame attempt, and for the outcome of long-term learning, the assessment period was the set of all their minigame attempts after and including their th attempt. Figure 5 illustrates our framework for both outcomes.
Our main independent variable of interest was the average difficulty rating of the knapsack instances assigned to the players during their learning window (in short, their “average difficulty rating while learning”). To construct this variable, we had to assign a difficulty rating to each of the 100,000 knapsack instances. The astute reader will recognize that the methodology for doing so follows from our analysis in Section 4.3, with some minor modifications to prevent bias. First, we randomly sampled half of the players in the region, and repeated the polynomial regression specified by (3) on their minigame submission with degree as before. For this regression, we used the second model variant where only the six instance-level complexity measures were included as regressors so that the estimated difficulty rating for each instance would only depend on these measures and not on other player statistics. Second, for each of the 100,000 knapsack instances, we obtained the values of these instance-level measures and used the estimated coefficients from the regression to obtain their predicted solution qualities. Third, we defined each instance’s difficulty rating as the complement of (i.e., 1 minus) its predicted solution quality.
Our subsequent analysis was only performed on the players who were not part of the sample used to estimate these regression coefficients. This is analogous to the notion of “honest estimation” in machine learning where separate data samples are used for model selection and evaluation (Athey and Imbens 2016, Wager and Athey 2018). We further restricted the final data sample to players who had attempts or more, so that the outcomes would be well-defined. For these players, we defined the key independent variable, their “average difficulty rating while learning,” as the mean difficulty rating of all the knapsack instances to which the player was assigned during their learning horizon. We emphasize that this measure of rating difficulty was only a function of the knapsack instances to which a given player was randomly assigned, and the regression coefficients estimated from a separate sample. Importantly, this rating measure did not depend on that player’s submitted qualities to those assigned problem instances. Because the learning window is also exogenously determined, the above means that our independent variable is also a quantity that is randomly assigned to players. In addition to this independent variable, all our regressions also controlled for player statistics in the primary game (third group of variables in Table EC.2). Our objective of this analysis is therefore to investigate the following hypothesis:
Players who face knapsack instances with a higher average difficulty rating during their learning windows deliver higher average solution qualities during their assessment periods.
We varied the learning window from 3 to 8, and, for each , by varying the last learning attempt T from to 25. Figure 6 summarizes the results of these analyses, by indicating the direction of the relationship between players’ average difficulty while learning and their learning outcomes for different parameter combinations of and T. These results reveal two main insights:
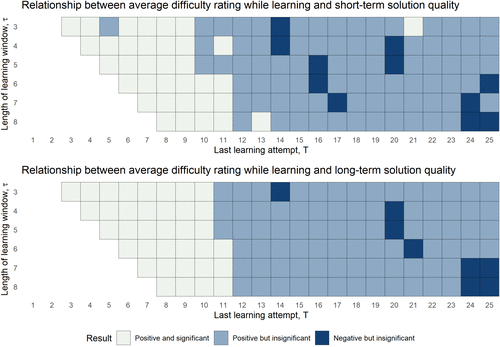
Adversity drives performance. From the top panel of Figure 6, we observe that when players experienced more difficult problems in their learning windows, they generally performed better in their th attempts, in support of Hypothesis 7. The results were most striking for small (left side of figure), where this finding was statistically significant across a large majority of window lengths that we tested; for larger T (right side of figure), the majority of findings were directionally consistent but not statistically significant. It is likely that this indicates diminishing returns to learning from difficult instances. Figure EC.11 supports this interpretation, as it depicts a decrease in effect size as T increases. We cannot, however, rule out the possibility that the statistically insignificant results for large T in Figure 6 were driven by reduced sample sizes for those parameters. The results for rows corresponding to small can be interpreted as meaning that players continued to enjoy the salutary effect of difficult knapsack assignments beyond their initial attempts: For instance, the results for mean that all else being equal, players who faced more difficult knapsack instances in their 7th to 9th attempt tended to submit higher quality solutions in their 10th attempts.
Performance improvements persist over time. This insight is perhaps best understood through a thought experiment. Suppose that the salutary effects of exposure to difficult instances were short-lived (i.e., perhaps only affecting their immediate th attempt). In this scenario, we expect to see large differences between the top and bottom panels of Figure 6. Specifically, we expect a much more noisy set of results in the bottom panel (since players’ outcomes in future attempts far beyond would be unaffected by the short-lived nature of learning). However, as it turns out, the results in the bottom panel show broadly similar trends to that of the top panel, indicating the converse; namely, even the long-run averages of players’ solutions tend to be positively affected by their exposure to difficult instances in their past. This effect was again most pronounced for smaller values of T.
4.6. Player Persistence and Dropouts
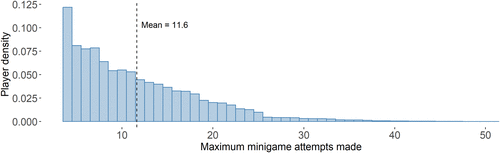
Our previous analyses had focused on the central outcome of players’ “performance” on the knapsack minigame and their learning behaviors to improve their performance. In this subsection, we consider the outcome of player “persistence,” measured as the maximum number of minigame attempts made by a player in the experiment. For brevity, we will refer to this as their last attempt or the attempt in which they dropped out. This outcome is important because it serves as an indirect measure of player motivation.
We used the same player-level data set as described in Section 4.5 for this analysis. Figure 7 illustrates the pattern of player dropouts, which shows that apart from an initial bump where a fair number of players dropped out early, the dropout pattern was roughly exponential in shape. We also regressed players’ last attempt against their primary game characteristics ( in the notation of model (2)) to understand which players were more likely to persist longer in their minigame attempts. Table EC.21 reports the results of this regression. Generally speaking, players who were more recently active and skilled in the primary game tended to persist longer, that is, engage with more attempts before dropping out. However, total activity, measured by number of days since joining or by total online time, were mostly negatively associated with persistence. This could be an indication of player fatigue, where longtime players may no longer feel as engaged in the overall gameplay to persist with the minigame and seek its rewards. The quantity of premium currency used was also negatively associated with persistence. This is likely because premium currency can be used to purchase of enhancements that may eclipse the rewards of the minigame, and therefore can be a substitute for gameplay effort.
Next, we also conducted a longitudinal analysis using an almost identical setup as depicted in the top panel of Figure 5, with one key difference. Previously, we had evaluated player performance in their th attempt; here, we evaluated whether the player continued to persist in that attempt. The key variable of interest was, as before, the mean difficulty rating of problems during the player’s learning window. The goal of this analysis was to understand whether players who were faced with more difficult problems would have a higher propensity to drop out, perhaps because they might be discouraged by the more difficult instances. The results of this analysis are depicted in Figure EC.12. In contrast to the results in Section 4.5, here we see no robust patterns, with most of the estimated effect sizes being statistically insignificant, showing that exposure to more difficult problems were likely unrelated to players’ likelihood of persisting or dropping out. These suggest that the results from Section 4.5 that the salutary effects of exposure to difficult problems on short-run and long-run learning, did not come at the expense of a greater rate of player dropout.
5. Discussion
To our knowledge, this study represents the first large-scale field experiment designed to investigate the question of what makes a knapsack problem difficult for human decision-makers. Our key findings were generally consistent across the five server regions and robust to the suite of sensitivity analyses that we conducted, including the inclusion of nonlinearities. This high degree of internal consistency provides some reassurance about the validity of our findings. In addition, findings from our two-way nonlinear analyses (Figures EC.6 through EC.10) demonstrated instances with particular combination of measures that were particularly difficult for human solvers (e.g., low Sahni complexity scores and large gaps from the greedy heuristic), suggesting that interventions to aid human decision-makers in this task (e.g., an automated decision support tool) can be more critical for some instances than for others.
Contrary to our expectations, ceteris paribus, participants in this experiment performed better on randomly assigned knapsack instances deemed to be “harder” by two traditional measures of knapsack complexity. The first measure was the Pearson correlation between the value and weight vectors. High correlation instances are known to generally be harder for machines to solve (Balas and Zemel 1980; Martello and Toth 1988, 1997; Pisinger 1999, 2005). However, we found reversed results: Participants performed worse on knapsack instances with lower value-weight correlations and vice versa. Given that human-perceived difficulty on choice tasks can be categorically different from algorithm-experienced difficulty, this reversal is not entirely surprising. Additionally, differences in problem scales could also drive these differences: Past computational experiments with machines were typically performed on larger problem sizes (e.g., experiments in Pisinger (2005) range from to items), whereas we used comparatively smaller knapsacks.
The second measure was the Sahni complexity measure. Previous laboratory studies with human subjects had found that higher levels of the Sahni complexity measure resulted in poorer solution qualities (Meloso et al. 2009, Murawski and Bossaerts 2016). However, our results were again reversed: On average, participants performed better on instances with higher values of the Sahni complexity measure. Although this result ran counter to our initial expectations, this observed divergence is not entirely surprising either. As discussed in Section 3.3, as a field experiment, we had less control over the environment compared with a behavioral laboratory, which resulted in us making design choices that differed from those used by previous laboratory-based studies. The differences in study design, context, population, and methods are possible drivers of the observed divergence in our findings.
In contrast, the directional effects of three complexity measures derived from optimality gaps fell in line with our prior expectations. On average, participants performed worse on instances that were rated “harder” by these measures (larger optimality gaps). These results suggest that participants could be attempting to solve the knapsack problem with processes whose performance may be approximated by these heuristics. What is promising about this result is that the concept of an “optimality gap” can be defined for any optimization problem and is not limited to the knapsack problem. Even when a given problem is computationally intractable, optimality gaps can often be approximated through bounding arguments. Therefore, we believe that it is reasonable to extrapolate from this study and conjecture that such optimality gaps can similarly represent measures of human-perceived difficulty for discrete choice problems more generally.
Our results also revealed that participants tended to perform better with increasing number of attempts at the minigame, suggesting that participants were able to gain proficiency and improve their performance over the course of the knapsack event, even though they were presented with different instances of the problem at each attempt. The results of our secondary analyses provided evidence that the nature of problems players were exposed to in the past had implications for their performance in the future. Namely, we found evidence that players who faced more difficult problems in the past tended to perform better and that this effect persisted with future attempts.
We acknowledge that there remain gaps between our experimental setting and an actual operational context where humans may be solving knapsack-like problems (e.g., in packing operations), which may limit the translatability of our results. For instance, players in our experiment engage with the knapsack game as part of their leisure activities. Further, players in our experiment have rewards that are computed per knapsack, whereas human workers will likely be rewarded as a function of their aggregate performance. Additionally, our experiment was fully digital with a timeout mechanism, whereas in practice, workers may have a physical element to their operational processes and do not typically have a mechanistic time limit on their work. Despite these differences, we envision our key insights being applicable because ultimately, both players (in our experiment) and workers (in reality) are incentivized to perform well and quickly on their knapsack-like tasks, even though these incentives take different guises. Nevertheless, these differences mean that a definitive verification of these insights in each of these contexts can only be reached by testing them directly in an actual organization.
A unique point about our study is that it is a field experiment conducted within a “live” (currently-operating) mobile gaming platform. This setting conferred some strengths to the study but also imposed some limitations. Regarding strengths, we were able to utilize the mobile platform to have a large pool of participants contributing millions of solution attempts from across the globe. The large number of observations enabled us to use regression analysis to control for a number important factors, including features that related to player behavior both within the knapsack minigame and player characteristics in the primary game. Moreover, to our knowledge, this study represents the first attempt to investigate how people solved knapsack problems in an environment that was a natural part of their lifestyles (i.e., within their leisure activity on a game platform) as compared with a behavioral laboratory.
This paper also demonstrates that video game platforms can be a valuable outlet to conduct interesting, large-scale behavioral field experiments. Such platforms can potentially allow low-cost experimentation on large groups of players, who are already generally motivated to engage with the platform in different ways. Furthermore, players are typically conditioned to make decisions, tradeoffs, or even long-term strategies (for more complex games) on the platform through their gameplay, which would entail a gentle learning curve if they were subject to a behavioral experiment. Since the advent of mobile and casual gaming, the demographics of video gamers have also become more representative of the general population (Thompson 2013, Merikivi et al. 2017). It is not surprising, therefore, that there has been a nascent interest in performing similar types of remote behavioral experimentation using video games as a platform (Anwyl-Irvine et al. 2020, Li et al. 2021, Liu and Chen 2023). We believe that future behavioral economics research can consider such platforms and partnerships with game publishers or studios as potentially fruitful avenues for experimental work.
We conclude by discussing some limitations of this work. This study’s main limitation stems from its design as a field experiment, which entailed less control over the environment compared with a laboratory experiment. Consequently, we were unable to identify the precise behavioral mechanisms that explain participants’ choices in the minigame. We viewed this limitation as a necessary tradeoff to gain the greater scale and external validity afforded by a field experiment. The tradeoff made here is not unique to this study, reflecting the complementary roles played by field and laboratory experiments in behavioral research (see, e.g., Harrison and List 2004, Roe and Just 2009, Reiley 2015). A related limitation is that our study population comprised solely of players of this mobile game, for which we have no reliable demographic information. Therefore, we are unable to conclude that our findings would hold in a general population. Nonetheless, the size of the study population itself was very large, which gives us confidence that our findings are at least relevant for a sizeable population. Future research can investigate whether our findings can be replicated among different study populations. Finally, in this work, we did not investigate the relationship between players’ outcomes (e.g., performance or learning) and their behavior within each knapsack task (e.g., their sequence of choices to add or remove specific items); this can also be an area of future research.
6. Data Availability
The participant and knapsack solution attempt data for this study were provided by the mobile gaming company under a nondisclosure agreement (NDA) with our institution. Upon reasonable request and with the necessary nondisclosure agreements signed with NUS, the data set is available onsite at NUS for the purpose of replicating the results of this study. The remaining portion of the data set, which comprises the 100,000 knapsack instances that were randomly assigned to participants, is not subject to the NDA, and is publicly available at https://github.com/joelgoh/knapsack-difficulty.git.
7. Code Availability
The MATLAB codes used to generate the 100,000 knapsack instances and R codes used to analyze the data are publicly available at https://github.com/joelgoh/knapsack-difficulty.git.
8. Approval and Registration
Players consented to the use of anonymized gameplay data for research within the terms and conditions of the primary game. Approval for this study was granted by the Faculty Ethics Review Committee, NUS Business School (approval number BIZ-AO-21-0623) on July 1, 2021. The experiment was preregistered at the American Economic Association’s randomized controlled trial registry (RCT ID: AEARCTR-0008307).
References
- (2020) Gorilla in our midst: An online behavioral experiment builder. Behav. Res. Methods 52(1):388–407.Crossref, Google Scholar
- (2016) Recursive partitioning for heterogeneous causal effects. Proc. Natl. Acad. Sci. USA 113(27):7353–7360.Crossref, Google Scholar
- (1980) An algorithm for large zero-one knapsack problems. Oper. Res. 28(5):1130–1154.Link, Google Scholar
- (1997) An experimental analysis of the bandit problem. Econom. Theory 10(1):55–77. Crossref, Google Scholar
- (2020) Desirable difficulties in theory and practice. J. Appl. Res. Mem. Cogn. 9(4):475–479.Crossref, Google Scholar
- (1980) Hard knapsack problems. Oper. Res. 28(6):1402–1411.Link, Google Scholar
- (2021) Generic properties of a computational task predict human effort and performance. J. Math. Psych. 104:102592.Crossref, Google Scholar
- (2004) Field experiments. J. Econom. Lit. 42(4):1009–1055.Crossref, Google Scholar
- (2013) Comparing problem solving strategies for np-hard optimization problems. Fundam. Inform. 124(1–2):1–25.Crossref, Google Scholar
- (2004) Knapsack Problems (Springer, Berlin, Heidelberg).Crossref, Google Scholar
- (2017) Task decomposition and newsvendor decision making. Management Sci. 63(10):3226–3245.Link, Google Scholar
- (2021) Conducting large, repeated, multi-game economic experiments using mobile platforms. PLoS One 16(4):e0250668.Crossref, Google Scholar
- (1986) Longitudinal data analysis using generalized linear models. Biometrika 73(1):13–22.Crossref, Google Scholar
- (2023) A modularity design approach to behavioral research with immersive virtual reality: A SkyrimVR-based behavioral experimental framework. Behav. Res. Methods 55(7):3805–3819.Crossref, Google Scholar
- (2022) Connecting learning and playing: The effects of in-game cognitive supports on the development and transfer of computational thinking skills. Educational Tech. Res. Development 70(5):1867–1891.Crossref, Google Scholar
- (1996) Human performance on the traveling salesman problem. Perception Psychophysics 58(4):527–539.Crossref, Google Scholar
- (1988) A new algorithm for the 0-1 knapsack problem. Management Sci. 34(5):633–644.Link, Google Scholar
- (1997) Upper bounds and algorithms for hard 0-1 knapsack problems. Oper. Res. 45(5):768–778.Link, Google Scholar
- (1978) Variations of box plots. Amer. Statist. 32(1):12–16.Crossref, Google Scholar
- (2009) Promoting intellectual discovery: Patents versus markets. Science (1979) 323(5919):1335–1339.Google Scholar
- (2017) What makes continued mobile gaming enjoyable? Comput. Human Behav. 68:411–421.Crossref, Google Scholar
- (2016) How humans solve complex problems: The case of the knapsack problem. Sci. Rep. 6(1):1–10.Crossref, Google Scholar
- (1981)
Mechanisms of skill acquisition and the law of practice . Anderson JR, ed. Cognitive Skills and Their Acquisition, 1st ed. (Psychology Press, New York), 1–55.Google Scholar - (2022) Decision bias in project selection: Experimental evidence from the knapsack problem. Preprint, http://dx.doi.org/10.2139/ssrn.3448676.Google Scholar
- (2018) Game over for Tetris as a platform for cognitive skill training. Contemp. Ed. Psych. 54:29–41.Crossref, Google Scholar
- (1999) Core problems in knapsack algorithms. Oper. Res. 47(4):570–575.Link, Google Scholar
- (2005) Where are the hard knapsack problems? Comput. Oper. Res. 32(9):2271–2284.Crossref, Google Scholar
- (2015)
The lab and the field: Empirical and experimental economics . Fréchette GR, Schotter A, eds. Handbook of Experimental Economic Methodology (Oxford University Press, Oxford, UK), 407–419.Crossref, Google Scholar - (2009) Internal and external validity in economics research: Tradeoffs between experiments, field experiments, natural experiments, and field data. Amer. J. Agric. Econom. 91(5):1266–1271.Crossref, Google Scholar
- (2014) Observation bias: The impact of demand censoring on newsvendor level and adjustment behavior. Management Sci. 60(5):1334–1345.Link, Google Scholar
- (1975) Approximate algorithms for the 0-1 knapsack problem. J. ACM 22(1):115–124.Crossref, Google Scholar
- (2018) Human behavior in project portfolio selection: Insights from an experimental study. Decision Sci. 49(6):1061–1087.Crossref, Google Scholar
- (2000) Decision bias in the newsvendor problem with a known demand distribution: Experimental evidence. Management Sci. 46(3):404–420.Link, Google Scholar
- (1997) Sequential decision making with relative ranks: An experimental investigation of the “secretary problem”. Organ. Behav. Human Decision Process. 69(3):221–236.Crossref, Google Scholar
- (2021) Revisiting where are the hard knapsack problems? Via instance space analysis. Comput. Oper. Res. 128:105184.Crossref, Google Scholar
- (2013) SponsorPay reveals new social/mobile demographics. Adweek (February 12), https://www.adweek.com/performance-marketing/sponsorpay-reveals-socialmobile-demographics/. Google Scholar
- (2018) Estimation and inference of heterogeneous treatment effects using random forests. J. Amer. Statist. Assoc. 113(523):1228–1242.Crossref, Google Scholar