Competitive Dynamics in the Political Marketplace: How Donor Firms’ Political Wins Prompt Product-Market Peers to Appoint Politicians to Their Boards
Abstract
Using a regression discontinuity design in a sample of U.S. federal special elections, we investigate how donor firms’ political wins impact the adaptive responses of their product-market peers in their political activities, with a particular focus on the appointment of politicians to their boardrooms. By analyzing closely contested special elections, we find that when donor firms had donated to a candidate who narrowly won a special election, their peer firms were 41% more likely to appoint politicians to their boards in the following year than peers of the donor firms that had supported a narrowly defeated candidate. This adaptive response is more pronounced among peer firms facing greater political risks and operating in industries with more intense competition for government sales. Donor firms’ political wins also lead peer firms to increase their product differentiation from those donor firms. We interpret these patterns as evidence of a competitive-dynamics mechanism, where peer firms perceive donor firms’ political wins as a threat that could disadvantage them in the regulatory environment, prompting them to strengthen their boards with political capital to navigate potential regulatory changes and mitigate perceived risks. Our findings enrich scholarly understandings of corporate political activities and director selections.
This paper was accepted by Olav Sorenson, organizations.
Funding: Z. Wu acknowledges support from the National Social Science Foundation of China [Grant 22&ZD154].
Supplemental Material: The online appendix and data files are available at https://doi.org/10.1287/mnsc.2023.02952.
1. Introduction
Political donations form a cornerstone of corporate political activities. Firms make campaign contributions to sway political candidates and thereby influence the regulatory environment in their own favor (Fremeth et al. 2016). When these supported candidates succeed in gaining office, the donor firms often secure a wide range of strategic advantages. These benefits include gaining policy-relevant information (Schnakenberg and Turner 2020), securing more government contracts (Boas et al. 2014), receiving favorable treatment during merger reviews (Holburn and Vanden Bergh 2013), and obtaining easier access to finance (Claessens et al. 2008). Together, these benefits often elevate firm performance (Cooper et al. 2010, Akey 2015) by enabling firms to navigate regulatory challenges more effectively (Heitz et al. 2023).
Despite extensive research, there has been little exploration of the competitive implications of electoral success within the corporate landscape, particularly how the victory of candidates backed by donor firms influences the adaptation of political activities among the donors’ product-market peers. This oversight is critical because the competitive advantages secured through electoral victories can disadvantage product-market peers in regulatory environments and therefore erode their market standing, compelling them to engage in adaptive political activities to mitigate competitive threats and protect their market positions. Despite their potential importance, these competitive dynamics remain an intriguing yet underexplored area in research on corporate political activities.
Our study seeks to bridge this gap by abductively investigating whether and how the electoral victories of candidates backed by donor firms might trigger adaptive political activities among those firms’ product-market peers. Research has suggested that competing firms are often highly attentive to each other’s behavior and the consequences of each other’s actions (McMullen et al. 2009) because they face similar external environments (Shi et al. 2017), and a strategic success by a firm often generates consequences that can ripple through to its product-market peers (Connelly et al. 2020). Anecdotal evidence also suggests that this attentiveness extends to the realm of political engagement. For instance, tech giants such as Google and Microsoft frequently escalate their lobbying efforts and campaign contributions in response to their rivals’ political maneuvers, particularly on issues related to privacy and antitrust (Kruppa and Dotan 2023). Similarly, automakers often lobby against each other to fight over legislation on electric vehicles (Evers-Hillstrom 2021). These examples illustrate that product-market peers are often highly attentive to each other’s political activities.
The empirical examination of how product-market peers adapt their political activities in response to the electoral victories of candidates backed by donor firms poses nontrivial challenges because endogeneity issues might prevent a causal interpretation of the result that donor firms’ political wins are associated with their peer firms’ adaptation of their political activities. For example, unobserved characteristics of political environments (e.g., strong government control over the market economy) might be the true determinant of both donor and peer firms’ political activities.
We address this challenge by employing a regression discontinuity design (RDD) that isolates relatively exogenous changes in donor firms’ political wins. We consider a firm as a donor firm if its political action committee (PAC) donates to a political candidate, and we define a political win as a candidate backed by the donor firm winning an election. We focus our analyses on closely contested elections in which a candidate’s margin of victory (MoV) is less than 5% around the 50% cutoff point (i.e., respective vote shares of 45%–55%). Because politicians and donor firms cannot precisely control the voting results near the known cutoff point (Lee and Lemieux 2010), there is a meaningful component of randomness in the outcome of these closely contested elections (Lee 2008). That is, the possibility of a candidate narrowly winning or narrowly losing a closely contested election is as good as random (Babenko et al. 2023). Thus, the victory or failure of a closely contested election allows us to identify a quasi-random change in a donor firm’s political wins that can be used to estimate the causal effect on the political behavior adaptations of its product-market peers.
Regarding product-market peers’ adaptation of political activities, our research focuses specifically on peers’ appointment of politicians to their boards as a strategic response to the political wins of donor firms. Although increasing political donations to (or lobbying) the newly elected congresspersons who have formed ties with donor firms may seem like an immediate and direct countermeasure, this strategy has two drawbacks. First, by the time congresspersons are elected, their policy agendas and alliances are generally already established (Baron 2006), making it challenging for late donors (and lobbyists) to exert influence on a par with that of early supporters.1 Second, escalating postelection donations could be perceived as buying influence, risking ethical backlash in a vigilant political climate. In contrast, appointing politicians to board positions offers a more effective and less controversial strategy for product-market peers. It is important to note that appointments of the newly elected congresspersons into corporate boardrooms are unlikely because such appointments are generally prohibited by the government to prevent conflicts of interest and maintain the integrity of the congresspersons’ public service roles. Thus, appointing politicians other than the newly elected congresspersons to board positions can be an effective and strategic “next best” adaptation in response to donor firms’ political wins because such an adaption provides them with immediate access to political capital, helping to mitigate the competitive threats posed by donor firms in regulatory environments and thus protect their market standings.
By empirically analyzing a sample of U.S. public firms throughout 1990–2020, we find supportive evidence for competitive dynamics in corporate political activities. Specifically, donor firms’ political wins prompt their product-market peers to appoint politicians to their boardrooms. Additionally, we observe that political wins provide strategic benefits to donor firms, as evidenced by increased government sales, greater analyst coverage, and growth in size and revenue; benefits that are absent when the candidates they supported lose elections. For product-market peers, these advantages represent competitive threats in the business environment, thereby triggering adaptations in their own political activities.
We next delve deeper into the underlying mechanisms, focusing our investigation on three main areas. First, we explore the heterogeneous effects of the adaptive responses identified earlier. If competitive dynamics act as an operating mechanism, we expect to observe a more pronounced response from product-market peers facing greater political risks and operating in industries with more intense competition for government sales. Second, the competitive-dynamics mechanism suggests that peer firms’ adaptive responses can be multidimensional and may include various market actions aimed at mitigating these perceived threats. A typical strategy might involve product differentiation, intended to lessen direct competition with donor firms that have just secured political wins. Third, if competitive dynamics underlie our main findings, then we would expect that peer firms’ appointments of politicians to their boards would potentially mitigate the strategic benefits gained by donor firms, thereby leveling the competitive playing field. Our empirical analyses provide support for all of these three conjectures, suggesting the plausibility of competitive dynamics (Chen 1996) as a mechanism to explain our findings.
Two alternative explanations may account for our findings. First, our results could reflect mimetic isomorphism (DiMaggio and Powell 1983), where donor firms’ political wins trigger mimetic adaptation in political activities among product-market peers. This mimicry might occur because donor firms’ political wins may signal emerging opportunities within the political marketplace, thereby reducing uncertainty for peer firms contemplating entry into this marketplace. We empirically test the plausibility of such mimetic responses. Considering that not all peer firms in our sample maintain PACs, we would expect that observing successful PAC engagement by donor firms could motivate peer firms to establish their own PACs. Nonetheless, our empirical analyses do not find evidence supporting this prediction, suggesting that mimetic isomorphism may not be a primary driver of the interfirm dynamics we observe.
A second potential explanation involves governance pressures (Aguilera et al. 2015), where financial analysts and institutional investors may push firms toward engaging in corporate political activities. We assess this by using the numbers of common analysts and institutional investors between peer and donor firms as moderators. If governance pressures are influencing peer firms’ adaptive responses, then we would expect a positive moderation effect from these common entities. However, our findings show no such evidence, indicating that governance pressures are unlikely to drive our findings.
The findings of this research make two contributions to the literature. First, our study extends the literature on corporate political activities by revealing broader implications of donor firms’ political wins. Extant research in this area has traditionally focused on the direct impacts of political wins on donor firms themselves (see, e.g., Claessens et al. 2008, Holburn and Vanden Bergh 2013, Boas et al. 2014, Akey 2015, Heitz et al. 2023). We broaden this focus by investigating whether and how donor firms’ political wins may create a ripple effect on the adaptation of political activities among donor firms’ product-market peers. Our findings shed light on the potential mechanism through which such a ripple effect occurs, suggesting a competitive-dynamics mechanism underlying corporate political activities, which to date has received less attention.2 That is, donor firms’ political wins may increase the competitive threats perceived by their product-market peers, prompting them to adapt their political activities to better navigate the potential shifts in the regulatory landscape that favor the donor firms. By exploring these aspects, we heed the call of Hillman et al. (2004, p. 851) to use the “literature on competitive dynamics … as [a] guidance and application to the political market” to advance our understanding of corporate political activities.
Second, this study contributes to the literature on director selection. The extant literature usually explains the determinants of director appointments from either a resource dependence or an agency perspective by focusing on firms’ internal needs and situational characteristics (Withers et al. 2012). Our work extends the scope of this literature by introducing a vital yet previously understudied dimension to this phenomenon: the impact of interfirm rivalry in the political landscape on director selections. Our research reveals how observations of donor firms’ political wins can shape product-market peers’ decisions to appoint politicians to their boards to navigate potential shifts in the political landscape that favor donor firms. This perspective broadens the lens through which director selection is viewed and highlights the strategic importance of interfirm rivalry in the political landscape. It enriches our understanding of how firms adapt their governance practices to co-opt their regulatory environment.
2. Empirical Context
2.1. Corporate Political Donations
In the United States, firms are restricted from using their funds to make direct contributions to federal candidates or national political parties, a regulation intended to prevent undue influence over democratic processes (Staats 1976). To circumvent these restrictions, firms often establish political action committees (PACs). These PACs collect voluntary contributions from executives, shareholders, and employees, channeling these funds into political campaigns (Burris 1987). As of November 2024, there were 1,669 registered corporate PACs in the United States.3
Through PAC donations, firms strategically support candidates who may favorably influence their regulatory environments and economic activities (Heitz et al. 2023). For instance, soon after taking office in 2017, President Donald Trump revived the construction of the controversial Dakota Access Pipeline, a project previously rejected by President Barack Obama (Baker and Davenport 2017). Energy Transfer Partners, the firm behind this project, had contributed to Trump’s election campaign (Hampton and Volcovici 2016). This policy reversal exemplifies how elected officials can significantly alter the regulatory landscape to the benefit of their donors. An another example, Boas et al. (2014) reported that corporate donors often reap a significant increase in government contracts following the electoral victory of their supported candidates, estimating returns between 14 and 39 times the value of their contributions. This anecdotal and research evidence underscores the potential benefits of corporate political donations.
Recognizing these potential benefits, firms have made substantial investments in PAC donations. For example, data from the U.S. Federal Election Commission show that in 2023, corporate PACs contributed $75.8 million, which represents 36.8% of all donations from various types of PACs.4 Although corporate PAC donations are essential for enhancing the competitiveness of preferred candidates, they do not guarantee electoral success (Mayer 2016). Political contests are inherently unpredictable, and despite substantial financial investments, there is no assurance that supported candidates will secure office (Akey 2015). A notable example is Donald Trump’s 2016 election victory, where he overcame several well-financed opponents during the primaries and general election, underscoring the uncertainty of electoral outcomes. When favored candidates lose, the anticipated influence on policy and regulation never materializes, rendering the financial contributions ineffective. Consequently, relying solely on political donations is often a risky strategy for firms aiming to influence their regulatory environment and safeguard their interests.
2.2. Politicians on Corporate Boards
In response to the uncertainties associated with the electoral outcomes of corporate political donations, a growing number of firms are opting for a more reliable and strategic approach: appointing politicians to their boards.5 We follow Hillman (2005) and define politicians in the boardroom as corporate directors who have work experience in the government sector. According to BoardEx, a global data company specializing in corporate board members, the number of U.S. firms with politicians on the board was around 190 in 1990, increasing by more than 600% to 1,225 in 2023.
Appointing politicians to the board provides firms with direct access to individuals who possess an in-depth understanding of regulatory and legislative processes (Hillman 2005). Once on the board, these experienced politicians often assume responsibilities related to managing political risks, such as advising on government relations strategies, adapting to new regulations, and guiding the firm through complex regulatory challenges. Their expertise and networks allow for a more informed approach to navigating the regulatory landscape (Goldman et al. 2009).
By integrating political acumen into their boardrooms, firms can plot a clearer course through their regulatory environment, enhancing their standing within the broader political and economic spheres (Goldman et al. 2013). This strategic employment of human capital enables firms to transform the uncertainties of the political environment into opportunities, leveraging the deep legislative and regulatory expertise of seasoned political operators to secure a competitive advantage (Palmer and Schneer 2016). Through this approach, firms are better positioned to navigate regulatory changes, either by influencing the emergence of new regulatory frameworks or by mitigating potential adverse effects from regulatory developments.
3. Empirical Design
3.1. Sample and Data
In the United States, political elections are broadly categorized into two types: general elections, which are scheduled regularly, and special elections, which are convened unexpectedly to fill vacancies arising from an officeholder’s death, resignation, or incapacity (Akey 2015). Our research specifically examines special elections,6 because they offer a more empirically robust framework for studying the competitive dynamics in corporate political activities, for three reasons.
First, unlike general elections, which occur on a fixed schedule, special elections arise unexpectedly. This unpredictability makes special elections particularly valuable for our research. Firms typically plan their political strategies well in advance of general elections, guided by regular schedules and extensive polling data (Smith 2000). In contrast, the sudden occurrence of special elections does not allow firms the same level of preparation. This reduces the likelihood of anticipatory behaviors, thus serving as a more quasi-experimental setting to observe the impact of electoral outcomes without the confounding effect of premeditated firm actions.
Second, general elections often coincide with broader economic shifts or major policy changes (Hassan et al. 2019), which can independently affect firms’ motivations to engage in political activities, thereby muddying causal interpretations. Special elections, however, are usually isolated events that do not align with other significant political or economic changes. This isolation allows us to more accurately isolate changes in donor firms’ political advantages (over their product-market peers) that result specifically from the outcomes of the special elections, thereby enhancing the clarity of causal analysis.
Third, the candidates in special elections are often less established in the political landscape, including many who are first-time challengers with few preexisting connections to firms. This contrasts with general elections, which are typically characterized by incumbents who have well-established relationships with businesses (see, e.g., Markgraf and Rosas 2019). This distinction is crucial because it minimizes the confounding effect of longstanding relationships and allows a clearer assessment of how donor firms’ new connections with elected officials influence peer firms’ political behavior. Additionally, the incumbency effect observed in general elections (Lee 2008), which increases both the share of donations to incumbents and their likelihood of victory, tends to skew the sample. This skewness introduces a bias that disproportionately favors established connections with incumbents over emerging ones with challengers. Focusing on special elections helps circumvent such biases and the associated sample skewing, providing a more empirically robust setting for our research inquiry.
Given these benefits, we believe that special elections offer a cleaner research setting than general elections for causally identifying and analyzing how donor firms’ political wins impact their product-market peers’ adaptive appointment of politicians to their boards. Within special elections, we focus on closely contested elections, which are defined as electoral contests where the margin of victory between the winning and losing candidates is narrow, indicating a high level of competitiveness; we define closely contested special elections as those with a margin of victory of less than 5% around the 50% cutoff point. In such elections, the outcome is often unpredictable, and even small shifts in voter preferences or turnout can significantly impact the results, with each vote carrying significant weight.
We obtain data on U.S. federal special elections from the MIT Election Data Laboratory,7 covering the period from 1990 to 2020. This yields a sample of 151 special elections, including both House and Senate elections. Within this sample, 29 elections are identified as closely contested. The relative unpredictability of special elections compared with general elections is evident in our data; 19.2% (29 out of 151) of special elections are closely contested, whereas only 8.6% (603 out of 7,048) of general elections fall into this category.
We acquire records of firm donations from the U.S. Federal Election Commission (FEC),8 which keeps records of donations to both winning candidates and their opponents. To identify which firms’ PACs made donations to these candidates, we follow Correia (2014) and match the organization name from the FEC’s donation data with the company name from Compustat. After merging these data sets, we end up with 15 closely contested elections (i.e., 30 candidates in total) where we could link corporate PAC donations from firms covered by Compustat. The details of these 15 closely contested elections are provided in Table 1. Notably, seven of the selected elections featured candidates with no prior political experience. Some years featured only one closely contested special election, whereas others saw multiple such elections occur within the same year. Additionally, in six of these elections, the winning candidate came from the same political party as their predecessor.
|

Table 1. A List of Closely Contested Special Elections from 1990 to 2020
| Office | No | Candidate | Date | State | Vote % | Candidate party | First-time politician | Predecessor party |
|---|---|---|---|---|---|---|---|---|
| H | 1 | Frank Lucas | May 10, 1994 | OK | 0.542 | REP | 0 | DEM |
| H | 1 | Dan Webber | May 10, 1994 | OK | 0.459 | DEM | ||
| H | 2 | Stephanie Herseth | July 12, 2004 | SD | 0.506 | DEM | 1 | REP |
| H | 2 | Larry Diedrich | July 12, 2004 | SD | 0.494 | REP | ||
| H | 3 | Ciro Rodriguez | December 12, 2006 | TX | 0.543 | DEM | 0 | REP |
| H | 3 | Henry Bonilla | December 12, 2006 | TX | 0.457 | REP | ||
| H | 4 | Bill Foster | March 8, 2008 | IL | 0.525 | DEM | 1 | REP |
| H | 4 | Jim Oberweis | March 8, 2008 | IL | 0.475 | REP | ||
| H | 5 | Travis Childers | May 13, 2008 | MS | 0.538 | DEM | 0 | REP |
| H | 5 | Greg Davis | May 13, 2008 | MS | 0.462 | REP | ||
| H | 6 | Ron Barber | June 12, 2012 | AZ | 0.523 | DEM | 1 | DEM |
| H | 6 | Jesse Kelly | June 12, 2012 | AZ | 0.454 | REP | ||
| H | 7 | Debbie Lesko | April 24, 2018 | AZ | 0.524 | REP | 0 | REP |
| H | 7 | Hiral Tipirneni | April 24, 2018 | AZ | 0.476 | DEM | ||
| H | 8 | Troy Balderson | August 7, 2018 | OH | 0.501 | REP | 0 | REP |
| H | 8 | Danny O’Connor | August 7, 2018 | OH | 0.493 | DEM | ||
| H | 9 | Mary Gay Scanlon | November 6, 2018 | PA | 0.523 | DEM | 1 | REP |
| H | 9 | Pearl Kim | November 6, 2018 | PA | 0.460 | REP | ||
| H | 10 | Mike Garcia | May 12, 2020 | CA | 0.549 | REP | 1 | DEM |
| H | 10 | Christy Smith | May 12, 2020 | CA | 0.451 | DEM | ||
| S | 11 | Dan Coats | November 6, 1990 | IN | 0.537 | REP | 0 | REP |
| S | 11 | Baron Hill | November 6, 1990 | IN | 0.463 | DEM | ||
| S | 12 | Roger Wicker | November 4, 2008 | MS | 0.550 | REP | 0 | REP |
| S | 12 | Ronnie Musgrove | November 4, 2008 | MS | 0.450 | DEM | ||
| S | 13 | Scott Brown | January 19, 2010 | MA | 0.519 | REP | 0 | DEM |
| S | 13 | Martha Coakley | January 19, 2010 | MA | 0.471 | DEM | ||
| S | 14 | Cindy Hyde-Smith | November 27, 2018 | MS | 0.536 | REP | 1 | REP |
| S | 14 | Mike Espy | November 27, 2018 | MS | 0.464 | DEM | ||
| S | 15 | Mark Kelly | November 3, 2020 | AZ | 0.512 | DEM | 1 | REP |
| S | 15 | Martha McSally | November 3, 2020 | AZ | 0.488 | REP |
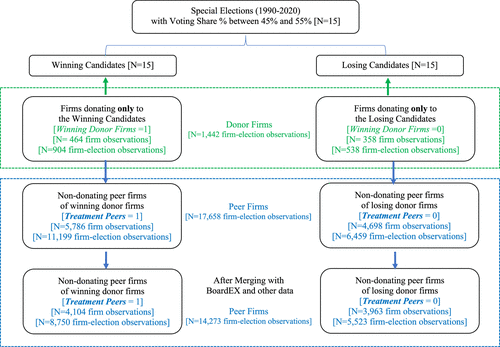
Following prior research (see, e.g., Akey 2015), we exclude firm-election observations where the donor firms donated to both the winning and the losing candidates in a single campaign. This exclusion is based on the premise that firms contributing to both sides were likely hedging against the election outcome (Christensen et al. 2022), ensuring a connection to the eventual winner. Because hedging donor firms can be categorized as either winning or losing, they will have ambiguous treatment status, and this ambiguity will lead to further complications in identifying their peer firms, which will also have ambiguous treatment status for the same reason. Thus, for clearer causal inference, we follow Akey (2015) and remove hedging donor firms from our causal analysis. After this exclusion, our data set comprises 464 firms that donated exclusively to the winning candidates and 358 that contributed exclusively to the losing candidates.
To identify product-market peers of the donor firms, we follow prior research (Shi et al. 2017, Connelly et al. 2020) and use Hoberg-Phillips Text-based Network Industry Classification (hereafter: “Hoberg-Phillips classification”).9 Technically speaking, Hoberg and Phillips (2016) employed computer-aided text analysis of firms’ product descriptions in SEC 10-K filings10 to determine product similarity between pairs of firms and thereby estimate their relative competitiveness. The level of competitiveness between two firms is computed by using the cosine similarity between the word vectors of their product descriptions (including only nouns and excluding very common words). The resulting similarity scores range from 0 to 1. A higher score indicates a greater level of similarity, and firm pairs with a higher score are closer rivals. The average similarity score in our sample is 0.038, similar to prior research (Shi et al. 2017). As Hoberg and Phillips (2016) explained in their technical notes,11 “the [similarity] score […] indicates the amount by which the pairwise score exceeded the similarity threshold for being included in the TNIC database. Hence, the distribution of the score variable has a lower end that starts near zero. A score near zero means that the firm just exceeded the minimum similarity threshold needed to be included in the database.”
We use firm pairs in Hoberg and Phillips’s (2016) data12 to identify the nondonating peers of the donor firms.13 Nondonating peers are defined as firms that made no donations to either of the two candidates involved in the elections in which the focal donor firms participated. Excluding donating peers is crucial for two main reasons. First, donating peers are also donor firms, meaning they could qualify for inclusion in the donor firm sample. This overlap would lead to duplication between the peer firm and donor firm samples. Second, donating peers may appoint politicians as directors because of incentives aimed at compensating for their failures to secure political wins, rather than because of the competitive dynamics we aim to investigate. This confounds our analysis, adding empirical noise and making it difficult to isolate the true causes of firms’ appointment decisions. By focusing exclusively on nondonating peers, we can avoid these issues and provide a cleaner setting for our research inquiry. Nondonating peers observed donor firms’ political wins without being directly involved in the associated elections. This means that their responses to donor firms’ political wins are driven purely by the electoral outcomes, eliminating other potential incentives related to their own political activities.
Based on the 464 winning donor firms and 358 losing donor firms, we identify 5,786 nondonating peer firms associated with winning donor firms and 4,698 associated with losing donor firms, yielding a sample of 17,658 firm-election observations of nondonating peer firms. We use these data to further match with politician-directors and other data that we will use to measure our dependent and control variables, including director data from BoardEx, firm-level accounting data from Compustat, government sales data from Compustat Historical Segments, firm-level political risk data from Hassan et al. (2019), analysts following data from IBES, and institutional ownership data from Thomson/Refinitiv. After merging all these data sets, our sample for observing peer responses consists of 14,273 firm-year observations.
3.2. Variables
3.2.1. Dependent Variables.
Our main dependent variable is Number of Politicians Appointed, measured as the count of politicians appointed by peer firms within one year following the closely contested special elections. As a robustness check, we create a dummy variable (Dummy of Politicians Appointed) to investigate peer firms’ probability of appointing politicians. Using the Company and Organizational Networks data set in BoardEx, we obtain information for all firms whose directors are connected to other organizations from January 1990 to December 2021.14 We classify directors connected to “Government” as politicians and use the overlap start year variable (OverlapYearStart) in the data set as the appointment year of these politicians. Next, at the firm-election level, we count the number of newly appointed politicians in the following year as our dependent variable and merge the data with our peer-firm data, yielding a total of 485 appointments during our sample period. Among these appointments, 85% of the appointed politicians have legislative expertise.
3.2.2. Independent Variable.
Our independent variable, Treatment Peers, is an indicator variable coded as 1 for nondonating peers of the winning donor firms and 0 for nondonating peers of the losing donor firms. Winning (Losing) Donor Firms are defined as firms that contributed to candidates who just won (lost) the special election with a small margin of victory (MoV ≤ 5%) near the 50% cutoff point. We then identify nondonating peers of these donor firms, based on the Hoberg-Phillips classification (Hoberg and Phillips 2016). This leaves us with 4,104 peer firms in the treatment group and 3,963 peer firms in the control group. Figure 1 shows the logical connections among the various types of firms.
3.2.3. Control Variables.
We control for several governance-, firm-, and industry-level factors that might influence our proposed relationships. Because turnover rates are an important predictor of director hiring (Garg et al. 2018), we control for Annual Board Turnover, measured as the overall turnover rate in the boardroom in the election year t. Given that firm size may influence both firms’ political activities and their director-appointment decisions (Busenbark et al. 2023), we include the logarithm of the number of employees (Log(Employees)). Because leverage can affect a firm’s monetary ability to appoint new directors (Di Giuli and Kostovetsky 2014, Zorn et al. 2019), we control for the ratio of total debt-to-equity (Leverage). Firm performance is documented to be an important predictor of board appointment decisions (Di Giuli and Kostovetsky 2014, Garg et al. 2018, Zorn et al. 2019), and we control for return on equity (Profitability). To control for the effect of industry dynamics on firm behaviors, we incorporate Industry Competition (HHI), represented by the Herfindahl-Hirschman Index, which is calculated as the sum of the squared market share (based on sales) for each firm in the industry. All continuous variables are winsorized at the 1st and 99th percentiles.
3.3. Identification Strategy
We employ a regression discontinuity framework to estimate the causal effect of donor firms’ political wins on peer firms’ adaptive appointment of politicians to their boards. We identify a quasi-random variation in donor firms’ political wins by focusing on closely contested elections, in which candidates either won or lost by a margin of less than 5% around the 50% majority vote threshold. We then leverage this quasi-random variation to assess its causal impact on peer firms’ board appointments.
Given the quasi-random variation, a difference-in-means estimator may seem sufficient for our empirical tests by comparing the outcome differences in board appointments of politicians between treatment and control peer groups. However, such a simple t-test may compare treatment peers in one election (industry) with control peers in another election (industry). To improve estimation precision, we use local linear regressions by controlling for election and industry fixed effects. We use the following specification to implement the RDD:
3.4. Diagnostic Tests for a Quasi-Randomized Assignment
Our identification strategy assumes that the electoral outcomes of candidates who narrowly won or lost closely contested special elections are quasi-random assignments to their donor firms. This assumption, akin to randomization in experimental studies, has specific testable implications. We follow Cunningham (2021) and conduct two diagnostic tests to validate this assumption.
3.4.1. Continuity in the Distribution of Political Votes.
A crucial assumption of RDD-based studies of corporate political donations is that neither politicians nor donor firms can precisely manipulate the forcing variable (i.e., the number of votes) near the known threshold (Boas et al. 2014, Akey 2015, Heitz et al. 2023). When this assumption holds, variation in donor firms’ political wins is akin to that of a randomized experiment.
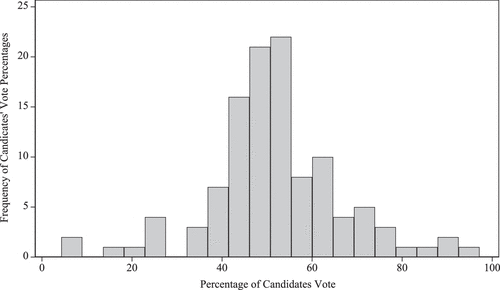
Despite theoretical clarity that this assumption is satisfied, we conduct two diagnostic tests for empirical evidence. First, we present the histogram of donor-firm distribution around the 50% majority vote threshold. Systematic sorting of donor firms near the cutoff would create a discontinuity in the vote share distribution at the threshold. Figure 2 shows a histogram of voting outcomes in our sample across 20 equally spaced vote-share bins (with a bin width of 5%), indicating a continuous vote-share distribution near the threshold with no signs of precise manipulation.
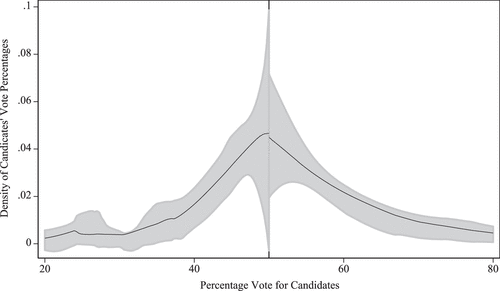
Second, we follow McCrary (2008) and formally test the continuity of the density of observations at the threshold. Figure 3 plots the density of vote shares, with the x-axis representing the percentage of votes favoring the candidates who are financially supported by donor firms. The solid line indicates the fitted density function of the forcing variable, with a 95% confidence interval around it. The density curve does not indicate discontinuity near the 50% majority vote threshold. The discontinuity estimate is −0.08 with a p-value of 0.94, meaning that we cannot reject the null hypothesis that the density difference at the threshold is 0. This validates our assumption that donor firms do not appear to manipulate the vote shares near the threshold.
3.4.2. Pre-Election Differences in Firm Characteristics Near the Threshold.
Another key assumption of RDD in our context is that pre-election firm characteristics just above and below the 50% majority vote threshold should be comparable. That is, if the outcomes of closely contested special elections are as-if random, then these outcomes should be orthogonal to ex ante firm attributes. We compare the characteristics of donor firms involved in elections that fall within the narrow (45%, 55%) vote-share band around the 50% majority vote threshold as well as the characteristics of peer firms associated with these donor firms. The firm characteristics that we consider include the dependent variable and all the control variables in our main regressions.
Table 2 reports the results. In panel A, we focus on donor firms that provided campaign contributions to politicians who narrowly won or lost. Panel B examines peer firms associated with these donor firms. In each panel, we test whether the mean pre-election attributes differ significantly between treatment and control groups.15 Across both panels, none of the pre-election attributes show a significant difference between treatment and control groups, indicating no discontinuity in pre-election firm characteristics at the majority threshold. These findings suggest that assignments based on closely contested elections are effectively random, affirming the appropriateness of the RDD approach for identifying the competitive implications of donor firms’ political wins for the adaptation of their product-market peers’ political activities.
|
Table 2. Tests for Quasi-Randomized Assignments
| Panel A: Tests for quasi-randomized assignments between winning and losing donor firms | ||||||
|---|---|---|---|---|---|---|
| Variables | Winning donor firms | Losing donor firms | Winning vs. losing donor firms t-test | |||
| Mean | SD | Mean | SD | Mean diff | p-value | |
| Number of politicians appointed | 0.11 | 0.37 | 0.10 | 0.33 | 0.01 | 0.58 |
| Annual board turnover | 0.90 | 0.83 | 0.95 | 0.84 | −0.06 | 0.34 |
| Log(employees) | 3.32 | 1.24 | 3.24 | 1.25 | 0.09 | 0.32 |
| Leverage | 0.28 | 0.19 | 0.28 | 0.19 | 0.01 | 0.66 |
| Profitability | 0.19 | 0.84 | 0.23 | 1.07 | −0.04 | 0.55 |
| Industry competition (HHI) | 0.08 | 0.08 | 0.08 | 0.07 | 0.01 | 0.32 |
| Panel B: Tests for quasi-randomized assignments between treatment and control peer firms | ||||||
|---|---|---|---|---|---|---|
| Variables | Treatment peer firms | Control peer firms | Treatment vs. control peer firms t-test | |||
| Mean | SD | Mean | SD | Mean diff | p-value | |
| Number of politicians appointed | 0.04 | 0.20 | 0.04 | 0.21 | 0.00 | 0.64 |
| Annual board turnover | 0.43 | 0.58 | 0.43 | 0.56 | 0.00 | 0.83 |
| Log(employees) | 1.14 | 1.23 | 1.11 | 1.19 | 0.03 | 0.18 |
| Leverage | 0.24 | 0.29 | 0.23 | 0.26 | 0.01 | 0.24 |
| Profitability | −0.06 | 1.18 | −0.05 | 1.07 | −0.01 | 0.61 |
| Industry competition (HHI) | 0.06 | 0.06 | 0.06 | 0.06 | 0.00 | 0.21 |
4. Findings
4.1. Graphical Analysis
We first present regression discontinuity plots in Figure 4 to visually check the relationship of interest around the majority cutoff. The x-axis shows the percentage of votes supporting candidates who are financially supported by donor firms. The y-axis represents the adjusted number of politicians appointed to peer firms’ boardrooms. This adjustment considers industry and election fixed effects, calculated as the residuals from a linear regression on these fixed effects. The dots (on either side of the cutoff point) indicate the mean adjusted number of appointed politicians across 10 evenly spaced bins. The solid line represents the fitted global quadratic polynomial estimate.
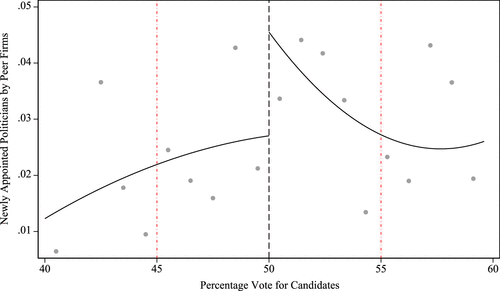
The plot reveals a discontinuity in peer firms’ adaptive appointment of politicians at the threshold in the year following elections. Specifically, near this threshold, on average, the number of politicians appointed to peer firms’ boardrooms rises significantly when the percentage of votes favoring candidates financially supported by donor firms surpasses the 50% majority vote threshold. This observation suggests a likely positive impact of donor firms’ political wins on the adaptive appointment of politicians to peer firms’ boards.
4.2. Regression Discontinuity Design Results
We refine the sample to include candidates who narrowly won or lost their elections by a 5% margin around the 50% majority vote threshold. Table 3 shows the descriptive statistics and correlations.
|
Table 3. Descriptive Statistics and Correlations
| Variables | Mean | St.Dev | 1 | 2 | 3 | 4 | 5 | 6 | |
|---|---|---|---|---|---|---|---|---|---|
| 1 | Number of politicians appointed | 0.034 | 0.197 | ||||||
| 2 | Annual board turnover | 0.469 | 0.589 | 0.11 | |||||
| 3 | Log(employees) | 1.148 | 1.215 | 0.07 | 0.24 | ||||
| 4 | Leverage | 0.261 | 0.313 | 0.01 | 0.04 | 0.08 | |||
| 5 | Profitability | −0.082 | 1.279 | 0.01 | −0.01 | 0.10 | 0.07 | ||
| 6 | Industry competition (HHI) | 0.059 | 0.065 | −0.02 | −0.03 | 0.27 | 0.08 | 0.04 | |
| 7 | Treatment peers | 0.613 | 0.487 | 0.02 | 0.01 | 0.03 | 0.03 | −0.01 | −0.01 |
Note. N = 14,273.
We start our analysis with a difference-in-means test. The results of the t-test indicate that treatment peers are more likely to appoint politicians than control peers (p = 0.029) in the year following the elections. Although this result is informative, its empirical precision is limited because of the comparison across different elections and industries.
To enhance the precision of our estimates, we employ local linear regressions to estimate Equation (1), where we control for election and industry fixed effects. Table 4 presents the regression results. To minimize collider bias from “bad controls,” we begin with regressions that exclude control variables. In Model 1, the univariate regression results (without control variables) in column 1 of Table 4 reveal that the estimated coefficient β on Treatment Peers is 0.014 (p = 0.027). Economically speaking, each political win leads to an increase of 1.4 politicians appointed by every 100 peers. This effect size might seem small in absolute terms, but it is significant considering the low baseline rate of such appointments, which is only 0.034. In relative terms, each political win results in a 41% increase in the appointment of politicians by peer firms.16 This finding remains robust after control variables are added (Model 2).
|
Table 4. Political Wins and Peer Firms’ Appointment of Politicians
| Dependent variable | Number of politicians appointed | |||||||||
|---|---|---|---|---|---|---|---|---|---|---|
| MoV (5%) Vote % (45%–55%) | MoV (1%) Vote % (49%–51%) | MoV (3%) Vote % (47%–53%) | MoV (7%) Vote % (43%–57%) | MoV (10%) Vote % (40%–60%) | ||||||
| (1) | (2) | (3) | (4) | (5) | (6) | (7) | (8) | (9) | (10) | |
| Treatment peers | 0.014* | 0.014* | 0.029 | 0.032 | 0.022* | 0.021* | 0.009+ | 0.010+ | 0.005 | 0.005 |
| (0.006) | (0.006) | (0.022) | (0.022) | (0.010) | (0.010) | (0.005) | (0.005) | (0.005) | (0.005) | |
| Annual board turnover | 0.027*** | 0.018+ | 0.024*** | 0.029*** | 0.030*** | |||||
| (0.006) | (0.010) | (0.007) | (0.005) | (0.005) | ||||||
| Log(employees) | 0.011*** | 0.008* | 0.013** | 0.010*** | 0.011*** | |||||
| (0.003) | (0.004) | (0.004) | (0.003) | (0.002) | ||||||
| Leverage | −0.008 | 0.020 | 0.006 | −0.006 | −0.006 | |||||
| (0.006) | (0.020) | (0.010) | (0.006) | (0.006) | ||||||
| Profitability | 0.001 | 0.002 | 0.001 | 0.001 | 0.000 | |||||
| (0.002) | (0.004) | (0.002) | (0.002) | (0.001) | ||||||
| Industry competition (HHI) | 0.012 | −0.173 | −0.085 | 0.004 | −0.010 | |||||
| (0.085) | (0.136) | (0.138) | (0.062) | (0.057) | ||||||
| Constant | 0.026*** | 0.001 | 0.009 | −0.008 | 0.025*** | 0.003 | 0.023*** | 0.001 | 0.027*** | 0.004 |
| (0.004) | (0.007) | (0.013) | (0.020) | (0.006) | (0.011) | (0.004) | (0.006) | (0.004) | (0.005) | |
| Election F.E. | Yes | Yes | Yes | Yes | Yes | Yes | Yes | Yes | Yes | Yes |
| Industry F.E. | Yes | Yes | Yes | Yes | Yes | Yes | Yes | Yes | Yes | Yes |
| Observations | 14,273 | 14,273 | 1,329 | 1,329 | 5,698 | 5,698 | 17,955 | 17,955 | 20,837 | 20,837 |
| Adj-R2 | 0.006 | 0.017 | −0.007 | 0.0004 | 0.003 | 0.013 | 0.007 | 0.020 | 0.007 | 0.022 |
Note. Robust standard errors in parentheses.
+p < 0.1; *p < 0.05; **p < 0.01; ***p < 0.001.
To assess the sensitivity of our RDD results to different bandwidths, we conduct analyses using alternative margins of victory (MoVs): 1%, 3%, 7%, and 10%. Our findings remain largely consistent when employing MoVs of 3% and 7% (Models 5–8 in Table 4) but lose statistical significance at the 1% and 10% MoVs (Models 3, 4, 9, and 10 in Table 4). The loss of significance at the 1% MoV is understandable because it restricts our sample to only two special elections, thereby reducing statistical power. Conversely, the loss of significance at the 10% MoV suggests that expanding the MoV may introduce empirical noise because donor firms with 40% and 60% vote shares likely differ significantly across various dimensions. This deviation potentially violates the RDD assumptions, undermining the reliability of causal inferences drawn from these broader bandwidths.
4.3. Corroborative Evidence: Benefits Analyses
A key assumption underlying the competitive dynamics in corporate political activities is that political wins offer strategic benefits to donor firms, which may in turn disadvantage their product-market peers, therefore prompting these peer firms to adapt their political activity accordingly. In this section, we examine the plausibility of this assumption. To do so, we empirically explore whether winning donor firms, compared with their peer firms,17 obtain benefits after winning the closely contested elections using the specifications below:
We measure the strategic benefits gained by winning donor firms relative to their peers through changes in government sales (△ Sales to Gov), analyst coverage (△ Analyst Coverage), size (△ Size), and revenue (△ Revenue). Each change is calculated as the difference between the years before and after the election (i.e., after − before). Winning Donor Firmsi,t is a dummy variable taking the value of 1 if the firm is a winning donor firm in our sample and 0 if the firm is a peer firm of the winning donor firm. Controlsi,t−1 includes the same variables in Equation (1). ηt and δj represent election and industry fixed effects, respectively. εi,j,t is the error term. We use OLS regressions and cluster standard errors at the firm level.
As shown in panel A of Table 5, the coefficient on Winning Donor Firms is positive and significant across all four measures of △Outcomes, demonstrating that winning donor firms do indeed gain strategic benefits compared with their peers. The direct increase in government sales suggests that political wins help secure government contracts, aligning with what Hillman and Hitt (1999) termed transactional political activities. However, revenue growth outpacing government sales indicates that donor firms benefit from their political wins in ways beyond just securing government contracts. This might involve a favorable regulatory environment that enhances firms’ sales, size, and visibility, aligning with what Hillman and Hitt (1999) termed relational political activities, where politicians provide reciprocal support to their donors. Thus, political wins appear to offer both transactional and relational benefits, validating our assumption underlying the competitive dynamics in corporate political activities.
|
Table 5. Benefits Analyses
| Dependent variable | △ Sales to Gov | △ Analyst Coverage | △ Size | △ Revenue |
|---|---|---|---|---|
| (1) | (2) | (3) | (4) | |
| Panel A: Benefits of winning donor firms | ||||
| Winning donor firms | 0.165* | 1.104*** | 0.021* | 0.332*** |
| (0.079) | (0.291) | (0.010) | (0.063) | |
| Annual board turnover | 0.000 | −0.230** | −0.038*** | −0.101*** |
| (0.018) | (0.073) | (0.009) | (0.017) | |
| Log(employees) | 0.077** | 0.277*** | 0.009** | 0.136*** |
| (0.024) | (0.048) | (0.003) | (0.012) | |
| Leverage | 0.014 | −0.437*** | −0.166*** | −0.043 |
| (0.020) | (0.098) | (0.021) | (0.037) | |
| Profitability | 0.008 | 0.065* | 0.005 | 0.017 |
| (0.007) | (0.026) | (0.006) | (0.011) | |
| Industry competition (HHI) | 0.227 | −1.802 | 0.040 | −0.324 |
| (0.221) | (2.042) | (0.107) | (0.735) | |
| Constant | −0.081** | 0.550*** | 0.096*** | 0.362*** |
| (0.026) | (0.137) | (0.010) | (0.048) | |
| Election F.E. | Yes | Yes | Yes | Yes |
| Industry F.E. | Yes | Yes | Yes | Yes |
| Observations | 7,204 | 7,204 | 7,204 | 7,204 |
| Adj-R2 | 0.033 | 0.181 | 0.070 | 0.686 |
| Panel B: Benefits of losing donor firms | ||||
| Losing donor firms | 0.095 | −0.050 | −0.011 | 0.021 |
| (0.083) | (0.185) | (0.012) | (0.029) | |
| Annual board turnover | −0.008 | −0.123* | −0.039*** | −0.020 |
| (0.020) | (0.061) | (0.008) | (0.013) | |
| Log(employees) | 0.059** | −0.067+ | −0.002 | 0.004 |
| (0.023) | (0.040) | (0.004) | (0.007) | |
| Leverage | 0.014 | −0.397*** | −0.166*** | −0.040 |
| (0.013) | (0.095) | (0.028) | (0.030) | |
| Profitability | −0.003 | 0.025 | 0.026*** | 0.028*** |
| (0.002) | (0.027) | (0.007) | (0.008) | |
| Industry competition (HHI) | −0.144 | −2.866* | 0.633*** | 0.307 |
| (0.186) | (1.352) | (0.166) | (0.409) | |
| Constant | −0.038* | 0.679*** | 0.126*** | 0.090** |
| (0.019) | (0.097) | (0.013) | (0.029) | |
| Election F.E. | Yes | Yes | Yes | Yes |
| Industry F.E. | Yes | Yes | Yes | Yes |
| Observations | 5,924 | 5,924 | 5,924 | 5,924 |
| Adj-R2 | 0.022 | 0.031 | 0.066 | 0.123 |
Note. Robust standard errors in parentheses.
+p < 0.1; *p < 0.05; **p < 0.01; ***p < 0.001.
We also conduct a similar analysis for losing donor firms. Given that these firms do not secure political wins through their contributions to candidates in elections, we expect to see null results across all measures of ΔOutcomes. These expectations are confirmed in panel B of Table 5, which shows null results.
Taken together, the results in Table 5 corroborate the assumption in our RDD analysis: only supported candidates who are successfully elected can provide strategic benefits to donor firms; in contrast, merely financing their campaigns does not in itself ensure any strategic gains.
4.4. Placebo Tests
We conduct two placebo tests that we believe add value to our empirical design. First, to ensure that our findings in Table 4 do not simply reflect a general tendency of peer firms to appoint directors in response to onor firms’ political wins, we replicate our analysis focusing on the appointment of nonpolitician directors by peer firms. Given our theoretical prediction that peer firms adapt their political activities in response to donor firms’ political wins, we expect no impact of donor firms’ political wins on the peer firms’ appointment of nonpoliticians to their boardrooms. Models 1 and 2 of Online Appendix 1 confirm this expectation, with null results.
Second, whereas focusing solely on nondonating peers helps isolate the causal impact of donor firms’ political wins on peer firms’ adaptive appointments of politicians to their boards, examining donating peer firms provides a valuable placebo test. We expect that these firms, sharing the same political wins as the focal donor firms in the same elections, would not feel compelled to appoint additional politicians to their boards in response to those shared wins. Models 3 and 4 in Online Appendix 1 confirm this expectation, also showing null results.
4.5. Empirical Robustness
We conduct additional analyses to assess the robustness of our results. First, given the count nature of our dependent variable, we employ Poisson and zero-inflated Poisson regressions as alternative regression specifications, and our results remain robust (see Models 1–4 in Online Appendix 2). Relatedly, we adopt a dichotomous measure for appointments of politicians to boardrooms and then use either OLS or logit regressions; our results do not change (see Models 5–8 in Online Appendix 2).
Second, despite our concerns about using general elections as the empirical context to test our theoretical interest, we replicate our analysis using general-election data, which unsurprisingly yields null results (Models 1 and 2 of Online Appendix 3). These null results may just reflect the limitations of general elections as a setting for cleanly identifying the causal effects related to our research interest, as we argue in Section 3.1 (Sample and Data).
Third, we include hedging donor firms in our RDD analysis. Because one of the two candidates these firms supported was elected, we categorize hedging donor firms as winning donor firms. By expanding our sample to include these firms, we replicate our RDD analysis and find a similar result (Models 3 and 4 of Online Appendix 3).
5. Validating the Competitive-Dynamics Mechanism
Our findings have so far provided robust evidence that donor firms’ political wins prompt peer firms to appoint politicians to their boards. In this section, we explore the plausibility of competitive dynamics as an underlying mechanism. A central premise of this mechanism is that peer firms, especially those (1) exposed to political risks and (2) operating in industries where government contracts are crucial to their revenues, are more likely to view donor firms’ political wins (and the associated strategic benefits) as competitive threats to their standing in the regulatory environment and product markets; thus, these firms are more likely to deploy countermeasures in response. We assess the validity of the competitive-dynamics mechanism through three different approaches; the first focuses on the heterogeneous treatment effects, the second examines the adaptive responses in the product market by peer firms, and the third investigates how the adaptive appointment of politicians by peer firms may diminish the strategic benefits to donor firms, as outlined in panel A of Table 5.
5.1. Heterogeneous Treatment Effects
5.1.1. Firm-Level Political Risk.
Political events and regulatory policies affect businesses in various ways, ranging from policy-specific impacts to idiosyncratic effects (Pastor and Veronesi 2012). Firm-level political risk, defined as a firm’s sensitivity to changes in the regulatory environment, creates uncertainties that can negatively influence corporate behavior (Hassan et al. 2019). This uncertainty often disrupts planned investment activities, making it difficult for firms to develop long-term strategies (Julio and Yook 2012).
When uncertainty materializes into actual regulatory changes, it can present firm-specific challenges and opportunities, benefiting some while placing a disproportionate burden on others within the same product markets (Brogaard et al. 2020). For instance, in many countries, government incentives such as subsidies and tax credits favor solar- and wind-power firms in order to promote renewable energy and reduce carbon emissions. These policies disproportionately burden coal and natural-gas firms with higher compliance costs because of stricter environmental standards and carbon taxes. Consequently, renewable energy firms gain a competitive advantage, whereas fossil-fuel firms struggle with profitability. Thus, changes in the regulatory environment can alter the competitive landscape of firms.
In our context, political wins might help donor firms secure favorable regulatory changes, putting their peers at a disadvantage, as illustrated in the case of renewable-energy versus fossil-fuel firms. Under the competitive-dynamics mechanism, we would expect that if peer firms are highly sensitive to such regulatory changes (i.e., they have a higher sensitivity to political risks), they are more likely to adopt countermeasures. This allows them to navigate an evolving regulatory environment and avoid being pushed into a disadvantaged position.
We test the plausibility of this line of reasoning by examining the moderating role of firm-level exposure to political risk in our RDD setup, using data from Hassan et al. (2019).18 We expect that firm-level exposure to political risk in the year before elections will positively moderate the main effect. Our results, shown in Models 1 and 2 in Table 6, support this positive moderating effect, suggesting that competitive dynamics may explain why peer firms appoint politicians in response to donor firms’ political wins.
|
Table 6. Heterogenous Treatment Effects
| Dependent variable | Number of politicians appointed | |||
|---|---|---|---|---|
| (1) | (2) | (3) | (4) | |
| Treatment peers | 0.025** | 0.020* | 0.014* | −0.002 |
| (0.008) | (0.009) | (0.006) | (0.011) | |
| Firm political risk | −0.001 | −0.022** | ||
| (0.011) | (0.007) | |||
| Treatment peers × Firm political risk | 0.034+ | |||
| (0.018) | ||||
| GovSales HHI | 0.059 | 0.021 | ||
| (0.055) | (0.050) | |||
| Treatment peers × GovSales HHI | 0.096* | |||
| (0.046) | ||||
| Annual board turnover | 0.030*** | 0.030*** | 0.027*** | 0.027*** |
| (0.007) | (0.007) | (0.005) | (0.005) | |
| Log(employees) | 0.012** | 0.012** | 0.012*** | 0.012*** |
| (0.004) | (0.004) | (0.003) | (0.003) | |
| Leverage | −0.007 | −0.008 | −0.008 | −0.008 |
| (0.008) | (0.008) | (0.007) | (0.007) | |
| Profitability | 0.005* | 0.005* | 0.001 | 0.001 |
| (0.002) | (0.002) | (0.002) | (0.002) | |
| Industry competition (HHI) | −0.008 | −0.011 | −0.021 | −0.011 |
| (0.120) | (0.120) | (0.097) | (0.097) | |
| Constant | −0.005 | −0.002 | −0.007 | −0.002 |
| (0.010) | (0.010) | (0.012) | (0.011) | |
| Election F.E. | Yes | Yes | Yes | Yes |
| Industry F.E. | Yes | Yes | Yes | Yes |
| Observations | 9,686 | 9,686 | 13,796 | 13,796 |
| Adj-R2 | 0.016 | 0.016 | 0.017 | 0.017 |
Note. Robust standard errors in parentheses.
+p < 0.1; *p < 0.05; **p < 0.01; ***p < 0.001.
5.1.2. Industry Competition for Government Sales.
Firms often compete for government sales because these contracts can offer substantial and stable revenue streams (Flammer 2018). This competition is particularly evident in industries such as defense, construction, technology, healthcare, and infrastructure. However, firms that rely heavily on government contracts can be disproportionately affected by shifts in government policy and regulatory environments (Brogaard et al. 2021). Any changes in procurement guidelines, budget priorities, or compliance standards can significantly impact profitability. For instance, a shift in defense spending could prioritize advanced cybersecurity solutions over traditional weaponry, favoring tech-focused defense contractors while leaving traditional arms manufacturers with reduced government sales. Similarly, a change in healthcare reimbursement rates could increase funding for innovative telehealth providers while reducing revenue streams for bricks-and-mortar healthcare facilities. This vulnerability makes firms highly sensitive to potential changes in the regulatory environment and government relationships. Therefore, they often continuously monitor political changes and adapt their political capital to secure future contracts and protect their revenue streams (Kim 2019).
In this context, political wins might help donor firms secure favorable regulatory changes and gain a competitive edge. Whether these political wins actually bring them more government contracts depends on the level of competition in the industry for government sales. In a stable environment where every firm can routinely secure its contracts, donor firms’ political wins may have little impact in terms of shifting government contracts away from peer firms. As a result, peer firms will be less concerned about donor firms’ political wins and will not perceive them as a competitive threat to their government sales. In contrast, in highly competitive environments, where firms will do whatever it takes to secure government contracts, donor firms’ political wins can provide a significant advantage, placing their peers at a disadvantage. Thus, peer firms in these environments are more likely to view donor firms’ political wins as a potential threat to their profitability regarding government sales. They are therefore more likely to implement countermeasures to mitigate the competitive threat posed by winning donor firms.
We test the plausibility of this line of argument by examining the moderating role of industry-level competition for government sales. To measure this, we aggregate firm data to the industry level using one-digit Standard Industrial Classification (SIC) codes. We then calculate the Herfindahl-Hirschman Index (HHI) of concentration based on the market share of government sales for all public firms in each industry19 year by year. We reverse-code the average value of the index over the past three years to serve as a proxy for competition. We expect that industry-level competition for government sales will positively moderate the main effect. Our results, presented in Table 6, confirm this positive moderating effect, lending additional credence to the competitive-dynamics mechanism.
5.2. Peer Firms’ Adaptive Responses in Product Markets
When political wins help donor firms secure a favorable regulatory environment, peer firms may find their market positions threatened because of potential regulatory changes. To counter this competitive threat, peer firms may not only adapt their political behavior but also strategically alter their product-market behavior to mitigate the impact. Specifically, they might invest in differentiating their products, thereby diversifying their appeal and reducing direct competition. For instance, if a donor firm gains an advantage in a traditional market segment through policy-driven subsidies, its peers might respond by innovating or enhancing product features that cater to different customer needs or niche markets.
To test this conjecture, we analyze how donor firms’ political wins result in changes in the product similarity between donor and peer firms, using our RDD setup. We employ the product-similarity measure developed by Hoberg and Phillips (2016) to construct the indicator variable Peer Relationships with Donor Firms. This variable is coded as 1 if peer firms continue to be recognized as peers of donor firms based on the Hoberg and Phillips (2016) similarity scores in the years following elections. It is coded as 0 if they are no longer recognized as peers according to the score. If the competitive-dynamics mechanism is at play, then we would expect a negative correlation between donor firms’ political wins and Peer Relationships with Donor Firms. Because the product-similarity score is dyadic, changes in it could result from donor firms, peer firms, or both. However, Akcigit et al. (2023), also using RDD approaches, found that donor firms that experience political wins are less likely to innovate their product portfolios. Instead, these firms often capture the rent implications of political wins by boosting sales and employment under favorable regulations rather than increasing productivity. This aligns with our benefit analysis in Section 4.3 (Corroborative Evidence: Benefits Analyses). Thus, it seems reasonable to assume that in our test, the changes in the product-similarity score are more likely to come from peer firms rather than donor firms.
Recognizing that product differentiation usually requires time, we examine the effect of donor firms’ political wins on peer firms’ product differentiation one, two, and three years postelection.20 Table 7 presents our results, showing that the impact on peer firms’ product differentiation begins one year after the elections. This evidence further increases the plausibility of the competitive-dynamics mechanism in explaining our findings.
|
Table 7. Post-Election Peer Relationships
| Dependent variable | Peer relationships with donor firms | ||
|---|---|---|---|
| (t + 1) | (t + 2) | (t + 3) | |
| (1) | (2) | (3) | |
| Treatment peers | −0.344** | −0.344*** | −0.274** |
| (0.108) | (0.100) | (0.100) | |
| Annual board turnover | −0.063 | −0.015 | 0.024 |
| (0.045) | (0.042) | (0.043) | |
| Log(employees) | 0.025 | 0.085*** | 0.075** |
| (0.025) | (0.024) | (0.026) | |
| Leverage | −0.115 | 0.006 | −0.015 |
| (0.084) | (0.077) | (0.078) | |
| Profitability | −0.016 | 0.008 | 0.026 |
| (0.021) | (0.018) | (0.019) | |
| Industry competition (HHI) | 0.681 | 1.411 | 0.919 |
| (1.060) | (1.076) | (1.294) | |
| Constant | −2.129*** | −1.048* | −1.606*** |
| (0.617) | (0.419) | (0.467) | |
| Election F.E. | Yes | Yes | Yes |
| Industry F.E. | Yes | Yes | Yes |
| Observations | 9,080 | 9,074 | 8,619 |
| Pseudo-R2 | 0.052 | 0.067 | 0.065 |
Note. Robust standard errors in parentheses.
+p < 0.1; *p < 0.05; **p < 0.01; ***p < 0.001.
5.3. Donor Firms’ Benefits Mitigated by Peer Counteractions
In Section 4.3 (Corroborative Evidence: Benefits Analyses), we show that donor firms’ political wins often translate into tangible advantages such as an increase in government sales, analyst coverage, size, or revenue. We argue that these benefits could disadvantage peer firms in the product market, prompting them to view such wins by donor firms as potential threats; in response, peer firms may be motivated to appoint politicians to their boardrooms as an adaptive response to counter these disadvantages. If these adaptive appointments are intended as countermeasures, then we would expect them to potentially mitigate the strategic benefits gained by donor firms, thereby leveling the competitive playing field.
To explore this, we extend our analysis to assess whether the appointment of politicians by peer firms mitigates donor firms’ strategic benefits in key areas, such as government contracts, regulatory advantages, and market positioning. Specifically, we use the same measures of benefits analyzed in panel A of Table 5 and introduce an interaction term between Winning Donor Firms and Number of Politicians Appointed by Peer Firms Post-Elections. If peer firms’ counteractions do have mitigation effects in the competitive playing field, then we expect to see a negative interaction term. The results, presented in Table 8, confirm this expectation, further validating competitive dynamics as a plausible mechanism underlying our findings.
|
Table 8. Donor Firms’ Benefits Mitigated by Peer Counteractions
| Dependent variable | △ Sales to Gov | △ Analyst Coverage | △ Size | △ Revenue |
|---|---|---|---|---|
| (1) | (2) | (3) | (4) | |
| Winning donor firms | 0.195* | 1.233*** | 0.023* | 0.358*** |
| (0.086) | (0.303) | (0.011) | (0.066) | |
| Number of politicians appointed by peer firms postelections | 0.066 | 0.564* | 0.059* | −0.037 |
| (0.111) | (0.259) | (0.026) | (0.042) | |
| Winning donor firms × Number of politicians appointed by peer firms postelections | −0.369* | −1.681** | −0.043 | −0.290* |
| (0.173) | (0.565) | (0.036) | (0.115) | |
| Annual board turnover | 0.002 | −0.229** | −0.040*** | −0.096*** |
| (0.016) | (0.072) | (0.009) | (0.017) | |
| Log(employees) | 0.077** | 0.273*** | 0.009* | 0.137*** |
| (0.024) | (0.048) | (0.003) | (0.012) | |
| Leverage | 0.014 | −0.437*** | −0.165*** | −0.044 |
| (0.020) | (0.098) | (0.021) | (0.037) | |
| Profitability | 0.008 | 0.064* | 0.005 | 0.017 |
| (0.007) | (0.026) | (0.006) | (0.011) | |
| Industry competition (HHI) | 0.243 | −1.734 | 0.041 | −0.310 |
| (0.221) | (2.042) | (0.107) | (0.735) | |
| Constant | −0.085** | 0.530*** | 0.095*** | 0.359*** |
| (0.027) | (0.137) | (0.010) | (0.048) | |
| Year F.E. | Yes | Yes | Yes | Yes |
| Industry F.E. | Yes | Yes | Yes | Yes |
| Observations | 7,204 | 7,204 | 7,204 | 7,204 |
| Adj-R2 | 0.034 | 0.183 | 0.071 | 0.686 |
Note. Robust standard errors in parentheses.
+p < 0.1; *p < 0.05; **p < 0.01; ***p < 0.001.
6. Alternative Explanations
Although our evidence has thus far strongly supported the plausibility of competitive dynamics as a mechanism underlying our findings, we recognize that other mechanisms may operate in combination. Alternative explanations, such as mimetic isomorphism and governance pressures, could also account for our observations, as detailed below. In this section, we conduct additional analyses to assess the plausibility of these potential alternatives.
6.1. Mimetic Isomorphism
Our findings might be alternatively explained through the lens of mimetic isomorphism, a concept that explains why organizations adopt the practices of others within their field (DiMaggio and Powell 1983). Organizations are more likely to adopt specific practices when they observe successful outcomes from others in their field who have implemented similar practices (Haveman 1993). Such observations reduce the uncertainties associated with these practices (Strang and Soule 1998). By emulating these successful practices, organizations aim to replicate success and mitigate their own operational uncertainties, using mimetic isomorphism as a strategic adaptation to effectively navigate the complexities of their environments (Dobbin et al. 2007). For instance, Coleman et al. (1966) found that doctors are more likely to adopt new drugs when they see opinion leaders in their field using these medical innovations.
Mimetic isomorphism could therefore explain why donor firms’ political wins might prompt their peers in the product market to appoint politicians to their boards. When the political activities of donor firms yield observable benefits in the marketplace, peer firms might view this success as a validated and effective model. The strategic advantages realized by donor firms diminish the uncertainties associated with engaging in corporate political activities. Consequently, peer firms may emulate these successful practices, aiming to replicate their success and secure similar benefits. This imitation, motivated by a desire to reduce uncertainty and achieve comparable advantages, underscores the relevance of mimetic isomorphism in explaining our findings.
To further examine the plausibility of mimetic isomorphism as an underlying mechanism of our findings, a more direct test involves investigating the likelihood that firms without prior experience in political donations establish their own PACs in response to donor firms’ political wins. This analysis aims to directly assess whether donor firms’ political wins act as a catalyst for similar actions among observing firms. Specifically, we analyze data on peer firms that had not established PACs prior to being exposed to the political wins of donor firms. We then examine whether these firms subsequently create PACs in response to donor firms’ political wins. If mimetic isomorphism is a driving force behind our results, then we would expect to find a positive correlation between donor firms’ political wins and the establishment of PACs by peer firms that previously had no PACs.
Empirically, we create an indicator variable, PAC Creation, which is coded as 1 if a peer firm established a PAC in the years following the elections. We then employ our RDD framework with logit regression models to assess how the political wins of donor firms impact the likelihood of peer firms creating PACs in the subsequent years (t + 1, t + 2, and t + 3).21 As is shown in Online Appendix 4, we find null results across all timeframes. This provides direct evidence that falsifies the plausibility of a mimetic isomorphism mechanism as a key driver of our main findings.
6.2. Governance Pressures
A second potential alternative explanation relates to governance pressures (Aguilera et al. 2015), which highlights the influence exerted by monitors such as financial analysts and institutional investors on firm behavior. These monitors often encourage firms to engage in activities that enhance their competitive advantage. If these observers note that corporate political activities have improved the competitive stance of donor firms, then they might advocate for other firms within their portfolio to engage in a similar way.
This perspective suggests that peer firms’ adaptive responses to donor firms’ political wins may not originate solely from internal motivations but also from expectations and pressures from governance monitors. Investors and analysts might urge firms to engage in political activities to secure a competitive edge in regulatory environments and improve market performance. Consequently, peer firms’ involvement in political activities, such as appointing politicians to their boards, might represent a strategic alignment with these expectations rather than purely proactive initiatives.
To empirically test this conjecture, we examine whether the presence of common financial analysts and institutional investors between peer and donor firms moderates the relationship between donor firms’ political wins and the appointment behaviors of peer firms. If governance pressures act as an alternative explanation of our findings, then we would expect that shared analysts and investors would intensify the perceived need for peer firms to appoint politicians to their boards. We operationalize this by introducing interaction terms in our models between donor firms’ political wins and the presence of common analysts and institutional investors. However, as shown in Online Appendix 5, the coefficients on the interaction term are both insignificant, suggesting that governance pressures are not driving our main findings.
7. Discussion
7.1. Overview of Findings
We began this research by identifying a gap in the literature on corporate political donations. Previous research has traditionally focused on how political wins afford donor firms strategic advantages, with little attention paid to the competitive implications of such wins on their product-market peers. This lack of focus is problematic because peer firms likely perceive the political wins of donor firms, especially the strategic benefits associated with such wins, as competitive threats to their standings in both regulatory and market environments. Driven by this perception, peer firms are likely motivated to adapt their political activities, seeking to navigate the evolving competitive landscape and effectively counteract the perceived threats. Despite their plausibility, these competitive dynamics within the political marketplace have so far received little attention in the literature, constraining scholars’ understanding of the broader implications of corporate engagement in political elections.
We address this gap with an abductive approach, using a regression discontinuity design in the context of U.S. federal special elections. We focus on closely contested elections where candidates, financially backed by donor firms, either won or lost by a small margin. The quasi-random nature of electoral outcomes in these contexts enables us to explore the causal impact of donor firms’ political wins on their product-market peers’ adaptive appointment of politicians to their boardrooms. Our analysis uncovers supportive evidence for the competitive dynamics about which we speculated. The findings of this abductive research have implications for theory advancements.
7.2. Contributions to the Literature
By focusing on the competitive implications of donor firms’ political wins, our research reinvigorates the discussion on corporate engagement in political elections, revealing broader implications. Extant research tends to implicitly assume that political wins affect only the donor firms themselves (Katic and Hillman 2023), a theoretical boundary across extant studies. Our study challenges this assumption by exploring how product-market peers likely view the political wins of donor firms as competitive threats and therefore respond to such wins by adaptively appointing politicians to their boardrooms. In doing so, our study provides robust evidence for the understudied competitive dynamics in corporate political activities. This insight calls for a reexamination of prevailing assumptions concerning the scope of impact caused by corporate engagement in political elections. Adopting this competitive-dynamics perspective could breathe new life into the literature, opening up new avenues for investigating how corporate engagement in political elections influences broader market dynamics and competitive behaviors across product-market peers.
This study also extends research on director selections (Withers et al. 2012) by providing an important and novel channel for director selection that is not visible from existing perspectives. Prior studies have traditionally drawn on resource dependence theory and agency theory to explain director-selection decisions (see, e.g., Hillman et al. 2000, Krause et al. 2017). Our work highlights the critical yet underrecognized role of interfirm rivalry in influencing these decisions. Specifically, our findings suggest that firms may use director appointments as a competitive tool to counter rivals’ strategic moves. In doing so, this study is among the first to consider how observing a rival’s political wins can directly impact a firm’s director-selection process. It broadens the lens through which we understand director selection, suggesting that director selection might be more complex than previously thought.
7.3. Limitations and Future Research
This research is not without limitations. One of the most foundational limitations is that we do not directly observe whether and to what extent peer firms feel threatened by donor firms’ political wins. Although this is a common limitation in causal inference with archival data, it is a substantial one nonetheless. Future research might find it fruitful to conduct qualitative work to closely examine the perceived threat in more depth and with greater nuance.
Second, appointing politicians to the corporate board is a two-sided matching process. Yet our data allows us to observe only the demand-side behaviors (i.e., firms’ appointment actions), leaving the supply-side considerations unexamined. There is room for improvement regarding the exploration of why politicians accept or decline corporate offers. Their willingness to serve may correlate with their performance on the corporate board and therefore influence the effectiveness of peer firms’ strategic adaptation in response to donor firms’ political wins.
Third, our identification of donor firms is based on publicly available donation data. It is likely that firms may use secretive donations to support politicians (Jia et al. 2023). However, such data are unavailable. Thus, we encourage future research to replicate our studies with such secretive donation data when they become (unexpectedly) available and see which aspects of our findings hold and which ones differ.
Finally, our findings are specific to closely contested special elections and do not extend to closely contested general elections. This underscores the importance of precise identification in unexpected settings for estimating causal effects. However, focusing exclusively on special elections may limit the generalizability of our findings beyond these unique circumstances. Future research may find it fruitful to find suitable approaches to validate our findings across a broader range of electoral contexts.
7.4. Implications for Practice
Understanding the competitive implications of donor firms’ political wins is practically relevant. Our research reveals that when a donor firm experiences political wins, it doesn’t just alter its own strategic landscape but also catalyzes a series of competitive responses from its product-market peers. This observation should prompt senior executives to rethink their approach to political engagement. It is insufficient to view political donations merely as a lever to secure immediate advantages, such as favorable regulations or subsidies. The electoral success associated with these donations often triggers an arms race among peers, escalating both the stakes and the costs. Such dynamics can quickly spiral, potentially eroding the immediate benefits of political wins. Thus, firms should approach their political engagement with a nuanced understanding of broader competitive implications. This means anticipating rivals’ reactions and preparing for them, not just in the corridors of power but in the marketplace as well.
The authors are grateful for the developmental feedback from the anonymous review team led by Olav Sorenson. The authors also extend their thanks to Michael Abebe, Amanda Cowen, Qian (Cecilia) Gu, Ryan Krause, Ilaria Orlandi, and Yue (Maggie) Zhou for their insightful comments on various drafts of this paper. Last, but not least, the authors appreciate the engaging discussions with seminar participants at Peking University, Sun Yat-sen University, Tongji University, and Zhejiang University. The authors contributed equally and are listed in reverse alphabetical order.
1 Politicians may view late donations as motivated purely by interest rather than support for their political agenda, potentially weakening the impact of these donations.
2 Bonardi et al. (2005) were among the first to underscore the role of interfirm rivalry in policy agenda-setting. Similarly, Austen-Smith and Wright (1994) and Jia et al. (2023) explored the concept of counteractive lobbying, where firms take actions to oppose or mitigate the effects of lobbying efforts that contradict their interests. Collectively, these studies highlight how interfirm rivalry influences the shaping of the political agenda in a context where it remains uncertain whose interests will ultimately prevail. Our study offers a complementary perspective by examining the competitive adaptations firms undertake in response to their perceived weakening positions within the political landscape.
3 https://www.fec.gov/data/committees/?cycle=2024&organization_type=C.
4 https://www.fec.gov/resources/campaign-finance-statistics/2024/tables/pac/PAC2_2023_12m.pdf.
5 Lobbying represents another key approach that firms use to directly influence policy and regulation. However, it is subject to uncertainties similar to those associated with political donations because investments in lobbying for favorable regulations do not always yield the desired outcomes.
6 We later conduct a robustness check using general elections.
8 These donation records are publicly available and can be directly downloaded from the FEC’s website (www.fec.gov).
9 To identify product peer relationships, the Hoberg-Phillips classification is more advantageous than the SIC industry code classification (Shi et al. 2017, Connelly et al. 2020) for two main reasons. First, firms enter and exit different industries over time, and the Hoberg-Phillips classification helps mitigate bias due to firms’ sector-hopping behaviors. Second, the Hoberg-Phillips classification identifies competitive rivals by taking into account the level of corporate diversification. Because of these advantages, the Hoberg-Phillips classification has been widely used in strategy research (see, e.g., Chen et al. 2018, Runge et al. 2022, Testoni 2022).
10 Regulation S-K (Item 101) mandates that public firms must describe the products they offer, and such product descriptions often appear in either the “Item 1” or “Item 1A” sections of the firms’ SEC 10-K filings (Shi et al. 2017). The law requires these descriptions to be accurate and updated annually (Connelly et al. 2020).
11 https://hobergphillips.tuck.dartmouth.edu/idata/Readme_tnic3.txt.
12 https://hobergphillips.tuck.dartmouth.edu/industryclass.htm.
13 We later conduct a robustness check using donating peers.
14 Because we focus on politicians appointed in the year following the special election year, our sampling period for politicians appointed ends in 2021, one year after the last special election in 2020.
15 For elections occurring between January and June, all variables are measured two years prior to the election year (t − 2) to ensure that the fiscal year end in t − 1 does not coincide too closely with the election date. Conversely, for elections taking place between July and December, all variables are measured in the year preceding the election (t − 1). Our results remain largely consistent when using data from the pre-election year (t − 1) for all variables.
16 0.014 ÷ 0.034 × 100% = 41%.
17 We opt for the peer firms of donor firms as the comparison group in this analysis, rather than the losing donor firms, primarily because any benefits accruing to donor firms from political wins are typically gained at the expense of their direct rivals. This competitive dynamic makes peer firms the most appropriate comparison group for the benefit analysis.
18 These data are only available from 2006, and our sample begins in 1990, so incorporating them into our analyses results in a loss of observations compared to results in Table 4.
19 We calculate industry-level competition using data on all public firms from the Compustat database, regardless of whether they are included in our sample.
20 Peer Relationships with Donor Firms (t + 1) is coded as 1 if the donor and peer firms are recognized as product-market peers, based on the Hoberg and Phillips similarity scores, in year t + 1 and 0 otherwise. Peer Relationships with Donor Firms (t + 2) is coded as 1 if the donor and peer firms are recognized as product-market peers based on the Hoberg and Phillips similarity scores consistently in both years t + 1 and t + 2 and 0 otherwise. Peer Relationships with Donor Firms (t + 3) is coded as 1 if the donor and peer firms maintain their recognition as product-market peers based on the Hoberg and Phillips similarity scores across years t + 1, t + 2, and t + 3, and 0 otherwise.
21 PAC Creation (t + 1): This variable is coded as 1 if the firm creates a PAC in year t + 1 and 0 otherwise. PAC Creation (t + 2): This variable is coded as 1 if the firm does not create a PAC in year t + 1 but does create one in year t + 2 and 0 otherwise. PAC Creation (t + 3): This variable is coded as 1 if the firm does not create a PAC in either year t + 1 or year t + 2 but does create one in year t + 3 and 0 otherwise.
References
- (2015) Connecting the dots: Bringing external corporate governance into the corporate governance puzzle. Acad. Management Annals 9(1):483–573.Crossref, Google Scholar
- (2023) Connecting to power: Political connections, innovation, and firm dynamics. Econometrica 91(2):529–564.Crossref, Google Scholar
- (2015) Valuing changes in political networks: Evidence from campaign contributions to close congressional elections. Rev. Financial Stud. 28(11):3188–3223.Crossref, Google Scholar
- (1994) Counteractive lobbying. Amer. J. Political Sci. 38(1):25–44.Crossref, Google Scholar
- (2023) Executives in politics. Management Sci. 69(10):6251–6270.Link, Google Scholar
- (2017) Trump revives keystone pipeline rejected by Obama. Accessed November 30, 2024, https://www.nytimes.com/2017/01/24/us/politics/keystone-dakota-pipeline-trump.html.Google Scholar
- (2006) Competitive lobbying and supermajorities in a majority‐rule institution. Scand. J. Econom. 108(4):607–642.Crossref, Google Scholar
- (2014) The spoils of victory: Campaign donations and government contracts in brazil. J. Politics 76(2):415–429.Crossref, Google Scholar
- (2005) The attractiveness of political markets: Implications for firm strategy. Acad. Management Rev. 30(2):397–413.Crossref, Google Scholar
- (2020) Global political uncertainty and asset prices. Rev. Financial Stud. 33(4):1737–1780.Crossref, Google Scholar
- (2021) Political influence and the renegotiation of government contracts. Rev. Financial Stud. 34(6):3095–3137.Crossref, Google Scholar
- (1987) The political partisanship of American business: A study of corporate political action committees. Amer. Sociol. Rev. 52(6):732–744.Crossref, Google Scholar
- (2023) Director departure following political ideology (in) congruence with an incoming CEO. Strategic Management J. 44(7):1698–1732.Crossref, Google Scholar
- (1996) Competitor analysis and interfirm rivalry: Toward a theoretical integration. Acad. Management Rev. 21(1):100–134.Crossref, Google Scholar
- (2018) Geographic overlap and acquisition pairing. Strategic Management J. 39(2):329–355.Crossref, Google Scholar
- (2022) Hedging on the hill: Does political hedging reduce firm risk? Management Sci. 68(6):4356–4379.Link, Google Scholar
- (2008) Political connections and preferential access to finance: The role of campaign contributions. J. Financial Econom. 88(3):554–580.Crossref, Google Scholar
- (1966) Medical Innovation: A Diffusion Study (Bobbs-Merrill, Indianapolis, IN).Google Scholar
- (2020) CEO dismissal: Consequences for the strategic risk taking of competitor CEOs. Strategic Management J. 41(11):2092–2125.Crossref, Google Scholar
- (2010) Corporate political contributions and stock returns. J. Finance 65(2):687–724.Crossref, Google Scholar
- (2014) Political connections and sec enforcement. J. Accounting Econom. 57(2–3):241–262.Crossref, Google Scholar
- (2021) Causal Inference: The Mixtape (Yale University Press, New Haven, CT).Crossref, Google Scholar
- (2014) Are red or blue companies more likely to go green? Politics and corporate social responsibility. J. Financial Econom. 111(1):158–180.Crossref, Google Scholar
- (1983) The iron cage revisited: Institutional isomorphism and collective rationality in organizational fields. Amer. Sociol. Rev. 48(2):147–160.Crossref, Google Scholar
- (2007) The global diffusion of public policies: Social construction, coercion, competition, or learning? Annual Rev. Sociol. 33:449–472.Crossref, Google Scholar
- (2021) Democrats’ electric vehicle push sparks intense lobbying fight. Accessed August 25, 2023, https://thehill.com/policy/transportation/infrastructure/575990-democrats-electric-vehicle-push-sparks-intense-lobbying/.Google Scholar
- (2018) Competing for government procurement contracts: The role of corporate social responsibility. Strategic Management J. 39(5):1299–1324.Crossref, Google Scholar
- (2016) Corporate political strategy in contested regulatory environments. Strategy Sci. 1(4):272–284.Link, Google Scholar
- (2018) Undervaluation of directors in the board hierarchy: Impact on turnover of directors (and CEOs) in newly public firms. Strategic Management J. 39(2):429–457.Crossref, Google Scholar
- (2009) Do politically connected boards affect firm value? Rev. Financial Stud. 22(6):2331–2360.Crossref, Google Scholar
- (2013) Politically connected boards of directors and the allocation of procurement contracts. Rev. Finance 17(5):1617–1648.Crossref, Google Scholar
- (2016) Top executive behind Dakota Access has donated more than $100,000 to Trump. Accessed December 10, 2024, https://www.reuters.com/article/business/environment/top-executive-behind-dakota-access-has-donated-more-than-100000-to-trump-idUSKCN12Q2P1/.Google Scholar
- (2019) Firm-level political risk: Measurement and effects. Quart. J. Econom. 134(4):2135–2202.Crossref, Google Scholar
- (1993) Follow the leader: Mimetic isomorphism and entry into new markets. Admin. Sci. Quart. 38(4):593–627.Crossref, Google Scholar
- (2023) Corporate political connections and favorable environmental regulatory enforcement. Management Sci. 69(12):7838–7859.Link, Google Scholar
- (2005) Politicians on the board of directors: Do connections affect the bottom line? J. Management 31(3):464–481.Crossref, Google Scholar
- (1999) Corporate political strategy formulation: A model of approach, participation, and strategy decisions. Acad. Management Rev. 24(4):825–842.Crossref, Google Scholar
- (2000) The resource dependence role of corporate directors: Strategic adaptation of board composition in response to environmental change. J. Management Stud. 37(2):235–256.Crossref, Google Scholar
- (2004) Corporate political activity: A review and research agenda. J. Management 30(6):837–857.Google Scholar
- (2016) Text-based network industries and endogenous product differentiation. J. Political Econom. 124(5):1423–1465.Crossref, Google Scholar
- (2013) Integrated market and nonmarket strategies: Political campaign contributions around merger and acquisition events in the energy sector. Strategic Management J. 35(3):450–460.Crossref, Google Scholar
- (2023) Theoretical light in empirical darkness: Illuminating strategic concealment of corporate political activity. Acad. Management Rev. 48(2):264–291.Crossref, Google Scholar
- (2012) Political uncertainty and corporate investment cycles. J. Finance 67(1):45–83.Crossref, Google Scholar
- (2023) Corporate political activity, reimagined: Revisiting the political marketplace. J. Management 49(6):1911–1938.Crossref, Google Scholar
- (2019) Is your playing field unleveled? U.S. Defense contracts and foreign firm lobbying. Strategic Management J. 40(12):1911–1937.Crossref, Google Scholar
- (2017) Compromise on the board: Investigating the antecedents and consequences of lead independent director appointment. Acad. Management J. 60(6):2239–2265.Crossref, Google Scholar
- (2023) Google and Microsoft are fighting again. Wall Street Journal (November 9), https://www.wsj.com/tech/google-antitrust-trial-exposes-deepening-rift-with-microsoft-d1d8dced.Google Scholar
- (2008) Randomized experiments from non-random selection in U.S. House elections. J. Econometrics 142(2):675–697.Crossref, Google Scholar
- (2010) Regression discontinuity designs in economics. J. Econom. Lit. 48(2):281–355.Crossref, Google Scholar
- (2019) On board with banks: Do banking connections help politicians win elections? J. Politics 81(4):1357–1370.Crossref, Google Scholar
- (2016) Is this the end of big-money politics? Accessed November 30, 2024, https://www.newyorker.com/news/daily-comment/is-this-the-end-of-big-money-politics.Google Scholar
- (2008) Manipulation of the running variable in the regression discontinuity design: A density test. J. Econometrics 142(2):698–714.Crossref, Google Scholar
- (2009) Managerial (in)attention to competitive threats. J. Management Stud. 46(2):157–181.Crossref, Google Scholar
- (2016) Capitol gains: The returns to elected office from corporate board directorships. J. Politics 78(1):181–196.Crossref, Google Scholar
- (2012) Uncertainty about government policy and stock prices. J. Finance 67(4):1219–1264.Crossref, Google Scholar
- (2022) The invention performance implications of coopetition: How technological, geographical, and product market overlaps shape learning and competitive tension in R&D alliances. Strategic Management J. 43(2):266–294.Crossref, Google Scholar
- (2020) Helping friends or influencing foes: Electoral and policy effects of campaign finance contributions. Amer. J. Political Sci. 65(1):88–100.Crossref, Google Scholar
- (2017) Ripple effects of CEO awards: Investigating the acquisition activities of superstar CEOs’ competitors. Strategic Management J. 38(10):2080–2102.Crossref, Google Scholar
- (2000) American Business and Political Power: Public Opinion, Elections, and Democracy (University of Chicago Press, Chicago, IL).Crossref, Google Scholar
- (1976) Impact of the federal election campaign act of 1971. Ann. Amer. Acad. Political Soc. Sci. 425(1):98–113.Crossref, Google Scholar
- (1998) Diffusion in organizations and social movements: From hybrid corn to poison pills. Annual Rev. Sociol. 24:265–290.Crossref, Google Scholar
- (2022) The market value spillovers of technological acquisitions: Evidence from patent-text analysis. Strategic Management J. 43(5):964–985.Crossref, Google Scholar
- (2012) A multidisciplinary review of the director selection literature. J. Management 38(1):243–277.Crossref, Google Scholar
- (2019) The impact of hiring directors’ choice‐supportive bias and escalation of commitment on CEO compensation and dismissal following poor performance: A multimethod study. Strategic Management J. 41(2):308–339.Crossref, Google Scholar