


Discretion in Automated Supermarket Replenishment: Censorship Bias and Self-Inflicted Stockouts
Abstract
Problem definition: We study a paradox in which decision makers deviate downward from proposals of an automated store replenishment system after a stockout. We argue that censorship bias explains this curious ordering behavior and it has negative performance implications. We compare the effect of censorship bias to that of anchoring bias to understand the relative importance of censorship bias in retail practice. Understanding the impact of certain biases on decision makers’ inventory replenishment decisions in the presence of an algorithm is imperative to maximize the benefit from decision makers’ discretionary power. Methodology/results: We analyze data on perishable products from an upmarket supermarket chain by employing exclusion restrictions in our recursive bivariate probit model to account for the endogeneity of deviations. We complement our analysis with endogenous switching regression and seemingly unrelated regression models to further test the robustness of our results. We find that after a stockout, decision makers’ likelihood of deviating downward is higher, a behavior aligned with censorship bias. We find that anchoring bias is more powerful than censorship bias in predicting downward deviations. Regarding the performance implications, we show that censorship bias is more detrimental than anchoring bias in terms of increasing the likelihood of a new stockout. Therefore, we suggest that this insight into censorship bias can be used to distinguish uninformed downward deviations from the informed ones. Managerial implications: To suggest actionable policies, we collect more data to test the idea of blocking downward deviations when censorship bias is suspected. With this additional data analysis, we show that by blocking the downward deviations susceptible to censorship bias, retail managers can reduce self-inflicted stockouts with reasonable inventory cost implications.
Supplemental Material: The online supplement is available at https://doi.org/10.1287/msom.2023.0426.
1. Introduction
Automation of grocery replenishment processes is spearheading digital transformation in the retail sector (McKinsey & Company 2020). The backbone technology for the use of artificial intelligence in replenishment decisions is an automated store replenishment (ASR) system designed to optimize the trade-off between shelf availability and inventory holding costs (Angerer 2006). Despite the demonstrated effectiveness of ASR systems (Avlijas et al. 2015), human decision makers typically have the freedom to override and deviate from the proposed algorithmic solutions. Allowing this discretion aims to utilize human decision makers’ private knowledge and insight that cannot be taken into account algorithmically. In the seminal study on ASR system use, van Donselaar et al. (2010) report that deviations from the proposed orders may result in performance improvement. However, discretion may also have unintended consequences because of the cognitive limitations of decision makers. Specifically, Sun et al. (2022) propose that deviations from algorithmic suggestions can be classified as either information deviations or complexity deviations. The former are triggered by human decision makers’ private information and insight, whereas the latter are triggered by their inability to understand algorithmic prescriptions and are, therefore, susceptible to decision-making biases and fallacies. If organizations were able to distinguish information deviations from complexity deviations, they would benefit from human insight and private information while minimizing the detrimental effect of decision-making biases and fallacies. In this paper, we propose a way to distinguish one form of uninformed deviation in the grocery replenishment context.
In the inventory replenishment context, deviations from ASR proposals can be upward or downward. The main reasons for upward deviations include expectations of abnormal peaks in demand as well as logistical reasons to advance replenishment shipments (van Donselaar et al. 2010). Meanwhile, downward deviations are made to avoid excessive inventory and spoilage when abnormal slumps in demand are expected. Upward and downward deviations also involve different risks. Upward deviations may cause high levels of spoilage and inventory holding costs, whereas downward deviations may lead to stockouts. Despite these differences, only the former have been studied thus far (van Donselaar et al. 2010). Given how critical product availability is for customer satisfaction, revenue, and profitability in the retail sector (Gruen et al. 2002, Anderson et al. 2006), decisions to increase stockout risk by deviating downward from ASR proposals constitute an intriguing phenomenon. This gets even more interesting for perishable products because of the stockout–waste trade-off. User discretion in inventory decisions of perishable products has not been studied so far, yet these products account for a considerable part of grocers’ revenue. Hence, we focus on the antecedents of downward deviations from ASR proposals for perishable products and the performance implications of such deviations, particularly when they are marked by decision-making biases.
Our main focus is censorship bias (Feiler et al. 2013), which has received little attention in the behavioral operations management literature. It refers to a situation in which a decision maker interprets sales as demand after a stockout, failing to consider the demand that was not fulfilled because of the stockout, that is, lost sales. Such misinterpretation creates downward-biased demand expectations, potentially leading to situations in which, after a stockout, ASR system users perceive ASR proposals to be excessive and decide to order less than proposed in an attempt to avoid unnecessary inventory. Censorship bias has been examined in laboratory studies where subjects, on average, order significantly less under the censored demand condition (Feiler et al. 2013, Rudi and Drake 2014, Tong et al. 2018). Ordering less than ASR proposals after a stockout is curious behavior because, logically, it could be expected that one would be careful to follow the proposal or to order more than the proposal after experiencing a stockout. In the absence of field research, it is unclear whether behavioral biases exist in the actual orders of practitioners (Sachs et al. 2022). For example, one might expect that censorship bias is not so common in actual retail practice, where the stakes are much higher than they are for laboratory subjects. Therefore, as an initial check of its existence, we turn to our data in Figure 1.
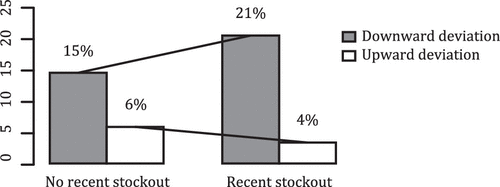
Notes. Percentages are computed over instances where the ASR system makes a proposal. The underlying counts are as follows: For observations with no recent stockout, there are 7,423 cases with no deviation, 1,370 with downward deviation, and 568 with upward deviation. For observations with a recent stockout, there are 1,502 cases with no deviation, 410 with downward deviation, and 70 with upward deviation.
The left part of the bar chart shows the percentages for upward and downward deviations from ASR proposals in the absence of a recent stockout (in the week before the order placement). The right part of the chart illustrates the same when there has been a recent stockout. We observe that downward deviations from ASR proposals are six percentage points (40%) more common after a stockout than when there has been no recent stockout. These numbers demonstrate the possibility that censorship bias transcends the conditions of laboratory studies. However, something else could be going on as well. One alternative explanation to ordering less than what the ASR system proposes after a stockout is anchoring bias (Tversky and Kahneman 1974), which, in contrast to censorship bias, has been extensively studied in the literature. Since it was first examined in the inventory replenishment context by Schweitzer and Cachon (2000), anchoring bias has been consistently observed in behavioral operations management research (e.g., Bostian et al. 2008, Bolton et al. 2012, Rudi and Drake 2014). We include anchoring bias in our analyses, its main operationalization being the ASR proposal size relative to past purchase orders, to test whether censorship bias has a distinct effect and to compare the effects of these two biases.
In addition to examining whether censorship bias exists in practice and how it compares to anchoring bias in triggering deviations from algorithmic suggestions, we also analyze the performance implications of the two biases. In particular, when ASR system users order less than the system’s proposals after a stockout, do they do so to the extent that it causes operational harm in the form of subsequent stockouts? Although censorship bias has been observed in laboratory experiments (Feiler et al. 2013, Tong et al. 2018), field research is needed to understand whether it has any economically relevant performance implications. For example, even if censorship bias occurred in practice, the practitioners could be more cautious than the laboratory subjects and react to it so subtly that it might not cause operational harm. If it does cause stockouts, then how does that harm compare with the harm caused by the well-established anchoring bias?
To study these questions, we use data from a sample of stores of an upmarket European supermarket chain. Because we are interested in stockout implications of downward deviations from ASR proposals and because decisions to deviate are endogenous, our primary econometric strategy relies on a recursive bivariate probit model (Maddala 1983). We develop the first equation of our model to predict downward deviations based on the findings of van Donselaar et al. (2010) and Khosrowabadi et al. (2022). In its second equation, our model estimates the stockout implications of downward deviations in the presence and in the absence of recent stockouts, as well as the direct effect of recent stockouts when no downward deviation is made. We complement our analysis with an endogenous switching regression model (Amemiya 1984) and a seemingly unrelated regression (SUR) model (Zellner 1962). In these analyses, we observe that the stockout effect is significantly greater when the ordering decision is aligned with censorship bias (i.e., a downward deviation is made after a recent stockout). Together, these models indicate a causal link between recent stockouts, downward deviations, and subsequent stockouts, which can be explained by censorship bias. Specifically, we show that censorship bias explains downward deviations from ASR proposals, but its effect is not as strong as the effect of anchoring bias on the likelihood of a downward deviation. Regarding the performance implications of downward deviations, our models show that the likelihood of a stockout increases more when a downward deviation is explained by censorship bias than when it is explained by anchoring bias. To explore the practical relevance of our findings, we collect additional data to test the performance implications of blocking deviations susceptible to censorship bias. Our simulations in these additional data suggest that blocking downward deviations made after a recent stockout would decrease self-inflicted stockouts while minimally increasing inventory holding costs. This practical insight can be used to further develop ASR software and train ASR system users.
2. Literature Review
Organizations exploit the advancements in artificial intelligence, big data, and machine learning to assist human decision making in various contexts, from forecasting (Önkal et al. 2009) to ordering (van Donselaar et al. 2010). However, algorithmic assistance has limitations because its prescriptions sometimes lack the information that practitioners have (Campbell and Frei 2011). Therefore, decision makers typically have freedom to override algorithmic solutions so that they can incorporate their private information. For example, Elmaghraby et al. (2015) report that salespeople of grocery product distributors take into account a wide spectrum of factors when deviating from price changes recommended by their algorithm. Campbell and Frei (2011) report that local managers at a large retail bank override the recommendations of a centralized capacity planning system to take market-specific customer sensitivities to service times into consideration. Phillips et al. (2015) estimate that local salespeople’s adjustments to the headquarters’ price list in auto lending pricing lead to profit improvements. However, discretion may have unintended consequences given the bounded rationality of decision makers. For example, Caro and Sáez de Tejada Cuenca (2023) report a negative revenue impact when users deviate from the recommendations of a pricing support system in fashion retail. In radiological diagnoses, Ibanez et al. (2018) report a negative productivity effect for doctors’ discretion over their task sequences. In the automobile industry, Kesavan and Kushwaha (2020) find that merchants’ discretionary power results in subsequent reductions in profitability. Given that deviations from decision support systems are triggered by different mechanisms, Sun et al. (2022) propose a classification scheme for discretionary behavior, making a distinction between information deviations and complexity deviations. The former occur when decision makers possess information not used by the algorithm and may therefore improve outcomes; the latter reflect misunderstanding of algorithmic recommendations and are more likely to worsen outcomes.
Humans’ hesitancy to follow algorithms may be one explanation for complexity deviations. This tendency appears across contexts, including financial forecasting (Önkal et al. 2009), operating room management in hospitals (Prahl and Van Swol 2017), and predicting a joke’s funniness (Yeomans et al. 2019). This tendency to prefer human judgment over decision support system recommendations has been dubbed algorithm aversion (Dietvorst et al. 2015). One mechanism triggering algorithm aversion is that decision makers typically perceive an algorithm as a black box (Yeomans et al. 2019). Because they cannot completely comprehend processes inside algorithms, the perceived lack of control makes them uncomfortable. The resulting reluctance to follow algorithms has been observed to be stronger among practitioners than student subjects (Logg et al. 2019), making the phenomenon relevant for field research on the use of commercial decision support systems whose algorithms are black boxes for intellectual property reasons. Although most studies on algorithm aversion have focused on fairly straightforward forecasting tasks (Önkal et al. 2009, Dietvorst et al. 2015, Prahl and Van Swol 2017), there has been a recent interest in more comprehensive tasks. For example, Castelo et al. (2019) investigate algorithm aversion when subjects receive dating versus financial advice from a human versus an algorithm. Germann and Merkle (2023) examine algorithm aversion in financial decision making by analyzing subjects’ tendency to follow a human fund manager or an investment algorithm. In the retail context, an important activity that expands on the plain forecasting task is replenishment ordering, which in itself is a widely studied subject—albeit typically not in conjunction with the algorithm aversion phenomenon. Instead of adherence to any algorithm, the core interest in the existing behavioral research on ordering has been in decision makers’ adherence to the optimal order quantities of the newsvendor model.
Behavioral issues in newsvendor ordering decisions were first examined by Schweitzer and Cachon (2000). In that study, subjects demonstrated a strong anchoring bias (Tversky and Kahneman 1974). Although they adjusted away from the anchor toward the optimal order quantities, their adjustments were insufficient, and the resulting decisions were suboptimal (Schweitzer and Cachon 2000). That study and subsequent investigations concentrated on two anchor points for ordering decisions: mean demand (giving rise to the term “pull-to-center bias”; e.g., Bostian et al. 2008) and previously placed replenishment order (Lau and Bearden 2013). These are logical anchor points in laboratory studies, where they are typically the most visible pieces of information to the subjects and where demand is often assumed to follow a uniform distribution (e.g., Lau and Bearden 2013). In retail practice, however, demand is seldom stationary (Gür Ali and Gürlek 2020), full demand information is not necessarily available (but instead can be censored; Feiler et al. 2013), and daily demand figures do not correspond directly to any replenishment order quantities because of variability in order coverage periods (i.e., days between consecutive replenishments). Although these specific complexities may discourage anchoring on past demand, it has also been observed that when faced with complexity, decision makers in an inventory ordering task are inclined to select an anchor closer to the optimal solution (Gavirneni and Xia 2009). In the grocery replenishment context, such an anchor might be past purchase orders, to which the newsvendor logic has already been applied. However, even for that anchor, practical complications arise from the retail sector’s prevalent weekday seasonality patterns (van Donselaar et al. 2010), potentially diminishing the temptation to anchor directly on the previous order, which may have been placed to cater to the demand of different days of the week. In such situations, decision makers may develop a sense of what has been their average or usual order size over time and use it to anchor their decisions (Wansink et al. 1998). In the grocery replenishment context, a weekly average of past purchase orders could work for that purpose, as it would smooth over the weekday seasonality effects.
Apart from the less evident anchor points, another difference between retail practice and most experimental research on newsvendor decision making is the availability of ASR system–based decision support. In behavioral newsvendor experiments, subjects typically do not receive algorithmic suggestions; thus, the notion of a deviation in those studies is the difference between the placed order and a newsvendor model solution that is unknown to the subjects. One exception to this is in the work of Lee and Siemsen (2017), who provide subjects with algorithm-based normative order quantities. They conclude that anchoring occurs even in the presence of such suggestions. Behavioral newsvendor literature has explored potential differences between practitioners and student subjects, ultimately concluding that both are equally susceptible to anchoring bias (Bolton et al. 2012). These observations mean that the anchoring bias must be controlled for, and that it provides a benchmark for the assessment of the magnitude of the effect of other biases.
In this paper, we complement the study by van Donselaar et al. (2010) on the antecedents of order advancements of ASR proposals with an investigation into the antecedents of downward deviations. We also extend the research into the performance implications of informed and uninformed deviations (e.g., Sun et al. 2022). We shift the perspective from both earlier studies’ product-related antecedents to antecedents derived from the behavioral decision-making literature. Using anchoring bias as our benchmark, we focus on censorship bias, whose existence and effects have not yet been tested in actual retail practice and in the presence of algorithmic suggestions.
3. Hypotheses
3.1. Censorship Bias in Grocery Retail Replenishment
Censorship bias refers to a tendency to “form beliefs about the underlying population that are biased in the direction of the observed censored sample” (Feiler et al. 2013, p. 574). A classic example of censoring is the relationship between demand and sales. Typically, decision makers cannot observe lost sales after a stockout, leading them to infer demand from sales figures that have been constrained by unavailable inventory (Tong et al. 2018). This means that stockouts today may distort demand expectations for tomorrow. Rudi and Drake (2014) used the term observation bias to discuss this type of distorted inference under censored demand. In laboratory experiments, subjects show downward-biased demand beliefs when demand data are censored by a stockout, leading to lower inventory order decisions (Feiler et al. 2013, Rudi and Drake 2014, Tong et al. 2018). Ordering less after a recent stockout is counterintuitive behavior because one might expect decision makers to order more after a stockout to avoid future stockouts. However, interpreting sales up until the stockout as all of the demand that had existed would be in line with the boundedly rational human inclination to take mental shortcuts (Bazerman and Moore 2012). Censorship bias would thus be an outcome of an unintentional mental shortcut to avoid the cognitive burden of trying to account for the unknown lost sales that followed the stockout.
Despite the results of laboratory experiments, it is not obvious that censorship bias exists in retail practice. On the one hand, practitioners can be expected to be more cognizant of the lost sales and their many detrimental performance effects than the student subjects of laboratory studies. Additionally, because of the actual performance effects, the stakes are evidently higher for practitioners, making them possibly more cautious in their decision making. On the other hand, censorship bias may well exist because practitioners have to deal with hundreds of stock-keeping units (SKUs) on a daily basis and, thus, bear a much greater cognitive burden than laboratory subjects. Research has shown that decision makers dealing with many SKUs are more susceptible to biases in the newsvendor setting (Chen and Li 2018). This type of effect can be pronounced in retail practice because ASR systems should not suffer from censorship bias, at least not as much as their human users do, because drastic progress has been made in the methods for forecasting and ordering under censored demand (Shi et al. 2016). The basic principle underlying these methods is to forecast lost sales by extrapolating the demand rate that preceded the stockout. When the ASR system does that, the resulting proposals may be perceived as excessive by the users, who are susceptible to censorship bias. To study whether censorship bias triggers downward deviations, we make use of the condition under which censorship bias can exist, that is, a recent stockout, and we hypothesize the following.
The likelihood of a downward deviation from an ASR proposal is higher when a SKU has had a recent stockout.
3.2. Performance Implications of Censorship Bias: Self-Inflicted Stockouts
Retailers allow discretion for ASR system users to benefit from their private information, yet this discretionary power brings the risk of uninformed decisions that are marked by biases. We propose that censorship bias offers a way to detect one category of uninformed downward deviations. To test this idea, we are interested in the performance implications of deviations that are susceptible to censorship bias. The underlying assumption is that uninformed deviations are more likely to result in negative outcomes: stockouts in the case of downward deviations from ASR proposals.
Despite the fact that any downward deviation from an ASR proposal increases the stockout risk, some of these deviations may be informed. In fact, in forecasting tasks, negative adjustments, where managers decrease the quantity of algorithmic forecasts, tend to increase the forecasting accuracy (Fildes et al. 2009). This is because downward deviations are, on average, more often informed, as they must overcome risk aversion and overoptimism (Fildes et al. 2009, Hewage et al. 2022). Similarly, in packaging tasks, Sun et al. (2022) interpret downward deviations (switching to smaller boxes) as informed deviations. Therefore, in the replenishment ordering context, a significant part of downward deviations from ASR proposals may be informed and beneficial. To identify uninformed decisions, it makes sense to focus on the information that boundedly rational decision makers are missing (Gavetti et al. 2012). The information they lack after a stockout is lost sales, which is a crucial piece of information because its absence distorts the baseline for future forecasts (Gruen and Corsten 2007). We thus believe that focusing on recent stockouts allows us to detect a portion of the uninformed downward deviations from ASR proposals that are driven by boundedly rational human nature and thus likely to be detrimental to performance. When a downward deviation occurs after a recent stockout, which is the condition in which censorship bias exists, we expect it to have a higher likelihood of a subsequent stockout.
Conditional on a downward deviation, when there has been a recent stockout, the likelihood of a stockout is higher relative to when there has not been a recent stockout.
Because any downward deviation from an ASR proposal increases the likelihood of a stockout, the baseline of this hypothesis is that a downward deviation is made, the question being only whether it is made after a recent stockout, which is the condition that induces censorship bias. In both cases, it is possible that the deviation is either informed or not, but if the hypothesis is supported, it means that a large part of the downward deviations made after a recent stockout are detrimental, thus supporting the idea that the behavior in Hypothesis 1 can be considered uninformed or biased.
4. Empirical Context and Methods
4.1. Setting and Data
We examine our research questions by collaborating with a retail optimization software provider that is recognized as the industry leader by software vendor rankings (Lund et al. 2025). We collected two data sets from one of this software provider’s customers, an upmarket European supermarket chain. Following the approach of van Donselaar et al. (2010), we used the first data set to test our hypotheses and the second to test a policy based on the results of the hypothesis testing. The two data collection periods are separated by one year, and each data set involves four months of ordering decisions. The studied supermarket chain had implemented the ASR system more than three years prior to the first data collection period. Like in van Donselaar et al. (2010), our first data set is from three store locations, whereas the second data set is from two other locations. All five stores are in different cities, which are the five largest cities of the primary market of the studied supermarket chain. In this chain, store personnel’s interactions with customers provide them with private information on demand signals that may make discretionary power useful. If these interactions signal a decreasing demand for a SKU, store personnel can deviate downward from ASR proposals, particularly in perishable product groups, despite the increasing risk of stockouts. Of course, a stockout may occur even without a downward deviation. However, if a stockout occurs after a downward deviation, it presumably occurs earlier than it would have otherwise occurred and worsens the lost sales. This is what we call a self-inflicted stockout. Although inventory minimization and spoilage avoidance are essential for operational efficiency, stockouts are a source of great concern for grocery retailers because they lead to customer complaints, loss of intended purchases (Gruen et al. 2002), and reduced revenues in the long term (Anderson et al. 2006), as customers are driven to try competitors’ products (Gruen and Corsten 2007). The negative implications of stockouts are an even greater concern for upmarket retailers for which customer satisfaction is vital. Thus, it is imperative to discern downward deviations tainted by biases from those triggered by decision makers’ private information.
The phenomenon of interest of this study should manifest itself most prominently in perishable products because our interactions with grocery retail professionals indicate that, because of spoilage concerns, users of ASR systems are particularly alert to conducting downward deviations in the case of perishable SKUs. Additionally, past research has associated product perishability with suboptimal ordering decisions (Bloomfield and Kulp 2013). In addition, perishable products account for a considerable part of grocers’ revenue, yet previous field research has concentrated on nonperishables (e.g., van Donselaar et al. 2010). We focus on two perishable product groups: packaged meat products and nonfrozen ready-made meals. This choice stems from several reasons. First, SKUs of these product groups are handled in integer piece quantities, whereas SKUs of many other perishable product groups are handled in weight units (e.g., fruits, fresh meats, and fish). Records in integer piece quantities make the operationalization of stockouts unambiguous. Second, we wanted to avoid promotional effects and collected a sample that contains no SKUs on promotional campaigns. Avoiding campaigns would have been harder in many other perishable product groups, such as dairy products. Third, these two product groups were of great interest to the supermarket chain. Across the three locations in the hypothesis-testing data set, these product groups comprise 472 SKUs, yielding 1,416 SKU–location combinations. These data provide us with SKUs that are different in many characteristics, such as margin, demand volatility, substitutability, forecasting error, and on-hand inventory. Hence, we are able to disentangle the impact of product characteristics from that of censorship bias and to control for previously reported antecedents of deviations from ASR proposals (van Donselaar et al. 2010).
We collected data from two periods that are separated by one year, each period containing 12 weeks of replenishment decisions, including 57 days when ASR proposals were created. On average, a SKU has 2.5 such days per week, ranging from 1 to 5. The units of analysis are the daily decisions per SKU in each store. In total, the data consist of 20,787 ordering decisions. The performance outcome we are interested in is whether a stockout occurs in the period between the arrival of the ordered replenishment and the next possible replenishment, the so-called order coverage period. This period ranges from one to seven days. The lead times from placing the order to replenishment are known and reliable, ranging from two to four days. The expected lead time and actual lead time are different for only 267 out of 11,330 nonzero ASR proposal cases, suggesting that unavailability of supply could not be an alternative explanation to the studied phenomenon. We planned the data collection to exclude all major public holidays to avoid abnormal patterns, yet it was impossible to avoid one minor (Saturday) holiday. We explain in Section 4.2.4 and in the online supplement how we control for its potential impact.
In each store, there is one designated ASR system user for each product group. The ASR system produces proposals based on time-series forecasting and newsvendor optimization algorithms taking into account the current inventory level, both of which are black boxes to the user, which is typically the case in studies on the use of advanced decision support systems (e.g., Sun et al. 2022). Each user views ASR proposals for all SKUs within their product group and either adjusts them or confirms them as they are. A downward deviation is recorded when the final purchase order is less than the ASR proposal. The screen layout uses the term “sales,” not “demand,” when referring to past sales; hence, if users are susceptible to censorship bias, it is not due to a misleading user interface. Users in our setting have no budget restrictions when adjusting and confirming their orders. Neither do they receive any individual performance-based incentives. They receive a fixed salary, and the only variable component of their pay is a bonus based on annual store profits. Thus, they are incentivized to maximize profit, which is in line with the incentives of the supermarket chain. One limitation of this data set is that individual characteristics of the designated ASR system users are unknown. However, by controlling for the fixed effects of store locations and product groups, as well as their interactions, we alleviate the potential impacts of this limitation. As there is one designated user for each product group in every location, the controls capture the individual traits that may affect deviation behavior, such as risk preferences or cognitive abilities. Another limitation is that, like other studies on worker discretion in the use of decision support systems (e.g., Elmaghraby et al. 2015, Kesavan and Kushwaha 2020), we cannot report the proprietary algorithms employed by the ASR system because of their confidentiality. Although these algorithms are unknown to us, the software provider indicated this ASR system has no bias toward understocking or overstocking; hence, it does not overpenalize spoilage over stockouts or vice versa.
4.2. Measures
4.2.1. Dependent Variables.
The main dependent variables of this study are downward deviation decisions and stockouts. Downward Deviation is a binary variable indicating that the final purchase order quantity is less than the ASR proposal. Stockout is a binary variable indicating that the inventory count goes to zero during the order coverage period (i.e., the interval between the arrival of the ordered replenishment and the next possible replenishment).
4.2.2. Independent Variables.
Because censorship bias can only exist after a stockout, we analyze it with a binary variable, Recent Stockout, that equals one if a SKU’s inventory has gone to zero at the same location in the previous seven days (alternative time windows are used in the online supplement). For Hypothesis 1, the expected coefficient of this variable is positive. For Hypothesis 2, we expect a positive coefficient for the interaction between Recent Stockout and Downward Deviation.
To evaluate the relative prevalence and implications of censorship bias, we compare its impact with that of anchoring bias (Tversky and Kahneman 1974). We create several alternative operationalizations to capture anchoring bias, including variables based on past sales. The operationalization used in the main analysis is based on past purchase orders because of their saliency to the ASR system users and because the effect of that operationalization is the strongest. In this way, we obtain the most conservative estimate for the relative significance of censorship bias. We operationalize a driver of anchoring bias in the form of Relative Proposal Size to the mean of the past seven (alternative time windows are used in the online supplement) days’ purchase orders for the SKU in the same location:
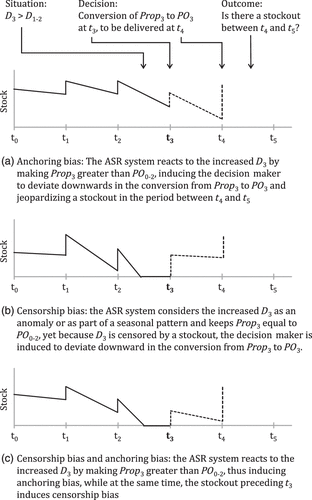
Figure 2 shows functioning of the two biases with three simplified stock-quantity graphs. The process is the same in all three panels: at time t, the ASR system produces a proposal based on the demand rate in the period between t and t − 1. The decision maker converts into a purchase order (it may be that is not equal to because of either private knowledge or biases), which will be then delivered and added to the stock at t + 1. (For simplicity, order coverage period and order delivery time are equal in these illustrations.) Our Hypothesis 1 predicts situations when < , whereas our Hypothesis 2 predicts stockouts between t + 1 and t + 2 (i.e., in the order coverage period of ). If censorship bias is present, the decision maker considers the units sold between t and t − 1 in the ordering decision even though they may not correspond to when a stockout has occurred. If anchoring bias is present, the decision maker compares to the past purchase orders. Both biases can result in decisions to deviate downward from the ASR proposal as well as to subsequent stockouts. The three graphs show how the two biases can function either independently or simultaneously.
4.2.3. Controls.
Our control variables are ASR Proposal Size and Deviation Size, both winsorized at the 1% tails in our main analyses. We include ASR Proposal Size to predict downward deviations and stockouts. We expect a positive coefficient in predicting downward deviations because as an ASR proposal gets larger, users’ inclination to deviate downward would increase. Note that the effect of ASR Proposal Size is different from that of Relative Proposal Size (associated with anchoring bias), which reflects the reaction to a large or small ASR proposal relative to past purchase orders. By controlling for ASR Proposal Size, we capture the reaction to seeing a large number as an ASR proposal. The expected coefficient of ASR Proposal Size is negative in predicting a stockout because a large ASR proposal leads to a large purchase order quantity, as long as there is no downward deviation, whose effect we capture with Deviation Size. In addition to capturing user’s reaction to seeing a large or small ASR proposal, ASR Proposal Size accounts for the impact of previous deviations. For example, there could be a carryover effect, such that after deviating upward from an ASR proposal, users might deviate downward in the next decision (i.e., order advancement behavior studied by van Donselaar et al. (2010)). Although this will be further examined in the online supplement, controlling for ASR Proposal Size already mitigates this concern because the inventory level caused by the previous deviation decision is considered by the ASR system when it creates the next proposal.
Deviation Size is the ASR proposal minus the purchase order quantity; therefore, larger positive values indicate larger downward deviations from the ASR proposal. We control for Deviation Size because we are interested in the stockout effect of the reason that drives downward deviations, namely, censorship bias. Controlling for Deviation Size allows us to obtain a more purified effect of Recent Stockout. Another reason to control for Deviation Size is to eliminate the possible confounding effects of our exclusion restrictions. As will be explained in Section 4.3, it is desirable to have variables that have an impact on downward deviation decisions and that do not correlate with the error term of the outcome equation in a recursive bivariate probit model (Liu et al. 2019). By controlling for Deviation Size in the second equation, we are able to account for the effects of the exclusion restrictions on the likelihood of a stockout. This is because as the effects of valid exclusion restrictions intensify, it may be that not only does ASR system users’ inclination to deviate downward increase, but also their inclination to make larger deviations. Thus, the effect of the exclusion restrictions on the likelihood of a stockout would be carried by the effect of Deviation Size. The expected coefficient of Deviation Size is positive.
Including ASR Proposal Size and Deviation Size as control variables also allows us to account for the demand uncertainty of a SKU and decision makers’ possible tendency to underestimate that uncertainty (Ren and Croson 2013). ASR Proposal Size partially captures demand volatility, as the system recommends larger proposals for SKUs with more variable demand. As for Deviation Size, a higher value may stem from decision makers’ underestimation of demand variance because that would lead them to perceive the ASR proposal as too large and adjust it downward.
We use fixed effects to control for locations, product groups, the interactions of locations and product groups, proposal weekdays, and weeks. The reason for adding interactions of locations and product groups is to capture the ASR system users’ characteristics. As explained before, there is one designated user for each product group in each location. Therefore, the interactions of these two fixed effects capture the individual traits of each designated user. We control for seasonality and other time-based effects with the fixed effects for proposal weekdays and weeks.
4.2.4. Exclusion Restrictions.
In our hypothesis testing, downward deviation decisions are endogenous. To account for this endogeneity when estimating the performance effects of deviations, we use a recursive bivariate probit model (Maddala 1983). Although this model can be identified without exclusion restrictions (Hong et al. 2021), it is desirable to include at least one additional variable in the first equation (Liu et al. 2019) where we predict downward deviations; hence, we turn to the literature on discretionary behavior in ordering and forecasting decisions. In particular, we use the variables studied by van Donselaar et al. (2010) and Khosrowabadi et al. (2022).
We measure Case Pack Coverage the same way as van Donselaar et al. (2010): the ratio of a SKU’s case pack size to the average weekly sales of that SKU. We winsorize this variable at the 1% tails. The expected effect is negative as the larger the case pack coverage, the more abrupt the implications of a deviation. Because downward deviations entail a stockout risk, large case pack coverage may have a discouraging effect on making any deviation. Our measure of On-Hand Inventory, winsorized at the 1% tails, is the ratio of the decision day’s ending inventory of a SKU to the weekly average of the daily end inventory balances of that SKU. It is effectively a reversed measure of the net shelf space studied by van Donselaar et al. (2010). We could not use precisely the same measure because our data do not contain fixed shelf space allocations for the SKUs. The expected effect is positive, meaning that extensive on-hand inventory encourages downward deviations. Our measure of Item Size is the area defined by the width and height of the package because that was how size was defined in our data, instead of the three-dimensional volume studied by van Donselaar et al. (2010). Because van Donselaar et al. (2010) showed that store managers prefer to receive larger items earlier, we expect size to be negatively related to downward deviations. We measure Margin as van Donselaar et al. (2010) do, as the absolute profit margin of the SKU, but we also tested that all the effects would remain the same had we used the percentage unit profit margin instead. The expected effect is negative, meaning that decision makers are less willing to accept the stockout risk associated with downward deviations when the SKU has a higher profit margin. We winsorize this variable at the 1% tails. The measure of Variety is the number of other SKUs in the same subgroup of products, and the expected effect is negative because wide variety is typically a response to lower substitution (van Donselaar et al. 2010), leading to higher lost sales in the case of a stockout and hence reducing ASR system users’ inclination toward downward deviations. To analyze the effect of demand uncertainty, van Donselaar et al. (2010) studied two variables: Seasonality Error and Forecast Dispersion. We replicate their approach by measuring the former as the root mean squared error of the differences between the last seven days’ daily demands and the seasonality pattern predicted by the past demand. The latter is measured as the weekly standard deviation of the daily forecast errors from a trend-based forecast model divided by average sales. As uncertainty encourages buffering, we expect a negative effect for both. We winsorize Seasonality Error and Forecast Dispersion at the 1% tails.
From the exploration of forecast adjustments by Khosrowabadi et al. (2022), we employ Hot Day, Cold Day, Sales, Price, Discount, Day Before Holiday, and Holiday. As the authors did not speculate on expected directions, we likewise report only operationalizations here. Hot Day and Cold Day are binary variables indicating whether the order coverage period includes any day whose temperature falls in the top or bottom 10% of the 30-year historical distribution for the same calendar date. Sales is the decision day’s sales relative to the mean of the last week’s sales. Price is the SKU’s store price on the decision day. We winsorize Sales and Price at the 1% tails. Discount is a binary variable equal to one if the SKU will be discounted during the order coverage period. We have only one holiday in the data by design. To control for its impact, we create two variables following the approach of Khosrowabadi et al. (2022): Day Before Holiday and Holiday. Day Before Holiday is a binary variable taking the value one if the order coverage period includes the day before the holiday. Holiday is a binary variable, equal to one if the coverage period includes the holiday.
We provide the descriptive statistics of all variables in Table 1.
4.3. Empirical Strategy
ASR system users’ decisions to deviate downward are endogenous. Unobserved factors may affect both downward deviation decisions and stockouts. To mitigate this, we employ a recursive bivariate probit model, allowing us to estimate the effect of a binary endogenous variable on a binary outcome even when unobserved factors are present (Maddala 1983, Liu et al. 2019). This model has been used by Liu et al. (2019) and Hong et al. (2021) to examine the effects of rescheduling on patients’ no-show behaviors and direct messaging on hiring decisions, respectively. We complement our analysis with other models, including an endogenous switching regression model (Amemiya 1984) and an SUR model (Zellner 1962) in the online supplement. By employing a recursive bivariate probit model as our main strategy, we are able to take into account the possibility that the driver of censorship bias, a recent stockout, may cause future stockouts regardless of the deviations.
Our model includes two equations: one for the treatment (downward deviation) and one for the outcome (stockouts). The decision to deviate downward from the ASR proposal is binary. The probit model to estimate it takes the following form:
In this equation, the effects of the exclusion restrictions from van Donselaar et al. (2010) and from Khosrowabadi et al. (2022) are represented by – and –, respectively. In the second equation, the outcome variable is Stockout, also a binary variable. We model it through a probit model defined by a latent variable, which takes the following form:
5. Results
5.1. Determinants of Deviations
To investigate whether Recent Stockout drives downward deviations from ASR proposals, Table 2 presents estimation results for the first equation, with robust standard errors multiway clustered at the location and product-group levels. We observe that not all exclusion restrictions borrowed from van Donselaar et al. (2010) and Khosrowabadi et al. (2022) are significant in predicting downward deviations. When we remove the insignificant exclusion restrictions from the specification, the significance level and the sign of the estimated coefficient of Recent Stockout (censorship bias) do not change in either equation. Therefore, we report results from the model with all exclusion restrictions. From van Donselaar et al. (2010), Item Size and Variety are significant and in the expected direction when predicting downward deviations. From Khosrowabadi et al. (2022), Price and Hot Day are significant in predicting downward deviations. The main control variable, ASR Proposal Size, is positive and significant, showing that ASR system users are more likely to deviate downward when they see a large proposal. The main independent variable, Recent Stockout, has a positive and significant coefficient (), supporting Hypothesis 1. This coefficient estimate means that when a SKU has a recent stockout, its designated ASR system user counterintuitively orders a smaller quantity of that SKU than the ASR system proposes, which is a behavior aligned with censorship bias. Also, the estimated effect of Relative Proposal Size is positive and significant (), indicating that the decision makers’ behaviors are also in line with anchoring bias.
The average marginal effects (AMEs) show that when there has been a recent stockout, the likelihood of a downward deviation from the ASR proposal increases by 1.9 percentage points. Given the 8.6% base rate of deviations (Table 1), this is not a trivial difference (22% increase). However, the effect of the Relative Proposal Size is greater at 3.5 percentage points, indicating that anchoring bias is a stronger predictor than censorship bias () for the downward deviations from the ASR proposals.
|

Table 1. Descriptive Statistics and Correlations
| 1 | 2 | 3 | 4 | 5 | 6 | 7 | 8 | 9 | 10 | 11 | 12 | 13 | 14 | 15 | 16 | 17 | 18 | 19 | 20 | |
|---|---|---|---|---|---|---|---|---|---|---|---|---|---|---|---|---|---|---|---|---|
| Mean | 0.086 | 0.073 | 0.173 | 0.087 | 5.441 | 5.820 | 1.073 | 16.084 | 0.343 | 6.514 | 0.159 | 1.253 | 1.175 | 2.701 | 0.010 | 0.159 | 0.344 | 0.057 | 0.035 | 0.369 |
| SD | 0.280 | 0.260 | 0.379 | 1.390 | 7.905 | 6.151 | 0.844 | 15.306 | 0.301 | 5.361 | 0.149 | 1.565 | 2.542 | 1.130 | 0.101 | 0.366 | 0.475 | 0.231 | 0.184 | 3.021 |
| Min | 0 | 0 | 0 | −1 | 0 | 0.012 | 0 | 5 | −0.146 | 0 | 0 | 0 | 0 | 0.857 | 0 | 0 | 0 | 0 | 0 | −12 |
| Max | 1 | 1 | 1 | 5 | 40 | 36 | 5.529 | 60 | 1.425 | 21 | 0.847 | 11.757 | 20.801 | 6.930 | 1 | 1 | 1 | 1 | 1 | 16 |
| 1. Downward Deviation | ||||||||||||||||||||
| 2. Stockout | 0.185* | |||||||||||||||||||
| 3. Recent Stockout | 0.046* | 0.182* | ||||||||||||||||||
| 4. Relative Proposal Size | 0.360* | −0.002 | 0.026* | |||||||||||||||||
| 5. ASR Proposal Size | 0.262* | −0.072* | −0.088* | 0.456* | ||||||||||||||||
| 6. Case Pack Coverage | −0.027* | 0.022* | −0.017* | −0.106* | −0.233* | |||||||||||||||
| 7. On-Hand Inventory | −0.083* | 0.002 | 0.168* | −0.253* | −0.169* | 0.026* | ||||||||||||||
| 8. Item Size | −0.008 | −0.103* | −0.172* | −0.079* | 0.102* | 0.204* | −0.018* | |||||||||||||
| 9. Margin | 0.008 | −0.104* | −0.166* | −0.009 | 0.172* | −0.046* | −0.050* | 0.334* | ||||||||||||
| 10. Variety | −0.051* | −0.006 | −0.020* | −0.012 | −0.018* | 0.007 | −0.004 | 0.136* | 0.050* | |||||||||||
| 11. Seasonality Error | −0.004 | 0.067* | 0.093* | 0.003 | −0.121* | 0.036* | 0.055* | −0.069* | −0.064* | 0.084* | ||||||||||
| 12. Forecast Dispersion | −0.009 | −0.030* | −0.019* | 0.005 | −0.048* | −0.010 | 0.004 | −0.065* | −0.032* | −0.040* | −0.007 | |||||||||
| 13. Sales | −0.002 | 0.014* | 0.000 | 0.067* | −0.023* | 0.065* | 0.080* | −0.028* | −0.041* | −0.004 | 0.055* | 0.027* | ||||||||
| 14. Price | 0.013 | −0.010 | −0.027* | −0.042* | −0.081* | 0.148* | −0.013 | 0.279* | 0.513* | 0.004 | −0.013 | −0.082* | −0.013 | |||||||
| 15. Discount | −0.014* | 0.010 | 0.002 | −0.067* | −0.059* | −0.011 | 0.114* | −0.016* | 0.027* | −0.006 | −0.004 | 0.063* | 0.013 | −0.088* | ||||||
| 16. Cold Day | 0.018* | 0.027* | 0.057* | 0.000 | −0.032* | 0.017* | 0.007 | 0.007 | −0.033* | −0.024* | 0.134* | −0.023* | 0.022* | −0.003 | −0.013 | |||||
| 17. Hot Day | 0.029* | −0.011 | −0.021* | −0.005 | 0.069* | 0.038* | −0.045* | 0.064* | 0.083* | 0.012 | 0.020* | 0.018* | −0.035* | 0.032* | 0.023* | −0.243* | ||||
| 18. Day Before Holiday | −0.030* | −0.023* | 0.006 | 0.005 | 0.029* | 0.026* | −0.044* | 0.015* | 0.004 | 0.007 | −0.064* | 0.054* | −0.017* | 0.010 | −0.021* | −0.107* | 0.144* | |||
| 19. Holiday | −0.009 | −0.022* | −0.004 | 0.003 | 0.048* | 0.047* | −0.035* | 0.037* | 0.029* | 0.003 | −0.058* | 0.035* | 0.001 | 0.023* | −0.017* | −0.083* | 0.264* | 0.780* | ||
| 20. Deviation Size | 0.741* | 0.151* | 0.039* | 0.283* | 0.268* | 0.017* | −0.053* | 0.001 | −0.013 | −0.034* | 0.000 | −0.011 | −0.001 | −0.008 | −0.008 | 0.018* | 0.025* | −0.017* | −0.005 |
Notes. Descriptive statistics and the correlation vector of the Deviation Size variable are calculated for the sample where the downward deviation is one. SD, standard deviation.
*p < 0.05.
|
Table 2. Effect of Censorship Bias on Downward Deviations
| Coefficients | AME [95% confidence interval] | |
|---|---|---|
| Constant | −3.014*** | |
| ASR Proposal Size | *** | 0.004 [0.002, 0.007] |
| Case Pack Coverage | −0.001 [−0.002, 0.0003] | |
| On-Hand Inventory | 0.023 | 0.003 [0.00003, 0.007] |
| Item Size | −0.007** | −0.001 [−0.001, −0.0005] |
| Margin | −0.002 [−0.035, 0.031] | |
| Variety | −0.015*** | −0.001542 [−0.002, −0.001] |
| Forecast Dispersion | −0.001 [−0.007, 0.005] | |
| Seasonality Error | 0.271 | 0.029 [−0.010, 0.068] |
| Sales | −0.001 [−0.004, 0.002] | |
| Price | 0.093*** | 0.010 [0.002, 0.017] |
| Discount | −0.023 [−0.058, 0.011] | |
| Cold Day | −0.008 [−0.033, 0.018] | |
| Hot Day | 0.236*** | 0.025 [0.012, 0.039] |
| Day Before Holiday | −0.054 [−0.107, −0.002] | |
| Holiday | 0.490 | 0.064 [−0.093, 0.220] |
| Relative Proposal Size | 0.335*** | 0.035 [0.031, 0.039] |
| Recent Stockout | 0.172* | 0.019 [0.002, 0.037] |
| Adjusted pseudo-R² | 0.33 | |
| N | 20,787 |
Notes. The specification includes fixed effects to control for locations, product groups, proposal weekdays, weeks, and the interactions of locations and product groups. Robust standard errors, multiway clustered at the location and product group, are in parentheses.
*p 0.05; **p 0.01; ***p 0.001.
5.2. Performance Implications of Downward Deviations and Censorship Bias
To assess the performance implications of downward deviations from ASR proposals, in Table 3, we present the estimation results of the second equation with robust standard errors multiway clustered at the location and product-group levels. ASR Proposal Size and Deviation Size have significant () effects in the expected directions. The positive and significant coefficient () of the interaction between Downward Deviation and Recent Stockout supports Hypothesis 2, indicating that when a downward deviation is susceptible to censorship bias, it is likely to lead to a stockout. Also, the coefficient of the interaction between Downward Deviation and Relative Proposal Size is positive and significant (), suggesting that when a downward deviation is susceptible to anchoring bias, it is likely to lead to a stockout. Table 3 also shows that is significantly different from zero, indicating correlated unobservables between the treatment and outcome equations. This supports the presence of endogeneity and justifies the use of the recursive bivariate probit model.
|
Table 3. Effect of Censorship Bias on Stockouts
| Dependent variable: Stockout | Coefficients |
|---|---|
| Constant | *** |
| ASR Proposal Size | *** |
| Downward Deviation | 0.817*** |
| Deviation Size | 0.088*** |
| Relative Proposal Size | −0.171*** |
| Recent Stockout | 0.542*** |
| Downward Deviation × Relative Proposal Size | 0.194*** |
| Downward Deviation × Recent Stockout | 0.218*** |
| −0.179* (0.079) | |
| N | 20,787 |
Notes. The specification includes fixed effects to control for locations, product groups, proposal weekdays, weeks, and the interactions of locations and product groups. Robust standard errors, multiway clustered at the location and product group, are in parentheses.
*p 0.05; ***p 0.001.
Regarding effect sizes, Figure 3 shows the postestimation of predicted stockout probabilities obtained by drawing 1,000 coefficient vectors from the estimated model and its variance–covariance matrix. In particular, on the right side of Figure 3, we examine four combinations of Recent Stockout and Downward Deviation (0/1 × 0/1) so that we can also assess whether a recent stockout independently drives future stockouts, irrespective of deviation status. On the left side for Relative Proposal Size, which is continuous, we construct four analogous scenarios by evaluating the effects at its minimum and maximum values and interacting these with Downward Deviation (0/1). We observe that, consistent with Hypothesis 2, the probability of a future stockout is substantially higher when a downward deviation is made following a recent stockout: 0.37 compared with 0.15, a 22-percentage-point increase. In the anchoring bias analysis, despite the statistical significance of the interaction effect in Table 3, the substantial overlap between the two density distributions (relative proposal size = minimum × downward deviation = 1 and relative proposal size = maximum × downward deviation = 1) suggests that the effect is not discernible. Thus, we conclude that even though censorship bias is not as strong as anchoring bias in predicting deviations from ASR proposals, when censorship bias does trigger a downward deviation, the consequences are very likely to be severe.
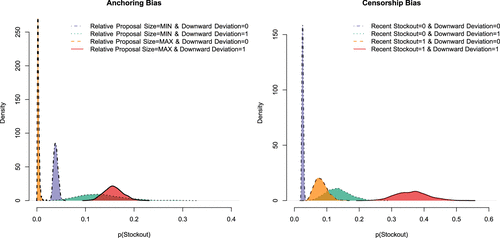
Notes. Predicted stockout probabilities are simulated using 1,000 draws from the estimated coefficient distribution. The right panel illustrates the result on Hypothesis 2, showing the combinations of Recent Stockout (0/1) and Downward Deviation (0/1). The left panel shows Relative Proposal Size at its minimum and maximum values interacted with Downward Deviation (0/1). All other covariates are held at their sample means.
5.3. Robustness Checks and Alternative Explanations
We discuss various alternative model specifications to test the robustness of our results in the online supplement. These include endogenous switching regression (Amemiya 1984), SUR (Zellner 1962), and many others. All of them make different assumptions, but they all yield results that support our hypotheses. We also test alternative operationalizations for censorship bias, anchoring bias, and deviation size; use Stockout Days as the dependent variable; test the hypotheses on early and late stockouts separately; and conduct a number of other additional robustness tests, including the consideration of demand chasing behavior (Lau and Bearden 2013). Although demand chasing is typically treated as a behavioral bias in laboratory settings, where demand in each period is assumed to be independent of prior periods, in field settings, demand is typically serially correlated; therefore, we did not model demand chasing as a bias in our main specification. Nevertheless, as a robustness check, we include a measure of demand chasing to assess whether accounting for it alters the estimated effect of censorship bias. Again, all results support our hypotheses on a positive association between censorship bias, downward deviations, and self-inflicted stockouts.
In the online supplement, we also explore alternative explanations for why decision makers may order less than ASR proposals after a recent stockout. We conclude that our hypothesized effects hold after accounting for reactions to the ASR system’s lost-sales estimation, safety stock ignorance, order advancement (van Donselaar et al. 2010), workload leveling, or attention-related factors.
6. Policy Implications of Censorship Bias
Consistent with censorship bias, the results showed that recent stockouts trigger downward deviations from ASR proposals, and when this happens, the likelihood of a stockout increases. These findings can help retailers make better use of their ASR systems. It is possible to configure an ASR system to prevent users’ actions, or to alert the users, if they are trying to deviate under prespecified conditions. Our results inspire the idea of blocking downward deviations susceptible to censorship bias, that is, when they are performed after a recent stockout. This would obviously not eliminate all potentially harmful deviation decisions, but it would address one form of uninformed decision without completely forbidding users from making deviations when they have private information about a forthcoming slump in demand. Of course, blocking any downward deviation will reduce stockouts, and our results indicate that blocking them after a recent stockout (within the past seven days) would do so very effectively, yet what the results do not show is the potential downside in terms of inventory costs, the reduction of which is the whole purpose of allowing ASR system users to order less than proposed. To explore the performance effects of the blocking policy, we collected a second data set from two additional stores of the same supermarket chain one year after the first data collection, as explained in Section 4.1. The new data set includes 320 SKUs from the same product groups and a total of 3,901 proposals with 842 downward deviations, 154 of which led to stockouts. We call these self-inflicted stockouts because even if a stockout would have occurred in any case, a downward deviation made it occur earlier and resulted in greater lost sales.
To evaluate the policy of blocking downward deviations that are susceptible to censorship bias (Block Censored), we also test the practical implications of two other policies. The first is based on the literature on forecast adjustments, suggesting that small adjustments to algorithmic forecasts tend to decrease forecasting performance (Fahimnia et al. 2019). Hence, it might be a good idea to establish a policy of blocking downward deviations that are small (Block Small). However, our empirical results suggest the opposite policy: the significant effect of Deviation Size on Stockout (Table 3) indicates that it might be a good idea to block downward deviations when users are trying to make large adjustments (Block Large). We operationalize these two policies based on the mean size of downward deviations in the second data set (eight units). In Block Small, a downward deviation is blocked if it is smaller than the mean; in Block Large, it is blocked if it is larger than the mean. Because there is no obvious best definition for a small or large deviation, we repeat these policies with the cutoff being between one (small) and more case packs (large) of the SKU in question. We report the results from the mean-based operationalization, yet we note that the insights would have been the same from the case pack–based operationalization. In total, we would have blocked 65.2%, 34.8%, and 15.2% of downward deviations under the policies Block Small, Block Large, and Block Censored, respectively.
Block Small would have led to the blocking of 549 downward deviations. To assess whether this would have been beneficial, we check whether the inventory count went to zero during the order coverage period after each downward deviation. If it did, then blocking the downward deviation would have been a good policy. If the inventory count did not go to zero, the blocking should not have been done because the downward deviation actually saved some inventory costs without inflicting a stockout. Of the 549 blocked deviations under Block Small, the policy would have been good 111 times, constituting a 72.08% reduction in the self-inflicted stockouts. To assess the profit implications of this reduction in self-inflicted stockouts, we use the sales forecasts that we created for the robustness-testing purposes, as explained in the online supplement, Section 2.1. For good blocking decisions, we calculate the extra quantity that could have been sold and obtain the associated extra profit. We find that Block Small would have led to an increase of 0.60% in estimated incremental profit from avoided lost sales, where incremental profit is calculated using SKU-level unit profit margins applied to the additional quantity that could have been sold. To estimate the incremental inventory holding cost generated by blocked deviations, we first calculate the additional stock retained under the policy. We then value this extra inventory using the SKU unit cost multiplied by its spoilage propensity, which serves as our proxy for the expected carrying and waste-related cost. Table 4 shows that Block Small would have increased the inventory holding costs of the affected SKUs by 4.10%. Thus, even if we take into account that the average SKU unit profit is 4.14 times the estimated inventory holding cost in this data set, the policy would not have been profitable (0.60% × 4.14 < 4.10%).
|
Table 4. Profit–Cost Trade-Offs Across Blocking Policies
| Block Small | Block Large | Block Censored | |
|---|---|---|---|
| Number of downward deviations blocked | 549 | 293 | 128 |
| Reduction in self-inflicted stockouts (%) | 72.08 | 27.90 | 33.10 |
| Change in profits (%) | +0.60 | +1.34 | +1.05 |
| Change in inventory holding costs (%) | +4.10 | +3.58 | +1.02 |
| Assessment | Not profitable | Profitable | Most profitable |
Notes. Across the analyzed SKUs, the average unit profit margin is 4.14 times the estimated inventory holding cost. Using this ratio, the profit increase from the Block Large policy just exceeds the associated increase in inventory holding costs, whereas the profit increase from Block Censored is over four times greater than the increased inventory holding costs from that policy.
Block Large would have led to the blocking of 293 downward deviations. To assess whether blocking these deviations would have been beneficial, we follow the same logic as above. This time, the policy would have been good 43 times, resulting in a 27.90% reduction in self-inflicted stockouts. Using the aforementioned sales forecasts, we find that the estimated incremental profit from avoided lost sales would have been 1.34%. We also assess the inventory implications in the same way as above, finding that Block Large would have increased the total inventory holding costs of the affected SKUs by 3.58%. Table 4 shows that Block Large would have been profitable given that the average SKU unit profits are 4.14 times the inventory holding costs.
Finally, the policy to counter censorship bias, Block Censored, would have led to the blocking of 128 downward deviations. To assess whether blocking these downward deviations would have been beneficial, we follow the same logic as earlier and find that the policy would have been good 51 times, resulting in a 33.10% reduction in self-inflicted stockouts. Employing the same approach as previously, we find that Block Censored would have increased estimated incremental profit from avoided lost sales by 1.05% and the total inventory holding costs of the affected SKUs by 1.02%. As summarized in Table 4, using the average ratio of SKU-level unit profit margins to estimated inventory holding costs (4.14:1), the 1.05% increase in estimated incremental profit under Block Censored compared with the 1.02% increase in inventory holding costs implies that the policy’s estimated benefit is slightly more than four times its estimated cost.
In conclusion, the estimated profits and inventory holding costs favor the Block Censored policy over the Block Small and Block Large policies. We note that the profit increase percentages may be conservative as we considered only the lost profits in estimating the benefit of stockout avoidance. Had we given any value to avoiding the damage to customer satisfaction, loyalty, and brand reputation, the benefits of the blocking policies would have increased accordingly. A recent study in grocery retail estimates these so-called compensation costs as six times the value of lost profits (Lim et al. 2025). Applying such a multiplier here would make the benefit of the Block Censored policy more than 28 times its cost, and the benefits of Block Small and Block Large more than 4 and 10 times their costs, respectively. Yet, our simulations also abstract from several managerial responses that may mitigate stockout harm in practice, including product substitution across similar SKUs, pack-size substitutions, and temporary assortment adjustments. When such responses are feasible, the operational and financial impacts of a stockout may be smaller than estimated here.
7. Discussion
Retailers employ ASR systems because these systems improve store performance by balancing shelf availability and inventory holding costs. Yet, retailers may not be maximizing the effectiveness of these systems because the ASR system users are allowed to deviate from the proposals, and besides improving ordering decisions with their private insights, they may make deviations that are driven by cognitive biases. Using data from a supermarket chain, this study focused on censorship bias, which has been studied previously only in laboratory experiments (Feiler et al. 2013, Rudi and Drake 2014, Tong et al. 2018). The results showed that censorship bias fairly often explains ASR system users’ decisions to deviate downward from ASR proposals and that when the deviations are susceptible to censorship bias, they very often lead to self-inflicted stockouts. The results also showed that the effect of censorship bias on downward deviations is not as strong as that of anchoring bias, but the effect of censorship bias on self-inflicted stockouts is much greater than that of anchoring bias.
This study informs human‒machine interaction research by empirically showing that censorship bias explains a portion of discretionary behavior in the inventory replenishment context. As inventory management is critical for retailers’ performance, behavioral biases that affect inventory decisions should be addressed. To do so, retailers may restructure the process of inventory replenishment. They may use our findings to proactively identify and block downward deviations that are susceptible to censorship bias. Alternatively, instead of blocking the deviations and risking that some informed deviations are prevented, it might be enough to alert the user when their deviation decisions are susceptible to censorship bias. This could potentially activate system 2 processes of the mind, the slower and more intentional, effortful, and logical reasoning processes (Bazerman and Moore 2012), which have been associated with better decision making in the newsvendor setting (Moritz et al. 2013). The findings can also be used in the training of ASR system users so that system 2 processes might be activated autonomously before any deviations are made.
Our results also contribute to the behavioral newsvendor literature by studying the existence and performance implications of two behavioral biases in practice. With regard to censorship bias, we complement the laboratory experiments by studying it with field data. As Tan and Staats (2020) have noted, complementing laboratory experiments with field research strengthens external validity and deepens our understanding of the effects analyzed in the behavioral operations management literature. We show that both censorship and anchoring biases lead to downward deviations and that anchoring bias explains a substantial share of these; however, although both biases have significant performance implications, the effect of censorship bias is stronger. This finding, combined with the fact that demand is often censored in practice, suggests future research could focus more on understanding and mitigating censorship bias. As for the anchoring bias, we complement Sachs et al. (2022) by expanding the anchors that may drive decision making outside laboratory settings. Our alternative operationalizations of anchoring bias may inform future research by highlighting that the anchors used in the experimental research, such as the mean of past demand, might not be applicable in practice where the mean demand may not be stationary and demand data can be censored. Also, our analyses in the online supplement complement the laboratory experiments by corroborating demand chasing and safety stock ignorance behaviors.
Finally, this study has limitations that may inspire future research. First, we do not have individual-level data on ASR system users. Thus, we are unable to directly control for the individual differences in deviation decisions. By controlling for the interactions of product groups and locations, we mitigate the concern that this lack of data may have biased our results. Yet, these controls are not foolproof. Designated users may have had some days off during our data collection, meaning that temporary user changes would not have been captured by the location–product group interactions. Because the ASR software developer and the studied supermarket chain indicated that changes in the designated user are infrequent, we trust that this shortcoming is only causing noise in our analysis. Yet, future research should examine how individual traits, such as risk aversion, user experience, or cognitive capabilities, affect the extent to which decision makers suffer from censorship bias. Second, our study’s empirical context may limit the generalizability of the results. In other contexts, such as in the management of spare parts or medical supplies, stockouts can be more critical than in supermarkets where product groups are often broad to ensure some substitutability. Although we have variance in product variety and control for it like van Donselaar et al. (2010) did, our data have very few single-SKU product groups. Thus, we must leave for future research whether decision makers might be more cautious about censorship bias when procuring less substitutable products. Another possible limitation on the empirical generalizability is that our data include only perishable products. Downward deviations from ASR proposals might be less common for nonperishables, reducing the implications of censorship bias. Yet, in terms of theoretical generalizability, the overall effect is unlikely to differ for nonperishable products, as even in the absence of spoilage risk, excess stock still entails holding costs, and as a cognitive bias, censorship bias is unlikely to depend on the nature of the products. Regardless of whether the product is a ready-made meal or a bottle of shampoo, decision makers may misinterpret stockout-censored sales as demand figures and act accordingly.
The authors thank the staff of the software provider and the participating supermarkets for this research opportunity, as well as department editor Wedad Elmaghraby, an anonymous associate editor, and two anonymous reviewers for insightful comments and suggestions that significantly improved this paper.
References
- (1984) Tobit models: A survey. J. Econom. 24(1–2):3–61.Crossref, Google Scholar
- (2006) Measuring and mitigating the costs of stockouts. Management Sci. 52(11):1751–1763.Link, Google Scholar
- (2006) The Impact of Automatic Store Replenishment on Retail: Technologies and Concepts for the out-of-Stocks Problem (Deutscher Universitätsverlag Wiesbaden, Wiesbaden, Germany).Google Scholar
- (2015) Measuring the impact of stock-keeping unit attributes on retail stock-out performance. Oper. Management Res. 8(3):131–141.Crossref, Google Scholar
- (2012) Judgment in Managerial Decision Making, 8th ed. (John Wiley & Sons, Hoboken, NJ).Google Scholar
- (2013) Durability, transit lags, and optimality of inventory management decisions. Production Oper. Management 22(4):826–842.Crossref, Google Scholar
- (2012) Managers and students as newsvendors. Management Sci. 58(12):2225–2233.Link, Google Scholar
- (2008) Newsvendor “pull-to-center” effect: Adaptive learning in a laboratory experiment. Manufacturing Service Oper. Management 10(4):590–608.Link, Google Scholar
- (2011) Market heterogeneity and local capacity decisions in services. Manufacturing Service Oper. Management 13(1):2–19.Link, Google Scholar
- (2023) Believing in analytics: Managers’ adherence to price recommendations from a DSS. Manufacturing Service Oper. Management 25(2):524–542.Link, Google Scholar
- (2019) Task-dependent algorithm aversion. J. Marketing Res. 56(5):809–825.Crossref, Google Scholar
- (2018) The behavioral traps in making multiple, simultaneous, newsvendor decisions. Preprint, submitted September 7, https://doi.org/10.2139/ssrn.2817126.Google Scholar
- (2015) Algorithm aversion: People erroneously avoid algorithms after seeing them err. J. Experiment. Psych.: General 144(1):114–126. Crossref, Google Scholar
- (2015) Sales force behavior, pricing information, and pricing decisions. Manufacturing Service Oper. Management 17(4):495–510.Link, Google Scholar
- (2019) Behavioral operations and supply chain management—A review and literature mapping. Decision Sci. 50(6):1127–1183.Crossref, Google Scholar
- (2013) Biased judgment in censored environments. Management Sci. 59(3):573–591.Link, Google Scholar
- (2009) Effective forecasting and judgmental adjustments: An empirical evaluation and strategies for improvement in supply-chain planning. Internat. J. Forecasting 25(1):3–23.Crossref, Google Scholar
- (2012) The behavioral theory of the firm: Assessment and prospects. Acad. Management Ann. 6(1):1–40.Crossref, Google Scholar
- (2009) Anchor selection and group dynamics in newsvendor decisions—A note. Decision Anal. 6(2):87–97.Link, Google Scholar
- (2023) Algorithm aversion in delegated investing. J. Bus. Econom. 93(9):1691–1727.Google Scholar
- (2003) Econometric Analysis (Prentice Hall, Upper Saddle River, NJ).Google Scholar
- (2007) A comprehensive guide to retail out-of-stock reduction in the fast-moving consumer goods industry. Technical report, Grocery Manufacturers of America, Washington, DC.Google Scholar
- (2002) Retail out-of-stocks: A worldwide examination of extent, causes and consumer responses. Report, Grocery Manufacturers of America, Washington, DC.Google Scholar
- (2020) Automatic interpretable retail forecasting with promotional scenarios. Internat. J. Forecasting 36(4):1389–1406.Crossref, Google Scholar
- (2022) Forecast adjustments during post-promotional periods. Eur. J. Oper. Res. 300(2):461–472.Crossref, Google Scholar
- (2021) Just DM me (politely): Direct messaging, politeness, and hiring outcomes in online labor markets. Inform. Systems Res. 32(3):786–800.Link, Google Scholar
- (2018) Discretionary task ordering: Queue management in radiological services. Management Sci. 64(9):4389–4407.Link, Google Scholar
- (2020) Field experiment on the profit implications of merchants’ discretionary power to override data-driven decision-making tools. Management Sci. 66(11):5182–5190.Link, Google Scholar
- (2022) Evaluating human behaviour in response to AI recommendations for judgemental forecasting. Eur. J. Oper. Res. 303(3):1151–1167.Crossref, Google Scholar
- (2013) Newsvendor demand chasing revisited. Management Sci. 59(5):1245–1249.Link, Google Scholar
- (2017) Task decomposition and newsvendor decision making. Management Sci. 63(10):3226–3245.Link, Google Scholar
- (2025) Estimating stockout costs and optimal stockout rates: A case on the management of ugly produce inventory. Management Sci. 71(4):3106–3126.Link, Google Scholar
- (2019) Effects of rescheduling on patient no-show behavior in outpatient clinics. Manufacturing Service Oper. Management 21(4):780–797.Link, Google Scholar
- (2019) Algorithm appreciation: People prefer algorithmic to human judgment. Organ. Behav. Human Decision Processes 151:90–103. Crossref, Google Scholar
- (2025) Magic quadrant for supply chain planning solutions. Report, Gartner, Stamford, CT.Google Scholar
- (1983) Limited-Dependent and Qualitative Variables in Econometrics (Cambridge University Press, Cambridge, UK).Crossref, Google Scholar
McKinsey & Company (2020) Future of retail operations: Winning in a digital era. Accessed June 1, 2023, https://www.mckinsey.com/industries/retail/our-insights/future-of-retail-operations-winning-in-a-digital-era.Google Scholar- (2013) Individual differences in the newsvendor problem: Behavior and cognitive reflection. J. Oper. Management 31(1–2):72–85.Crossref, Google Scholar
- (2009) The relative influence of advice from human experts and statistical methods on forecast adjustments. J. Behav. Decision Making 22(4):390–409.Crossref, Google Scholar
- (2015) The effectiveness of field price discretion: Empirical evidence from auto lending. Management Sci. 61(8):1741–1759.Link, Google Scholar
- (2017) Understanding algorithm aversion: When is advice from automation discounted? J. Forecasting 36(6):691–702.Crossref, Google Scholar
- (2013) Overconfidence in newsvendor orders: An experimental study. Management Sci. 59(11):2502–2517.Link, Google Scholar
- (2014) Observation bias: The impact of demand censoring on newsvendor level and adjustment behavior. Management Sci. 60(5):1334–1345.Link, Google Scholar
- (2022) Empirical newsvendor biases: Are target service levels achieved effectively and efficiently? Production Oper. Management 31(4):1839–1855.Crossref, Google Scholar
- (2000) Decision bias in the newsvendor problem with a known demand distribution: Experimental evidence. Management Sci. 46(3):404–420.Link, Google Scholar
- (2016) Nonparametric data-driven algorithms for multiproduct inventory systems with censored demand. Oper. Res. 64(2):362–370.Link, Google Scholar
- (2022) Predicting human discretion to adjust algorithmic prescription: A large-scale field experiment in warehouse operations. Management Sci. 68(2):846–865.Link, Google Scholar
- (2020) Behavioral drivers of routing decisions: Evidence from restaurant table assignment. Production Oper. Management 29(4):1050–1070.Crossref, Google Scholar
- (2018) A behavioral remedy for the censorship bias. Production Oper. Management 27(4):624–643.Crossref, Google Scholar
- (1974) Judgment under uncertainty: Heuristics and biases. Science 185(4157):1124–1131. Crossref, Google Scholar
- (2010) Ordering behavior in retail stores and implications for automated replenishment. Management Sci. 56(5):766–784.Link, Google Scholar
- (1998) An anchoring and adjustment model of purchase quantity decisions. J. Marketing Res. 35(1):71–81.Crossref, Google Scholar
- (2019) Making sense of recommendations. J. Behav. Decision Making 32(4):403–414.Crossref, Google Scholar
- (1962) An efficient method of estimating seemingly unrelated regressions and tests for aggregation bias. J. Amer. Statist. Assoc. 57(298):348–368.Crossref, Google Scholar

