
Identifying Merger Opportunities: The Case of Air Traffic Control
Abstract
Horizontal mergers and acquisitions offer firms the means to grow. However, forecasting these actions’ potential effects on the market is not a simple task. We propose a model that identifies optimal horizontal merger configurations for an industry. The model endogenizes the merger choice by maximizing the overall potential efficiency gain at the level of an industry or firm with multiple branches. We further extend the model to consider mergers that create contiguous firms, should network effects be a consideration. The optimal solution, estimated as a consequence of a change in industry structure, is decomposed into individual learning inefficiencies in addition to harmony and scale effects. The efficiency gains are estimated using a nonradial, directional distance function to facilitate this decomposition. An application of the model to the European air traffic control market suggests that the market ought to be reduced to 4 contiguous firms, replacing the 29 analyzed and the 9 proposed in the Single European Skies initiative. This is likely to lead to overall savings of around €3.3 billion annually, of which approximately 82% is directly attributable to merger synergies. Furthermore, this represents an additional annual saving of €1.2 billion over that achieved by the second best: the Single European Skies initiative.
Funding: N. Adler received partial funding from the Asper Center for Entrepreneurship at the Hebrew University Business School.
1. Introduction
Horizontal mergers and acquisitions remain the most likely form of growth for firms and represent the majority of requests to competition authorities (Stigler 1950, Mueller 1985). Mergers are often a much faster way to achieve large-scale expansion compared with internal investment. Furthermore, Mitchell and Mulherin (1996) argue that the merger route is often the quickest and least-cost method to alter an industry’s structure. Yet, merger requests raise the most skepticism from regulatory authorities, which frequently require companies to prove that the likely advantages to the firm outweigh the deadweight loss because of the reduction in competition (Williamson 1968). There are indeed multiple arguments with respect to their advantages and disadvantages. As described in Gupta and Gerchak (2002), advantages include increased economies of scale, cost efficiencies, operational and financial synergies, diversification, and strategic realignment. Potential disadvantages include the reduced competition, managerial hubris, empire-building, and excessive managerial compensation (Cummins and Xie 2008).
In this research, we refer to horizontal mergers of geographical monopolies such as water distribution, electricity transmission, and air traffic control provision, which are frequently government owned. Consequently, the potential anticompetitive effect normally caused by horizontal mergers, which reduces quantity competition hence increases consumer prices, is less relevant in this context. The premerger structure of the industries of which we are concerned consists of a number of geographical monopolies that, in general, are economically regulated through cost plus, price incentive, or yardstick competition practices (Bogetoft 1997, Vogelsang 2002, Beesley and Littlechild 2013). As a result, the achievement of lower costs from economies of scale, for example, is expected to lead to at least a partial reduction in prices and increased consumer welfare.
1.1. Merger and Nonmerger Synergies
According to Farrell and Shapiro (2001), horizontal mergers may lead to scale economies, which should be separated from merger-specific efficiencies, known as synergies. Scale economies mean that the management overhead and fixed costs of the combined firm are lower than the sum of the relevant costs of each individual firm. They further argue that scale economies can be achieved without a merger, rather through organic growth, hence ought to be discounted when the regulatory authorities analyze a merger request. In oligopolistic markets, a merger that does not create synergies will raise prices, which impacts consumer surplus negatively (Farrell and Shapiro 1990). A nonsynergy merger occurs when a firm’s outputs, prices, and total costs are feasible before and after the merger. This means that no substantial changes in the production process are introduced. As explained in Farrell and Shapiro (1990, p. 112), “In many mergers, the insiders … cannot recombine assets to improve their joint production capabilities. After the merger, the combined entity M can perhaps better allocate outputs across facilities (rationalization), but M’s production possibilities are no different from those of the insiders (jointly) before the merger. In this case, we say that the merger generates no synergies.” This aspect is further discussed in Verge (2010), where it is argued that the best a nonsynergy merger can accomplish though reallocation of output across facilities could have equally been achieved through the coordination of production decisions.
Separating the source of synergies, although undeniably important in an oligopolistic setting, is less imperative and quite confusing when it comes to horizontal mergers of already established and regulated geographical monopolies. In this case, a cost reduction in a price-regulated firm should lead to higher consumer surplus. Indeed, the wording used by Farrell and Shapiro (2001) allows for an interpretation of economies of scale as merger-specific synergies under specific circumstances. Moreover, in the case of network-based monopolistic utilities, only mergers would allow for joint production.
Some of the data envelopment analysis (DEA) models developed to date estimate the potential effects of exogenously determined merger combinations on industries, including Bogetoft and Wang (2005), Wu et al. (2011), Lozano (2013), and Peyrache (2013). Bogetoft and Wang (2005) propose a DEA model that evaluates the a priori potential efficiency gains from exogenous mergers and decomposes the merger’s overall efficiency gain into three categories: (i) learning inefficiencies, (ii) harmony effects, and (iii) scale (size) effects. The model and its decomposition have been successfully implemented in multiple industries, including forestry (Bogetoft et al. 2003), healthcare (Bogetoft and Katona 2008, Kristensen et al. 2010), electricity distribution (Agrell et al. 2015), fishery quota trade (Andersen and Bogetoft 2007), and sugar bean contracts (Bogetoft et al. 2007).
In this research, we propose a model that identifies an endogenous number of mergers that maximizes the overall efficiency gain at industry level. The analysis thus focuses on existing structural inefficiency (Farrell 1957, Førsund and Hjalmarsson 1979) and potential improvements from a restructuring of the industry. The model selects and evaluates mergers endogenously based on an adaption of the additive, variable returns-to-scale, DEA approach. Related merger analyses of the potential efficiency savings of an industry can be found in Bogetoft et al. (2007) and Andersen and Bogetoft (2007). We further present its application to the European air navigation sector, marked by national providers that control the airspace of each state. Given the current technologies, it is not possible to realize economies of scale without merging the various national airspaces into fewer but larger air blocks. In other words, realizing economies of scale is only possible through mergers. In this restricted sense, such economies could also be regarded as merger-specific synergies, leaving learning inefficiencies as the only relevant saving not connected to a merger scenario. The harmony effect relates to the potential advantage of reallocating resources, products and/or services among the units being merged. Scale economies are regarded as synergies for the air traffic control providers because they cannot grow without merging air blocks.
1.2. Mergers of Air Traffic Control Organizations
Air navigation services are provided across a complex network that protects the movement of aircrafts at and between airports. According to Farrell and Shapiro (2001), merger-specific synergies include input rationalization, network configuration specificities, improved interoperability, and the coordination of joint operations, all of which are relevant to the air traffic control industry. It is argued that synergies may be obtained both through cooperation and coordination of the entities’ assets. Within the air traffic control market, input rationalization could include a reduction in the number of support staff and managers, which is currently double the number of personnel employed by the Federal Aviation Authority (FAA) operator that serves the airspace of the United States (Gulding et al. 2010). Network configuration specificities could include improved preplanned flight paths, made possible by merging contiguous air blocks such that the paths require fewer cross-points. This, in turn, should decrease workload and shorten excessively long flight paths, estimated at an average excess of 42 km across Europe (Blondiau et al. 2016). Such network improvements would directly benefit airline customers while reducing environmental pollution. Improved interoperability would be potentially achieved through the joint purchase of air traffic management technologies, which is expected to reduce the purchase price. This was indeed one of the outcomes of the COOPANS initiative, which created an alliance between five air navigation service providers (ANSPs). The alliance’s establishment led to a 30% reduction in the cost of technology purchases.1 We note that the adoption of new technologies will likely increase the ANSPs’s fixed costs and minimum efficient scale. Hence, improved interoperability is of particular importance to this industry over the next decade (Adler et al. 2022). Furthermore, coordination of joint operations could permit a reduction in the number of air traffic control centers, given that the FAA serves a busier airspace with one third the number of centers of the European Union (EU). Moreover, coordination may also enable greater flexibility with respect to air traffic controller workload, particularly at times of low service requirements, such as overnight operations.
Economies of scale may well be available in this market, given that the providers split the airspace according to Member State sovereignty rather than serving airline customers in an optimal manner. Consequently, the EU passed the Single European Skies regulation in 2004 with the intention to reduce the number of providers by aggregating the airspace of the 29 EU Member States at the time into nine functional airspace blocks (FABs). The endogenous merger DEA model developed in this research and applied to the air traffic control market could provide information as to which horizontal mergers are likely to help create an efficient industry (Fisher 1987). We estimate the potential cost savings of the FAB configuration, which was created through a politically constrained decision process, and compare the result to that of the optimal, first best outcome. We then compute the learning efficiencies that each firm could achieve alone and the additional merger-specific synergies that may be achieved through agglomeration.
1.3. Contributions
The contributions of this research are fivefold. First, we develop a model that endogenously identifies the optimal number of merged firms such that the potential efficiency gain at the level of an industry is maximized. The model is based on a weighted additive nonradial DEA model to search for the longest path to the Pareto frontier. The results of the model also identify which specific firms, or branches of a firm, should be combined.
Second, assuming that each firm operates in a specific area, we extend the DEAmerge model to consider feasible mergers as combined sets of units that cover a contiguous area. Network-based industry mergers must lead to firms that provide services across a contiguous network. For example, a merger between emergency service facilities will need to serve the entire area covered by each of the zones served by the original set of facilities. In the case of air traffic control, the nine FABs, which are expected to serve the airspace of the Member States, create contiguous air blocks across Europe. Therefore, a second contribution of this paper is the development of a model to identify the optimal number of endogenous and contiguous sets of firms that serve a market efficiently. The contiguous DEAmerge model is based on an adaption of Williams (2002) in which land acquisition is possible only if it maintains spatial connectivity.
Third, we propose the application of a variable returns to scale (VRS) model, whereby the reference technology T is spanned not only by observed decision-making units (DMUs) but also by all potential mergers of observed DMUs. In addition, the standard axiom of convexity of the technology set is removed. This technology was originally published in Green and Cook (2004) and named the Free Aggregation Hull (FAH). We develop an axiomatic foundation for this reference technology and adapt the DEAmerge model accordingly. The FAH technology explicitly blocks replicability, that is, any given DMU may be included in no more than one merger. This is an important characteristic if the merger is aimed at cost efficiency and does not assume that output, often set externally by the marketplace, could be reallocated. Alternatively, if the aim is to increase productivity, we do not assume that the resources available necessarily increase as a result of a merger.
Fourth, we create the decomposition of potential merger gains into individual learning effects and merger synergies within a nonradial context, in which the proposed DEAmerge model is formulated as a directional distance function (DDF)-based model. The DDF approach enables the decomposition of the optimal slack vectors. To handle mergers between very different sized firms, we use an α-harmony effect computation based on the market share of the largest firm within each merger, which replaces the simple average utilized to date.
Fifth, we analyze a network-based industry using the contiguous DEAmerge approach. The technological developments in air traffic management systems in which regulators on both sides of the Atlantic have invested heavily are unlikely to be used without a concomitant reduction in operating costs (Treanor 1997, Adler et al. 2022). It would seem that the simplest way to achieve this would be to create larger firms than currently exist, thus permitting economies of scale to be reinvested in the new technologies. In the case study analyzed in this research, we question whether the nine FABs would create an optimal European air traffic management market that maximizes merger-specific synergies, including economies of scale. We find that the politically acceptable FAB solution may lead to a one third reduction in costs, but an optimal four merger solution will likely save closer to 52% of the total costs.
The paper is organized as follows: In Section 2, we develop the DEAmerge model, and in Section 3, we develop a method for creating contiguous mergers. In Section 4, we discuss potential reference technologies for the DEAmerge production possibility set and present an axiomatic approach for the free aggregation hull model. In Section 5, we use a directional distance function DEAmerge model to decompose the results into learning effects and merger synergies. In Section 6, we provide details of the European air navigation service market and the results of the analysis. Finally, in Section 7, we draw conclusions and discuss the many potential future directions for our modeling framework.
2. DEAmerge Model
Within the classic DEA framework, a specific decision-making unit (DMU) is benchmarked against a best-practice frontier defined by the DMUs themselves and estimated from a sample of observations. In general, having chosen a direction with nonnegative components in input space, the longer the distance to the estimated technology frontier, the more inefficient the firm is deemed. Clearly, being inefficient represents a loss. However, it also suggests possibilities for improvement. Organizations may want to explore the possibility of mergers and to what extent the production of services could be increased for a given level of resources, or whether the given level of production could be achieved using fewer resources. In this section, we present the DEAmerge model, a modification of the weighted additive model proposed in Lovell and Pastor (1995), which maximizes potential merger gains over all possible endogenous merger structures. By applying the DEAmerge model, it is possible to capture potential improvements created through joint operations of the units in the merger.
Let us assume a sample of n original firms or branches, . The ith firm consumes l nonnegative inputs to produce s nonnegative outputs . Let the ith firm’s input and output vector be denoted and . As suggested in the exogenous merger model of Bogetoft and Wang (2005), a merger of units with indices in the set is simply the combined input and output vector . We measure potential overall gains from this merger as2
Through a modification of the weighted additive model of Lovell and Pastor (1995), we capture the potential savings from mergers created through joint operations. A radial model would not be of use in this context because we need to sum the potential savings in inputs and/or outputs. Model (3) thus identifies and selects a fixed number w0 of mergers or stand-alone units, each composed of an endogenously determined subset of all the n units. For fixed w0, the optimal composition of the mergers are determined by maximizing the overall potential gains over all possible compositions of these mergers. We use as the index for each of the merged units. Letting w0 vary between one (the grand coalition) and n (all stand-alone units), we find the optimal number of mergers and their composition based on the highest value of the objective function (3.1) across the n potential scenarios.
Decision Variables in Model (3)
Let . For a general , Model (3) considers simultaneously all the input and output slacks from the w0 mergers. The objective function (3.1) maximizes the weighted sum of all the input and output slacks. For an input-oriented analysis, the output slacks may be removed from the objective function, and for an output-oriented focus, the input slacks may be removed accordingly.
Merged units are defined in terms of Constraints (3.2) for the inputs and Constraints (3.3) for the outputs. The two sets of constraints produce w0 binary vectors, . Unit i is part of merger a0, where , if . The new, merged units are created via direct pooling of the respective original data, that is, the inputs and outputs from merger a0 equal . Consequently, vector , fully composed of ones, indicates that merger a0 is the grand merger of all firms. This is only possible if . Equation (3.1) in combination with Constraints (3.2) and (3.3) estimate the maximum weighted L1 distance from the merged units to the best-practice frontier with respect to inputs and outputs. Constraints (3.4) approximate the technology set T with a VRS reference technology Tvrs based on our sample of n DMUs. Equations (3.5) and (3.6) constrain the merger vectors. Specifically, Constraints (3.5) ensure that each merger consists of at least one unit. Constraints (3.6) ensure that each unit is considered only once (i.e., a unit cannot be part of two different mergers). Constraints (3.7) define μai as binary variables (i.e., the unit cannot be split). Finally, Constraints (3.8)–(3.10) define the input and output slacks and the intensity variables as nonnegative.
3. Merging Rules
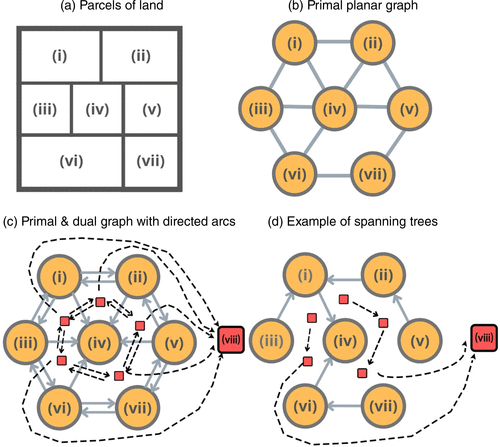
Model (3) analyzes the potential mergers across the original decision-making units. However, there may be constraints on the potential merger opportunities, including political or geographical restrictions. As an example, a particular merger between air navigation service providers must lead to service across a contiguous airspace given current technologies. Similar examples could be drawn from the field of emergency services such as fire stations and ambulances or utilities such as the energy and water sectors, whose transmission systems need to be contiguous. To implement a contiguity rule limiting the merger set, we modify the model by Williams (2002), which proposes an integer program for land acquisition that ensures spatial connectivity. The model is based on the idea that a landscape is a mosaic of regions that can be represented by a planar graph with vertices (i.e., the regions) and edges (i.e., adjacent regions). The vertices and edges of the “primal” graph partition the plane into zones, which then create a “dual” graph. The dual graph is constructed by placing a dual vertex inside each of the partitioned zones and the unbounded outer area. Dual edges connect the adjacent dual vertices by crossing every primal edge. The mathematical model searches for two spanning trees (STs) of adjacent vertices: one in the primal graph and one in the dual graph. Constraints are included such that only complementary STs are feasible (all vertices in each of the two graphs are by construction covered by the two spanning trees). A pair of primal and dual STs is complementary if no respective pair of edges intersects. As noted by Williams (2002), two complementary STs provide a partitioning of all pairs of intersecting primal and dual edges from the primal and dual graphs. The ST of the primal graph is split into a subspanning tree (SST) of contiguous vertices, which represents a contiguous region of the original landscape. The SST represents a merger in the DEAmerge model.
The method for imposing contiguity requires knowledge of the planar graph, namely, the location of the firms with respect to each other, as demonstrated in Figure 1(a). The network is composed of n nodes, representing, for example, the catchment areas of firms or the airspace per country, from which it is possible to create a primal graph. Figure 1(b) consists of n = 7 primal nodes. The dual graph consists of r nodes, one for each of the partitioned zones and an additional node for the unbounded outer region, hence, r = 6. The dual edges connect the dual nodes, as shown in Figure 1(c). To complete the primal graph and dual graph, we choose one arbitrary node in the primal graph as a terminus node (node (iv) in Figure 1(c)), and we choose one node in the dual graph as a terminus node (node (viii) in Figure 1(c)). Finally, each undirected edge arc is substituted with two directed arcs, except for the edges incident to each of the two terminus nodes, as shown in Figure 1(c). By construction, the primal and dual STs chosen by the model will always be complementary. An example of two complementary STs is presented in Figure 1(d). To summarize, only mergers represented by a SST, derived from a pair of complementary primal and dual STs, are feasible. This implies that only mergers consisting of units that create a contiguous region or network are regarded as feasible mergers.
The zero-one programming model in Williams (2002) uses the following notation:
The following notation is used for zero-one decision variables:
We refer to the primal terminus node (iv) as node n, and the dual terminus node (viii) as node r. We modify the Williams (2002) model to ensure contiguity of the mergers derived from the merger vectors , by adding the following constraints to Model (3):
Consider a specific merger . Constraints (4.1), (4.4), and (4.5) state that for each merged unit if unit i, equivalent to vertex i in the primal graph, belongs to merger a. Exactly one primal arc (i, t) from i to an adjacent unit in this merger must be selected for the primal spanning tree, either by selecting arc (i, t) as part of both the ST and the SST, in which case , or as part of the ST but not the SST, in which case . Constraints (4.2) refer to the dual graph and ensure that for the dual vertex , exactly one dual arc from v to an adjacent dual vertex is selected, that is, one of is equal to one and all others are zero. Constraints (4.3) force the selection of exactly one arc from each set of intersecting primal and dual arcs. These constraints imply that only complementary pairs of primal and dual spanning trees are feasible. Constraints (4.4) and (4.5) ensure that primal arc (i, t) or is selected for a SST in the primal graph only if unit i and unit t are part of merger a. Constraints (4.4) and (4.5) imply that if unit i and t are not part of merger a, that is, if . In Constraints (4.6), the number of arcs () in the SST related to merger a is equal to the number of units in merger a minus one. Finally, Constraints (4.7) define the decision variables as binary. We now define the contiguous DEAmerge model as
4. Reference Technologies for the DEAmerge Model
The DEAmerge model (3) refers to Tvrs as an approximation of the technology set T. We consider the following two relevant choices to approximate the reference technology for the endogenous merger model:
Bogetoft and Otto (2011) argue that one may question the VRS assumption in a merger model because a large entity ought to succeed at least as well as two smaller units into which it could be decomposed. They suggest that a nondecreasing returns to scale (NDRS) reference technology should replace VRS in this case. Hence, it seems that a fruitful procedure would be to either keep the approximation of T as Tvrs or introduce an approximation of T as . However, we note that in this research we are not analyzing a priori merger specifications as in the extant literature. Rather, DEAmerge is designed to search for endogenous mergers and determine the optimal number of merged units and their composition that will provide the largest potential merger benefits. If we introduce Tndrs, the endogenous merger structure outcome from the DEAmerge model will always determine that the grand merger, consisting of all DMUs, is one of the optimal market structures. This conclusion is highlighted in the following theorem.
Let DEAmerge(NDRS) be defined as a modified model (3) where Constraints (3.4) are replaced with . Let us denote the optimal solution of DEAmerge(NDRS) as a function of the prespecified number of mergers w0, . Then, we find that
See Appendix A. □
In general, most markets are better served under a competitive setting with minimal regulatory intervention, unless the fixed costs are such that a natural monopoly exists. Consequently, it would be preferable to assume a Tvrs rather than Tndrs technology. However, if the frontier estimation reveals that there are no efficient NIRS units, then a merger that consists of adding firms to one of the CRS efficient units may be deemed costly; that is, the harmony effect will be negative. If this is the case, then we suggest the application of a VRS model where T is spanned not only by observed DMUs but also by all potential mergers of observed DMUs (without the assumption of convexity of the technology set). This technology has been suggested in Green and Cook (2004), where the authors name the technology the free aggregation hull and the technology set as TFAH. In the following section, we define TFAH, adapt the Green-Cook model, provide an axiomatic foundation, and show the relevance to merger models.
4.1. Free Aggregation Hull Model
Green and Cook (2004, p. 1062) argue that “if DMUs A and B exist, then it is plausible to suggest that DMU , formed by (freely) aggregating A’s and B’s activities, could exist.” Furthermore, any given DMU performance should not only be assessed against observed DMUs in the sample at hand, but also against synthetic DMUs formed by simple aggregation. The Green-Cook approach extends the empirical production possibility set to include aggregated DMUs formed by merging all units in all subsets of the observed DMUs. They denote this reference technology as the free coordination hull or free aggregation hull technology, denoted TFAH. Green and Cook (2004) explicitly state that the reference technology proposed does not rely on a convexity axiom because there frequently exist large areas of the production possibility set without any observed input or output activities in many practical applications. The authors also note that the convexity assumption is more connected to analytic convenience than economic reality. Removing the assumption of convexity is notably preferable whenever there is a lack of substitutability between variables. The downside of removing convexity, through the use of TFAH, is the inability of the model to sufficiently separate efficient from inefficient units, often called the curse of dimensionality. However, this may be less of a problem in the DEAmerge model with because of the substantial number of potential DMUs, namely, for n DMUs. In addition, we want to avoid the duplication of units within a merger, for example, 2A+B, because the duplicate has not been observed and may not be possible. For example, a merger between hospitals should not lead to more patients than those served by A + B individually. With respect to air traffic control, it is the airlines that produce the flights to be served. Hence, the merger of ANSPs will not lead to higher output but rather to potentially lower resource requirements. Within the FAH technology, we can remove replication such that all original DMUs either remain stand alone or join precisely one of the mergers.
Green and Cook (2004) define the free aggregation hull (FAH) reference technology set TFAH as follows4:
Formally, let us denote the power set of I as , where . Power set is the set of all subsets of I, which includes the possibility of no mergers and all other potential groupings up to the grand coalition. We thus adapt the TFAH technology set to be equivalently expressed as follows:
Assume that observed DMUs are . We use the following six axioms to provide a foundation for .
(Feasibility of Observed Data). For any .
(Free Volume Input Disposability). Let . Consider any . Let and . Then .
(Free Volume Output Disposability). Let . Consider any . Let . Then .
(Binary Inputs). Let
(Conditional Additivity). Let with .
(Minimal Extrapolation). The technology T is the intersection of sets that contain all the observed DMUs and satisfy the stated Axioms: 1, 2, 3, 4, and 5.
As summarized in the next theorem, the six Axioms suffice as an axiomatic foundation for
The minimal extrapolation PPS that satisfies Axioms 1, 2, 3, 4, and 5 is the set in (8).
See Appendix A. □
In the following, let us assume that we have a data set with n DMUs characterized by
Given (9), we know that a unit connected to a merger is blocked from joining the same merger again because of condition ; that is, the duplication of units is not permitted. Furthermore, assuming (9), is the minimal extrapolation production possibility set. Inserting into Equations (8.3) to (8.5), we know that the following three constraints hold:
Constraint (11) is clearly satisfied in the definition of TFAH in Model (6). Formally, Constraint (12) would require the addition of constraint in Model (6). However, setting would not contribute to the definition of the technology set TFAH. In summation, assuming (9), the minimal technology set is equivalent to TFAH, which can be expressed as the union of , with sets including each observed DMU and all mergers of existing DMUs, as shown in Model (7).
When creating the initial data set for Model (9), each DMU owns a specific area, which is translated into one binary input, and no pair of DMUs share the same area. Drawing from the real world, the binary variable with respect to public hospitals could be interpreted as the catchment area, with the volume of services provided reflected by the size of the hospital and the relevant population. The duplication of hospitals in a merger analysis should be avoided because the stock of patients needing medical services is typically fixed. Another example is drawn from general practitioners (GPs), who are frequently reimbursed by local authorities for their services to citizens living within their catchment area. For budgetary reasons, the number of GPs in any given area is typically regulated. In general, a GP begins practicing in an area provided he/she buys an existing practice from a retired GP, which implies that the new GP purchases the right to practice in that area. In a merger analysis of GPs, the binary input in Model (9) would be the permit to practice in a given area. With regard to air traffic control, each of the ANSPs is certified by the Member State to service flights in a given subspace of the European airspace. Any given merger of a group of existing ANSPs is only feasible if the participating ANSPs are permitted to service one of these subspaces. In a merger analysis of ANSPs, the binary input in Model (9) would be the permit to control flights in a given airspace.
In summing up this section, let us rewrite Model (3) in a more general form, where we specify a general technology set T:
Furthermore, Model (14) represents the contiguous DEAmerge model that is applied with the TFAH technology in the case study in Section 6:
5. Decomposing the DEAmerge Results
Following Bogetoft and Katona (2008), we decompose the potential merger gains into three components: (i) learning, (ii) harmony, and (iii) scale effects. We note that the potential input savings for any prespecified merger H in Equation (1) are based on a radial contraction of inputs, which is in contrast to the DEAmerge model, where the potential merger gains for any given merger are measured by the optimal values of the input and output slack vector from Model (3). To accommodate a similar decomposition,6 we develop the DEAmerge model not only as a modification of the weighted additive model of Lovell and Pastor (1995) but also as a DDF with endogenous directions, which are shown to be proportional to the vector of optimal slacks from the weighted additive model. This “double representation” of the DEAmerge model enables the decomposition of the potential merger gains derived from a DDF version of the merger analysis. As suggested in Bogetoft and Otto (2011), the DDF measures the potential overall merger gains by solving Equation (2), where and are a priori chosen directions in input and output space to be reduced or expanded, respectively. In Färe et al. (2013), it is shown that it is possible to use a DDF formulation with endogenous directions based on normalized direction constraints. This approach allows us to translate Model (13) into an equivalent nonlinear, DDF framework as follows:
Because based on Equation (15.3), Model (13) implies Model (15).7 For inefficient units, at least one slack is strictly positive. Hence, With respect to efficient units, in Model (13), that is, merger a lies on the frontier, in which case the direction is not uniquely determined. We assign an arbitrary to ensure the equivalence of Models (13) and (15). Focusing on merger , the optimal direction vector is proportional to the direction vector derived from the optimal slacks in (13), because . We know that ; hence,
Focusing on an optimal solution of DEAmerge in (13) with mergers, let us define . Hence, merger a consists of DMUs with indices in Ha, where . To calculate the overall excess vector for merger a, we solve (2) with :
Let us denote the adjusted input and output vectors after removing the pure individual learning effect of DMU k entering merger a by
Using the direction da, we correct for the individual DMU specific learning effects before decomposing further, as follows:
The expression measures the number of times we improve Ha in direction da after having corrected for each DMU’s individual improvement potential in this direction while remaining within the technology set T. The difference is defined as , which measures the impact of the individual potential learning possibilities of all DMUs, were such savings to be successfully implemented. Because , we know that . The latter element, is disaggregated into harmony and size effects.
The harmony effect represents the gains obtained from the reallocation of inputs and outputs between the units composing the specific merger. We estimate the harmony effect by projecting the average unit in the merger in the direction da toward the efficient frontier. Let be the number of firms participating in merger a. Using the direction da, the harmony effect, denoted , is estimated as follows:
The size effect is estimated as the residual:
Finally, the full additive decomposition for merger a is expressed as
5.1. Profitable or Costly Harmony Effect
A DDF approach to measure the effect of harmonizing the learning-adjusted inputs needs an a priori chosen direction in input-output space, which in (19) is denoted . In this section, we focus on the input space, that is, . The gain from the harmonized inputs is measured as the maximal number of times improvement vector may be subtracted from the learning-adjusted inputs, keeping the output constant and remaining within the reference technology set. When harmonizing is profitable/costly, the radial measure is below/above one, whereas the DDF measure lies above/below zero. It is possible to show that if T is convex and satisfies free disposability, the gain will be weakly positive, which means that it is less than or equal to one in the radial approach and greater than or equal to zero in the DDF approach.
An interesting alternative interpretation of harmonization gains in a radial merger model is suggested in Bogetoft and Wang (2005). The gain from an optimal pure reallocation is shown to be equivalent to the harmony effect if the reference technology is convex and satisfies free disposability. The specifics of this reallocation model are as follows. Consider a merger . Assume that we are asked to reallocate the available total learning-adjusted inputs from the firms to a number of “new” firms. We use the notation to indicate the endogenous inputs and outputs after the reallocation. We cannot reallocate inputs in excess of what is available, that is, . Furthermore, the new units must produce at least the total current output, that is, . Finally, the reallocated input-output combinations must be feasible, that is, .
The FAH technology is nonconvex, which implies that the DDF-based harmony effect may lie either above or below zero.8 In (19), we introduce the DDF harmony effect using the general technology set T and direction vector . In this section, we focus on the technology set TFAH and an l-dimensional direction in input space. In (7), we derive an expression for TFAH based on the power set . Let us denote the potential merger sets as . It is possible to reformulate the DDF harmony effect in (19) with as the following pure reallocation formulation.
Let a DDF harmony effect measure be calculated using the direction , with as the optimal solution to
Assume that
Conditioned on (23), an optimal solution in (22) is equal to the optimal harmony effect from (19) with .
See Appendix. □
In (6) and (7), we derive two equivalent expressions for TFAH. The first expression is informally discussed in Green and Cook (2004) and the second expression is based on the power set generation with sets generating input and output constraints. Satisfying (23) requires that the reallocations belong to one of the subsets of TFAH.
We are aware that some substitution possibilities exist between the harmony and size effects. Specifically, issues with the harmony computation are likely to arise when the combination of units in a merger is not of similar size, rendering the simple average rather problematic. Bogetoft and Wang (2005) suggest an harmony effect measure in relation to an input oriented, radial, exogenous merger model, as follows:
An radial harmony effect for merger H is calculated by solving
It is suggested that α defines activity levels, and that in the classical definition of HAH, α is preset to . However, there has been no discussion of procedures to choose a value for α, nor a description of the circumstances under which α should correspond to the simple average or otherwise. We propose an DDF, input-oriented harmony effect measure as follows.
An DDF harmony effect using the input direction can be defined as
We note that Model (24) collapses to (22) when . We connect the reallocation model (22) to the harmony effect measure by rewriting (24) as follows:
The issues discussed here are also pertinent to the air traffic control market analysis, in which one of the optimal mergers consists of six DMUs and the largest firm produces approximately 74% of the merger’s total output. Estimating the harmony effect, using the simple average in Equation (22), disaggregates the sum of the inputs and the outputs into six equally sized input vectors and outputs. To avoid creating new firms of smaller size than the current largest firm, we replace this harmony estimation with the reallocation-based harmony model (25) and set . Accordingly, we create 1.35 firms consisting of one firm with reallocated inputs capable of producing 74% of the total output and another smaller firm with reallocated inputs capable of producing 26% of the total output. Hence, we propose the application of the alternative α-formulation in cases like this, where the participating firms in a merger are of very different sizes. Choosing α equal to the relative output (market share) of the largest DMU in the merger improves the balance between the harmony and size effects of the proposed merger decomposition.
6. European Air Traffic Control Market
Across the globe, the jurisdiction of ANSPs is aligned with state borders. Air traffic movements at airports are controlled by towers and approach units, whereas upper airspace, en route traffic is controlled by Area Control Centers. The centers are further divided into en route sectors, in which at least one air traffic controller manages each sector. The centers deploy a range of technological facilities, including radar- and satellite-based location equipment and air/ground communication equipment, to safely locate and separate traffic. As an aircraft enters the airspace of a European member state, it is serviced by a specific ANSP and handed over to the next ANSP according to the flight path chosen. Each service provider individually procures tailored equipment and maintains training schools and all other support functions. This fragmentation of the European skies impacts safety, limits capacity, creates congestion, and causes substantial additional costs (Baumgartner and Finger 2014, Adler et al. 2022).
It is against this background that the EU created the Single European Sky initiative with the aim of treating European airspace as a single entity, instead of a patchwork of multiple national systems. The single sky legislative framework consists of four basic regulations covering the provision of air navigation services, the organization and use of airspace, as well as the interoperability of the European air traffic management network. A major transitional component of this program is the notion of FABs, which are intended to merge 29 providers into nine aggregated entities, which are expected to handle air traffic more efficiently. The intention behind agglomeration is to increase the scale of operations, irrespective of national borders. In summation, FABs are intended to (i) reduce airspace fragmentation, (ii) reduce overall costs, (iii) accommodate steadily growing traffic, and (iv) minimize delays by managing the traffic more dynamically.
In this case study, we apply the contiguous DEAmerge model (14), assuming an FAH technology, to estimate the potential merger gains from aggregating ANSPs in Europe. The structure of the technology is motivated by the following observations. Each airspace belongs to a sovereign country, so it is not possible to subdivide them. However, it is possible to combine national airspaces into larger airblocks by merging some of the ANSPs. The airspace users produce the flights that the ANSPs are required to track. Hence, the output cannot be reallocated or increased by the ANSPs alone. Consequently, the lack of replicability defined in Axiom 4 and the conditional additivity in Axiom 5 of the TFAH technology set are relevant to this market.
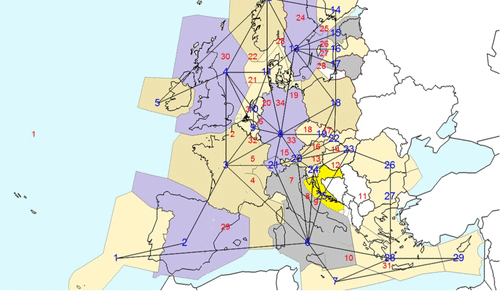
The European sky is defined as a planar graph with each national airspace (ANSP) represented as a node with an edge connecting any pair of ANSPs if the two relevant airspaces are neighbors. Figure 2 outlines the primal and dual graphs that correspond to the European planar graph. The blue (dark) numbers and solid lines represent the vertices and edges of the primal graph, respectively, whereas the red (light) numbers represent the vertices of the dual graph. By construction, the model requires that any primal vertex be connected to more than one other primal vertex. In our case study, this is an issue in the cases of Cyprus, Portugal, and Ireland, all of which are connected to only one airspace, namely, Greece, Spain, and the United Kingdom, respectively. To ensure feasibility and consider all the ANSPs in the analyses, we create three fictitious edges between the primal vertices (5–12, 1–6, 7–29) and three fictitious dual vertices (30, 29, 31), as shown in Figure 2. By constraining the relevant primal directed arcs to zero, we ensure the feasibility of the contiguous DEAmerge model (14).
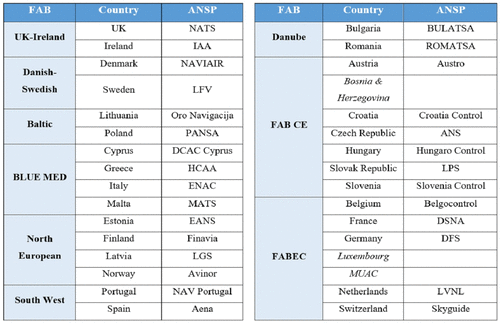
The data on which we base our analysis of the air traffic control market in Europe are published in the ACE Benchmarking Reports, which have been circulated annually by Eurocontrol since 2002. The units of observation for this analysis consist of European ANSPs. We consider the ANSPs participating in the FAB initiative, as listed in Appendix B, with the exception of Bosnia and Herzegovina, for which there is a lack of data, and Maastricht Upper Area Control Centre, which serves only upper airspace. Consequently, we analyze 29 European ANSPs for the years 2010 to 2014.
Given the relatively small number of observations, we consider three inputs: air traffic controllers (ATCOs), support staff, and capital stock. ATCOs are counted in terms of full-time-equivalent personnel. Support staff include all nonoperative, full-time-equivalent personnel, such as technical support, administration, and management. We separate the two types of staff because they fulfill different sets of tasks, and their salaries are substantially different. Capital stock represents the capital net book value of the fixed assets, including buildings, controller working positions, air traffic management equipment and communications, navigation, and surveillance infrastructure. The capital stock is adjusted by the exchange rates to create a standardized currency across countries in Euros. The output of our analysis includes the composite flight hours, which is an indicator integrating both the instrument flight rules en route hours and the airport movements controlled by the ANSPs. To account for workload heterogeneity, we modify the composite flight hour formulation by including complexity as an adjustment factor for the total flight hours controlled, as shown in Equation (26). As noted in the Eurocontrol report entitled “Complexity metrics for ANSPs benchmarking analysis (2006),” complexity indicators capture the level of difficulty of the en route control tasks, which directly impact controller workload. We include the complexity indicators in the benchmarking process as follows:
Model (14) selects the mergers endogenously based on the input and output levels of the individual providers. Given the substantial variability over the time frame, particularly with respect to the output, it would not be reasonable to base long-term merger decisions on a single year’s performance. Therefore, we conduct our analysis on the inputs and output for an average period to soften the market fluctuations. We selected the five-year period from 2010 to 2014 in an attempt to reduce the exceptional effects of the financial crisis. Table 1 presents descriptive statistics of the average values considered in the analysis. With respect to the inputs, the Italian ANSP (ENAV) invests the most in capital stock, whereas the French operator (DSNA) employs the highest number of both ATCOs and support staff. Germany (DFS), followed by France (DSNA) and the United Kingdom (NATS), control the highest output levels. Malta (MATS) is the smallest ANSP considered in the analysis, with the lowest levels of inputs and output.
|

Table 1. Descriptive Statistics of the European Air Traffic Control Market
| Average | Standard deviation | Maximum | Minimum | |
|---|---|---|---|---|
| NBV (’000 €) | 195,904 | 255,933 | 869,308 | 8,564 |
| ATCOs (no.) | 504 | 660 | 2,743 | 49 |
| Support (no.) | 1,001 | 1,210 | 5,483 | 92 |
| Adjusted composite output | 2,817,769 | 4,563,217 | 15,857,225 | 66,118 |
We first present the potential savings that could have been achieved had the FABs been implemented. We apply the input slack orientation of DEAmerge9 Model (13) with a fixed merger vector μai that follows the FAB regulations. The Single European Skies II regulation, introduced in 2004 and expected to be implemented by 2012, created nine providers, each with a contiguous airspace. We define as the indicator vector corresponding to the nine FABs, that is, if ANSP i belongs to FAB a and otherwise. Table 2 presents the objective function (with weights equal to the inverse of the standard deviation of the specific input j) and the slacks for the exogenously set merger choice. Potential savings include around €1.12 billion in capital stock, approximately 4,500 ATCOs, and 5,250 support staff, representing savings of 20%, 31%, and 18%, respectively. Thus, implementing the FAB initiative should lead to approximately €2.1 billion in savings, based on the average costs of staff per provider.
|
Table 2. Potential Savings from the Functional Airspace Blocks Initiative
| Objective value | ANSP | NBV (’000 €) | ATCOs (no.) | Support (no.) | |
|---|---|---|---|---|---|
| 1 | 0.313 | UK-IR FAB | 40,482 | 76 | 47 |
| 2 | 1.170 | DK-SW FAB | 46,640 | 423 | 418 |
| 3 | 1.176 | Baltica FAB | 59,568 | 257 | 669 |
| 4 | 3.930 | BLUE MED | 539,872 | 1,027 | 318 |
| 5 | 3.378 | North Europe | 225,241 | 1240 | 746 |
| 6 | 2.564 | South West | 129,078 | 576 | 1,433 |
| 7 | 1.490 | Danube FAB | 69,300 | 529 | 504 |
| 8 | 1.495 | FAB CE | 9367 | 345 | 1131 |
| 9 | 0.0 | FABEC | 0.0 | 0 | 0 |
| 15,516 | Total | 1,119,548 (20%) | 4,473 (31%) | 5,266 (18%) |
Table 3 presents the results of the endogenized merger DEA framework with and without contiguity constraints, based on input-oriented Models (14) and (13), respectively. The results of the contiguity-constrained DEAmerge model include two optimal solutions with the same objective function value: one composed of four mergers (row (i)) and the other of three mergers (row (ii)). In general, the results suggest that approximately €3.3 billion in savings are available, equal to 52% cost savings in comparison with the 33% achieved by the FAB initiative. When comparing the results in rows (i) and (ii) to that of the FAB initiative, the contiguous DEAmerge saves an additional 9% in capital costs, 11% in controllers, and 18% in support staff over and above the second best political solution. In the case of the DEAmerge model without contiguity constraints (row (iii)), the results suggest a five-merger solution, with a smaller reduction in capital but higher staff savings compared with rows (i) and (ii).
|
Table 3. Endogenous Merger Potential Savings (% Reductions)
| Row | Model | Objective value | NBV (’000 €) | ATCOs (no.) | Support (no.) | No. of mergers |
|---|---|---|---|---|---|---|
| (i) | 14 | 24.5377 | 1,675,200 (29%) | 6,098 (42%) | 10,580 (36%) | 4 |
| (ii) | 14 | 24.5377 | 1,675,200 (29%) | 6,098 (42%) | 10,580 (36%) | 3 |
| (iii) | 13 | 25.3566 | 1,294,110 (23%) | 6,743 (46%) | 12,941 (45%) | 5 |
As to the merger structure, the DEAmerge model with contiguous constraints determines an optimal merger structure of three or four merged units, replacing the original 29 air navigation service providers or the nine functional airspace blocks (as detailed in Appendix B). As expected, the noncontiguous model achieves higher overall savings by combining firms that are not possible given the current technology but may be of use after the adoption of trajectory-based air traffic control services.
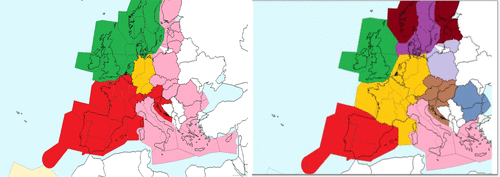
In Table 4, we present the full details of the optimal, four ANSP solution outcome, and in Figure 4, we compare this optimal solution to that of the FAB initiative. This optimal solution creates one large merged firm that produces 36% of the market output by combining two relatively large regions: France and Spain. The second largest merged firm serves 26% of the market and combines the United Kingdom with five small ANSPs. The third and fourth mergers split the remaining market, with Italy joining 13 small ANSPs and Germany, the largest original ANSP, left on its own. The alternative optimal solution (presented in Table 3), with a three-ANSP solution outcome, entails either combining Germany with the third merger or combining mergers 2 and 3. Neither of these options may be a preferable outcome should competitive considerations also be taken into account. The first merger may be problematic because of the corridor that extends eastward, including Slovenia (SLO) and Croatia (CR), which may generate inefficient flight paths from the airspace users’ perspective. Solving this issue would require additional policy or technology constraints, in the form of cutting planes, added to the current contiguous DEAmerge model.
|
Table 4. Model (14) Solution with Four Mergers
| Merger 1 | Merger 2 | Merger 3 | Merger 4 | |
|---|---|---|---|---|
| Output | 29,611,432 | 21,163,771 | 15,082,867 | 15,857,224 |
| No. of countries | 8 | 6 | 14 | 1 |
| Countries | PO, SP, FR, AU, BE, SZ, SLO, CR | UK, IR, NE, DK, NO, SW | IT, MA, FI ES, LA, LIT, PO, CZ, SL, HU, RO, BU GR, CY | GE |
To study the source of the gains presented in Table 3, we decompose the overall savings obtained from the contiguous DEAmerge model with respect to learning, harmony and scale effects. As shown in Table 5, the learning effects range from zero for the fourth merger, which consists solely of the relatively efficient Germany, to 23% savings from the third merger, composed of a total of 14 original ANSPs. The DDF harmony effect estimates from Equation (25) range from zero for the fourth merger to 67% for the first merger. Indeed, the harmony effects are high for the first and third merger, but are only 19% for the second merger, where the relatively efficient UK ANSP serves 74% of the output; hence, the gains are relatively lower from the reallocation of inputs. The remaining synergies draw from economies of scale, which are highest for the second merger and explain around one quarter of the merger synergies for Mergers 1 and 3. Yet, had we used the simple average to estimate the harmony effect, based on the optimization in Equation (22), we would severely underestimate the harmony effects because the three mergers aggregate across firms of very unequal size. In merger 1, France produces 49% of the total output, and in merger 3, Italy produces 40% of the merger’s total output. Incorrectly assuming mergers between DMUs of similar size leads to substantially negative harmony effect estimations, which, in turn, lead to unrealistically large size-effect computations.
|
Table 5. Savings Decomposition Given α Equal to Largest Firm’s Market Share per Merger
| Merger 1 | Merger 2 | Merger 3 | Merger 4 | ||
|---|---|---|---|---|---|
| 8 | 6 | 14 | 1 | ||
| Overall savings | 1 | 1 | 1 | 0 | |
| NBV (’000 €) | 491,962 | 268,700 | 914,424 | 0 | |
| ATCOs (no.) | 2,744 | 843 | 2,511 | 0 | |
| Support (no.) | 4,092 | 751 | 5,737 | 0 | |
| Learning effect | 0 | ||||
| NBV (’000 €) | 58,498 | 25,727 | 213,427 | 0 | |
| ATCOs (no.) | 326 | 81 | 586 | 0 | |
| Support (no.) | 487 | 72 | 1,339 | 0 | |
| Harmony effect | 0 | ||||
| NBV (’000 €) | 331,321 | 50,835 | 457,212 | 0 | |
| ATCOs (no.) | 1,848 | 159 | 1,256 | 0 | |
| Support (no.) | 2,756 | 142 | 2,869 | 0 | |
| Size effect | 0 | ||||
| NBV (’000 €) | 102,143 | 192,138 | 243,785 | 0 | |
| ATCOs (no.) | 570 | 603 | 669 | 0 | |
| Support (no.) | 850 | 537 | 1,530 | 0 |
Note. The bold numbers are the values of the decomposition effects.
7. Conclusions and Future Directions
Generally, mergers and acquisitions may result in improved efficiency because of increased production scale and merger-specific synergies. The DEAmerge model we propose evaluates merger combinations endogenously to determine the merger structure that maximizes the weighted sum of the potential efficiency savings of all mergers simultaneously, relative to the technology set. This set is approximated by either convex or nonconvex reference technologies within the DEA framework. In other words, based on the concept of structural efficiency (Farrell 1957), our model could be applied to identify the merger structure(s) that provides the largest efficiency gains at the level of an industry or a firm.
We have shown that the estimation of the optimal number of mergers, their compositions, and the total potential efficiency gains requires mixed integer linear programs. Such mergers are evaluated by maximizing the sum of the weighed L1 distances from each of the mergers to the frontier of the technology. Because the focus is on merger synergies, including economies of scale, we do not consider constant or nonincreasing returns to scale reference technologies. The standard approach would, therefore, be the convex hull, VRS reference technology, in which merged units operating at large scale may demonstrate a lack of merger gains or even losses as a consequence of the merger. However, the lack of merger gains would merely reflect the existing best practice alone. We argue that a large entity ought to succeed at least as well as two smaller units into which it could be decomposed. Hence, an NDRS reference technology could replace the VRS. Unfortunately, we show that the application of a convex NDRS reference, together with the endogenous merger structure outcome from the DEAmerge model, will always determine that the grand merger consisting of all DMUs is one of the optimal market structures. Grand mergers would lead to a monopolistic producer, which is unlikely to generate an efficient market outcome over time and would create difficulties for a regulator to benchmark. Consequently, we apply an alternative technology, denoted FAH, in which a nonconvex VRS reference technology spans not only the observed DMUs but also all the potential mergers of observed DMUs. In addition, we develop an axiomatic foundation for this reference technology.
We apply the contiguous DEAmerge model with FAH technology to the case of the fragmented European air navigation system provider market, where each country provides such services independently of the size of their airspace. The optimal configurations created according to the model are then compared with the FABs, an exogenous system reconfiguration determined by the European Union almost two decades ago. Our results suggest that, although FAB configurations are likely to create substantial potential savings, in the region of €2.1 billion annually, the functional air blocks do not represent an optimal solution for agglomeration. Given the shape of the technology, the contiguous DEAmerge model suggests that a market structure comprised of three or four air navigation service providers would provide optimal service for the European market, saving around €3.3 billion annually compared with the current system, a marked improvement over the nine providers proscribed by the Single European Skies initiative. If the service could be provided without the requirement for contiguous space, which is potentially possible under new trajectory-based, air traffic control technologies, five companies would lead to optimal industry savings.
The approach proposed has several potential extensions. When considering mergers and acquisitions and industry reorganizations, it could be relevant to consider a time frame in the analysis. The choice of mergers could be based on multiple time periods, not only on the last period or the average of several periods prior to merging. This would require combining Malmquist with the DEAmerge framework. Another possible extension is to consider the rationalization of the inputs as a function of the number of units merging. However, to implement this approach, the likely impact of an increase (or decrease) in size with respect to input rationalization would need to be estimated independently.
Testing the DEAmerge model using simulated data from a known convex VRS technology would be an interesting area for future research. The simulation would enable a comparative analysis of the VRS, FDH and FAH reference technologies and their impact on the performance of the DEAmerge model. If the sample size is relatively large compared with the dimensions of the input-output space, we would expect the creation of mergers located close to the most productive scale size of the underlying technology. DMUs lying on the nonincreasing returns to scale frontier will likely remain stand alone because the current approach does not include disaggregation of existing DMUs. The case study analysed in this research included only providers that exhibit or are below the most productive scale size, having applied a VRS reference technology. Relevant technologies could be assessed in a simulation by generating multiple data sets, which may provide further insights into the most appropriate models for estimating mergers and acquisitions a priori. Analyses of the small sample properties of the FAH reference technology is another area where a simulation study could prove useful.
The estimation of potential merger gains and its decomposition, discussed in Section 5, implicitly requires an assumption that all inputs and outputs may be freely redistributed between the merged units. Bogetoft and Otto (2011) discuss this issue and suggest that each input and output be classified as controllable or noncontrollable, as well as transferable or nontransferable, between the merged units. Only controllable and transferable resources ought to be reallocated. In the case study presented in Section 6, we assume that all three inputs used in the merger analysis are controllable and transferable, at least in the medium to long run. It is left for future research to supplement the results with a sensitivity analysis. For example, it may be of interest to analyse the impact of redefining the capital measure, net book value, as a controllable but (partially) nontransferable resource.
Finally, a thorough analysis of the estimation of harmony and size effects would likely be of interest too, particularly when mergers are composed of units of very different size and the technology is nonconvex. The current decomposition works well when the analyzed units are of approximately equal size and the technology is convex. However, if that is not the case, then the procedure appears to be less well behaved. In this research, we have created an additive decomposition of potential merger gains into individual learning effects and merger synergies within a nonradial context, along the lines of Bogetoft and Katona (2008). To generate mergers between firms that greatly differ in size, we have adapted the α-harmony effects proposed by Bogetoft and Wang (2005) to a nonradial context. We set the size of α to the market share of the largest firm within each merger to avoid the simple average. However, more research is necessary to provide guidelines on how to estimate α in such settings.
The authors thank the two anonymous referees for valuable and constructive suggestions; the participants in the Air Transport and Regional Development Cost Action (TU1408) workshop at Eurocontrol, European Workshop on Efficiency and Productivity Analysis 2017, Universidade Catolica Portuguesa in Porto, and the University of Bergamo seminar series on aviation for helpful comments.
Appendix A.
This section presents the proofs of Theorem 1, discussed in Section 4, Theorem 2 and the axiomatic foundation developed in Section 4.1, and Theorem 3 that is presented in Section 5.1.
A.1. Proof of Theorem 1
We will prove this theorem by showing that from an optimal solution to DEAmerge(NDRS) with and optimal criteria function , we can construct a feasible solution to the DEAmerge(NDRS) with with the same criteria value. From this follows that the optimal value DEAmerge(NDRS) with , that is, , cannot be smaller than .
Let us compare DEAmerge(NDRS) with and with . Let . Let the decision variables in DEAmerge(NDRS) with be denoted as . Solving the following optimization problem for p = l and for will give us optimal solutions to DEAmerge(NDRS) with and with .
Let the optimal values from solving this optimization with be denoted . We know from (A.1.2) and (A.1.3) that
Adding the first two of these input and output equalities, we get
Next, we insert the values of the optimal decision variables into DEAmerge(NDRS) with as follows:
(a) ,
(b) ,
(c) ,
(d) .
These values of the decision variables satisfy Constraints (A.1) by construction, except for (A.1.4), in DEAmerge(NDRS) with . Hence, we have a feasible solution to DEAmerge(NDRS) with with the same criterion as the optimal solution with DEAmerge(NDRS) with if
However, these inequalities are satisfied because from (A.1.3) in DEAmerge(NDRS) with . □
A.2. Proof of Theorem 2
Define the true minimal extrapolation PPS subject to Axioms 1, 2, 3, 4, and 5 by .
Part 1: Show that . If then can be expressed using 8.1–8.3), that is, satisfies 8.1–8.3) with some . Let with . Then, from Axioms 4 and 5, we know that Conversely, these two DMUs satisfy (8) with some vectors and . Now, consider . The expression satisfies (8) with the vector . Hence, .
Part 2: Show that . In other words, we show that is a minimal set. Assume that we have another set that also satisfies Axioms 1, 2, 3, 4, and 5. To show that is minimal, we need to show that if , then .
Assume that two arbitrary , then we know that there exists such that (8) is satisfied. Hence, and . We now show that and ; that is, we show that the DMUs satisfy Axioms 1, 2, 3, 4, and 5. We know the following about (x, y) and : For xV and yV, Axioms 2 and 3 are satisfied from (8.1) and (8.2). Axiom 4 is satisfied because . Combining10 (8.3), (8.4), and (8.5) provides
To show that and satisfy Axiom 5, let us assume that . If we only consider (x, y) and such that this is true, then . Hence, by selecting δ and , as described previously, we find that . In other words, . On the other hand, and are two DMUs that satisfy Axioms 1, 2, 3, and 4 and . Because satisfies Axiom 5, it follows that . □
A.3. Proof of Theorem 3
We focus on a merger I. To satisfy (23), the reallocations must belong to one of the subsets of TFAH, that is, one of the sets . If (23) is true, then we can replace (22) with the following mixed integer linear program:
The expressions reflect free disposability of inputs and outputs in TFAH, and reflect the requirement of a feasible reallocation.
The left-hand sides in (A.3.3) and (A.3.4) only depend on k through the slack/surplus variables. By inserting (A.3.3) and (A.3.4) into (A.3.1) and (A.3.2), we find
By setting , we compute the classical DDF harmony effect:
Appendix B. (Color online) List of Air Navigation Service Providers Grouped According to the Functional Airspace Blocks
1 See https://www.coopans.com/About-Coopans/COOPANS-Value (accessed August 4, 2022).
2 Another (output oriented) measure is .
3 We do not consider constant or non-increasing returns to scale reference technologies because the focus of this research is merger gains, which ought to reflect some degree of increasing returns to scale.
4 The expression TFAH can be viewed from two different perspectives: (1) TFAH is related to the free disposal hull (FDH) technology set. Hence, if we add the constraint , we obtain TFDH; (2) TFAH is related to the Koopmans technology set. Hence, if we add the constraint and relax to , we obtain Koopmans technology (Grosskopf 1986).
5 Volume measures of inputs or outputs use unit measures rather than ratio measures (Olesen et al. 2015). In this paper, we introduce a third measure, which is binary.
6 We are grateful to one of the referees for suggesting this link.
7 For greater details on why Model (13) implies Model (15), see Färe et al. (2013).
8 A costly, radial harmony effect for a nonconvex CRS technology is illustrated in Bogetoft and Wang (2005), and a costly DDF harmony effect for a nonconvex FAH technology is discussed in the case study in Section 6.
9 All DEAmerge models created in the previous sections are nonoriented. In the case study, we assume input orientation and hence drop the second part of the objective functions accordingly.
10 If xB attains its upper bound, that is, , then it is not possible to add anything to this DMU, because any other DMU will be characterized by Because the FDH constraint, is not included, we can have arbitrarily many from . Hence, if we ignore the part of Axiom 5 that conditions the additivity on the binary measures, that is., , then the simple additivity axiom is active.
References
- (2022) Competition in congested service networks with application to air traffic control provision in Europe. Management Sci. 68(4):2751–2784.Link, Google Scholar
- (2015) The efficiency of the regulation for horizontal mergers among electricity distribution operators in Norway. Proc. 12th Internat. Conf. on the Eur. Energy Market (EEM 2015) (Institute of Electrical and Electronics Engineers), 1–5.Google Scholar
- (2007) Gains from quota trade: Theoretical models and an application to the Danish fishery. Eur. Rev. Agricultural Econom. 34(1):105–127.Crossref, Google Scholar
- (2014) The single European sky gridlock: A difficult 10 year reform process. Utilities Policy. 31:289–301.Crossref, Google Scholar
- (2013) Privatization: Principles, Problems and Priorities, Privatization, Regulation and Deregulation (Routledge, Oxfordshire, UK).Crossref, Google Scholar
- (2016) ACCHANGE: Building economic models to analyse the performance of air navigation service providers. J. Air Transportation Management 56:19–27.Crossref, Google Scholar
- (1997) DEA-based yardstick competition: The optimality of best practice regulation. Ann. Oper. Res. 73:277–298.Crossref, Google Scholar
- (2008) Efficiency gains from mergers in the healthcare sector. Technical report, Dutch Healthcare Authority, Utrecht, Netherlands.Google Scholar
- (2011) Benchmarking with DEA, SFA, and R, vol. 157 (Springer Science & Business Media, New York).Crossref, Google Scholar
- (2005) Estimating the potential gains from mergers. J. Production Anal. 23:145–171.Crossref, Google Scholar
- (2003) Efficiency and merger gains in the Danish forestry extension service. Forest Sci. 49(4):585–595.Crossref, Google Scholar
- (2007) Reallocating sugar beet contracts: Can sugar production survive in Denmark? Eur. Rev. Agricultural Econom. 34(1):1–20.Crossref, Google Scholar
- (2008) Mergers and acquisitions in the US property-liability insurance industry: Productivity and efficiency effects. J. Banking Finance 32(1):30–55.Crossref, Google Scholar
- (2013) Directional output distance functions: Endogeneous directions based on exogenous normalization constraits. J. Production Anal. 40:267–269.Crossref, Google Scholar
- (1990) Horizontal mergers: An equilibrium analysis. Amer. Econom. Rev. 80(1):107–126.Google Scholar
- (2001) Scale economies and synergies in horizontal merger analysis. Antitrust Law J. 68(3):685–710.Google Scholar
- (1957) The measurement of productive efficiency. J. Royal Statist. Soc. A 120:253–281.Crossref, Google Scholar
- (1987) Horizontal mergers: Triage and treatment. J. Econom. Perspective 1(2):23–40.Crossref, Google Scholar
- (1979) Generalized Farrell measures of efficiency: An application to milk processing in Swedish dairy plants. Econom. J. (London) 89:294–315.Google Scholar
- (2004) A free coordination hull approach to efficiency measurement. J. Oper. Res. Soc. 55(10):1059–1063.Crossref, Google Scholar
- (1986) The role of the reference technology in measuring productive efficiency. Econom. J. (London) 96:499–513.Google Scholar
- (2010) US/Europe comparison of ATM-related operational performance. Air Traffic Control Quart. 18(1):5–27.Crossref, Google Scholar
- (2002) Quantifying operational synergies in a merger/acquisition. Management Sci. 48(4):517–533.Link, Google Scholar
- (2010) Potential gains from hospital mergers in Denmark. Healthcare Management Sci. 13:334–345.Google Scholar
- (1995) Units invariant and translation invariant DEA models. Oper. Res. Lett. 18:147–151.Crossref, Google Scholar
- (2013) Using DEA to find the best partner for a horizontal cooperation. Comput. Industry Engrg. 66(2):286–292.Crossref, Google Scholar
- (1996) The impact of industry shocks on takeover and restructuring activity. J. Financial Econom. 41(2):193–229.Crossref, Google Scholar
- (1985) Mergers and market share. Rev. Econom. Stat. 67(2):259–267.Crossref, Google Scholar
- (2015) Efficiency analysis with ratio measures. Eur. J. Oper. Res. 245:446–462.Crossref, Google Scholar
- (2013) Industry structural inefficiency and potential gains from mergers and break-ups: A comprehensive approach. Eur. J. Oper. Res. 230:422–430.Crossref, Google Scholar
- (1950) Monopoly and oligopoly by merger. Amer. Econom. Rev. 40(2):23–34.Google Scholar
- (1997) Privatization v. corporatization of the Federal Aviation Administration: Revamping air traffic control. J. Air Law Commerce 3:633–677.Google Scholar
- (2010) Horizontal mergers, structural remedies, and consumer welfare in a Cournot oligopoly with assets. J. Industrial Econom. 58(4):723–741.Crossref, Google Scholar
- (2002) Incentive regulation and competition in public utility markets: A 20-year perspective. J. Regulatory Econom. 22(1):5–27.Crossref, Google Scholar
- (2002) A zero-one programming model for contiguous land acquisition. Geographical Anal. 34:330–349.Crossref, Google Scholar
- (1968) Economies as an antitrust defense: The welfare tradeoffs. Amer. Econom. Rev. 58(1):18–36.Google Scholar
- (2011) Estimation of potential gains from mergers in multiple periods: A comparison of stochastic frontier analysis and data envelopment analysis. Ann. Oper. Res. 186(1):357–381.Crossref, Google Scholar
Nicole Adler is a full professor of operations research and dean of the Hebrew University Business School. Her main fields of research include applied game theory and productivity analysis, mostly applied to transportation markets such as airlines, airports, and air traffic control.
Ole Bent Olesen is professor emeritus of management science in the Department of Business and Economics at the University of Southern Denmark. His research interests include mathematical and statistical modeling of production economics with a focus on productivity and efficiency analysis, in particular data envelopment analysis.
Nicola Volta is an executive director at EY Belgium, where he is part of the Valuation, Modeling, and Economics team. His research interests are benchmarking and productivity analysis of regulated and network industries.

