
Crowdfunding the Front Lines: An Empirical Study of Teacher-Driven School Improvement
Abstract
The U.S. K–12 public education system has been notoriously hard to improve. Some argue new education technologies (EdTech) can help transform schools for the better. Yet, as large-scale policy reforms have had only limited success, it seems unlikely that small changes from EdTech could have any measurable impact. In this paper, we study DonorsChoose, a nonprofit that operates a teacher crowdfunding platform. We ask whether DonorsChoose improves educational outcomes, specifically at low-income schools. Combining DonorsChoose data with data on student test scores in Pennsylvania from 2012–2013 to 2017–2018, we find that an increase in the number of DonorsChoose projects funded at a school leads to higher student performance, after controlling for selection biases. For a school with zero funded projects, one funded project—of about $400 in value—translates to between two to nine more students scoring basic and above in all subjects in high school and science and language arts in primary and middle school. We find this effect is driven mostly by low-income schools, indicating funded projects help close the gap in educational outcomes between students at low- versus high-income schools. Based on a textual analysis of 20,000 statements from all funded teachers describing how project resources are used, we find two channels of improvement most effective in the lowest income schools. We demonstrate that, although DonorsChoose projects are small, they improve outcomes and reduce inequality because they come directly from frontline workers—teachers—who know most intimately the obstacles their students face and how to help.
This paper was accepted by Charles Corbett, operations management.
Supplemental Material: The data files and online appendix are available at https://doi.org/10.1287/mnsc.2022.4331.
1. Introduction
Education technology (EdTech) is transforming K–12 education on multiple fronts. One stream of EdTech platforms, such as Kahn Academy and Outschool, aim to disrupt the traditional brick-and-mortar educational model with online content and virtual schooling. In the United States, many welcome these alternatives because the incumbent system is plagued by persistently poor student performance, large inequalities, and operational inefficiencies (Toppin and Toppin 2016). Yet, the failures of the brick-and-mortar K–12 system also offer opportunities for a new stream of EdTech innovators. Leveraging new innovations in online crowdfunding (e.g., DonorsChoose) and classroom technology (e.g., Seesaw), these innovators aim to strengthen the incumbent system by providing additional technological and financial support to districts, schools, and teachers, improving educational effectiveness and equality (Koehler and Lachney 2019, Manolev et al. 2019).
EdTech companies that choose to collaborate with the incumbent education system, rather than operate outside of it, have an uphill battle. The K–12 system has been notoriously hard to improve. Despite numerous reform efforts, educational outcomes today are still a reflection of inequality in society, with students from poor families performing far worse on average than those from wealthy families (Hanushek et al. 2019). In the COVID era, the achievement gap is expected to widen further because of students from low-income households facing longer learning disruptions (Van Lancker and Parolin 2020). Large-scale, top-down financial investments, such as those that channel around $1,000 more per student per year for multiple consecutive years into low-income schools could help close the performance gap (Jackson et al. 2016, Lafortune et al. 2018). Most EdTech companies are not poised to make that kind of investment; they exist to address a narrow issue (i.e., provide materials, curricula, and equipment) rather than engage in systemic reform.
In this paper, we study one of the most prominent examples of this type of collaborative EdTech platform—the educational nonprofit DonorsChoose, which introduces online crowdfunding technology for public and charter schoolteachers. Like other crowdfunding platforms, DonorsChoose matches a diversified base of entrepreneurial but capital-constrained users of funds—teachers in this case—with a broad base of funding sources ranging from individual donors to institutional funding providers. On the DonorsChoose site, teachers publicly post requests—known as projects—for resources such as supplies, books, chairs/tables, snacks, and technology. After a project is posted, the site operates like a standard crowdfunding platform where anyone can search open projects and donate at any level to any project. When projects are fully funded, the requested resources are ordered by DonorsChoose and sent to the teacher’s school.
DonorsChoose is widely used. As of 2021, more than 80% of U.S. public and charter schools have had at least one teacher post a project on the site, mobilizing nearly 5 million individual donors. More than 600,000 teachers have had projects funded, obtaining resources worth more than $1 billion. However, DonorsChoose exemplifies the challenge facing many EdTech companies seeking to improve the traditional brick-and-mortar education system: it provides a small, microimprovement (funding for classroom projects) to help solve a large, complex problem (educational inequality). In our study, we introduce an operations perspective to quantify the impact of DonorsChoose on educational outcomes and the channels through which the impact can materialize. Specifically, the operations management literature has long theorized that small, frontline improvements to production processes can generate large differences in system performance (Spear et al. 1999, Field and Sinha 2005, Shah and Ward 2007, Tucker 2007). Frontline workers—such as teachers—are closest to the production or service process and thus are most familiar with obstacles, failures, or other inefficiencies. Consequently, they may be well suited for coming up with and implementing incremental changes that directly impact the customer (student) experience (Tucker 2007, Tucker et al. 2008, Robinson and Schroeder 2009, Tucker 2016).
Our study thus explores three research questions. (1) Do small, teacher-led improvement projects improve student learning outcomes at the school? (2) If so, does the effect of teacher-led improvement projects differ between low- and high- income schools? (3) What are the potential channels—particularly operations-related channels—that could explain the findings? Our data are school performance metrics and DonorsChoose projects posted and funded from all public (including charter) schools in Pennsylvania from 2012–2013 to 2017–2018. We observe a negative selection effect, unsurprising given DonorsChoose’s nonprofit status: schools that get funded through DonorsChoose are typically lower performing than schools that do not. We first use fixed-effects panel data models to adjust for school-level selection bias. We then exploit unanticipated funding events (e.g., flash funding, donation matching) as an exogenous shock to project funding rates. Because these events flash fund or match donations of all open projects statewide or in a specified region, they substantially increase the funding probability of a school’s project if it is eligible. We therefore use the eligibility for such funding events to create an instrument to the total number of funded projects. We carefully select only unanticipated events such that the shock only affects which projects are funded but not which projects are posted.
We find that a 10% increase in the number of funded projects leads to a 0.03 increase in the School Performance Profile metric, a composite holistic measure of school quality that evaluates all K–12 schools in Pennsylvania on a scale of 1 to 100. We also find a positive effect on the state’s two standardized exams, the Keystone (for high schools) and Pennsylvania System of School Assessment (PSSA; for elementary and middle schools). For high schools in Pennsylvania, we find that a 10% increase in the number of funded projects at the school leads to a 0.1- to 0.2-percentage-point (pp) increase in students scoring basic and above in all tested Keystone exam subjects (literature, algebra, biology). For elementary and middle schools, we find that a 10% increase in the number of funded projects at the school leads to a 0.06-pp increase in the percentage of students scoring basic and above on the PSSA language arts, a 0.15-pp increase in PSSA science, and no significant effect for mathematics. These results suggest that for a school with no projects, a single funded project (about $400 in value) on average achieves a 0.4- to 1.6-pp increase in the percentage of students scoring basic and above on all tested subjects in high school, as well as science and language arts in primary and middle schools. This effect translates to between two and nine additional students moving up to at least a basic level of proficiency in the tested subjects with one funded project. Moreover, we observe that these positive effects are driven mostly by projects from the lowest-income schools (schools with the highest proportion of students who qualify for free/reduced price lunch). At these low-income schools, projects on average move between 4 and 10 additional students to at least a basic level of proficiency in tested subjects.
Next, to better understand the potential channels behind this effect, we analyze the textual contents of more than 20,000 impact statements written by all funded teachers after the completion of their projects. These statements are a useful means for us to understand the channels of improvement, because in these statements, teachers usually provide a firsthand account of how the resources are used in and outside the classroom and in what way students are impacted. We perform the analysis separately for low- and high-income schools. In particular, we identify four main channels for how resources are used: (1) to improve knowledge retention, (2) as a learning tool used by students repeatedly over time or shared across the school, (3) to differentiate or personalize learning, and (4) to streamline classroom work processes. We then use a bag-of-words algorithm to quantify the presence and the extent of these channels for all impact statements in our data. In the lowest income schools, we observe that teachers achieve their large performance impact through the first two channels. They use new resources to improve students’ knowledge retention through better focus and fewer distractions and ensure the new resources they secure are used repeatedly over time, sometimes also sharing the resources widely with other teachers. When improvement projects at higher-income schools have an impact, it is through the third channel, with projects that focus on differentiating lessons across subgroups of students.
Our study makes two contributions to the operations literature on frontline workers (Shah and Ward 2007, Tucker et al. 2008, Robinson and Schroeder 2009, Tucker and Singer 2015, Tucker 2016). First, we contribute a large-scale empirical study of frontline worker projects implemented across hundreds of organizations over time. Our study demonstrates the projects’ effectiveness across heterogeneous organizational settings, in a context (education) that has been notoriously difficult to improve. Second, we contribute a new perspective on frontline workers as a vehicle for reducing inequality in outcomes across organizations: Our results indicate that workers serving customers with greater resource needs have greater opportunities for improvement, making their projects more effective at the margin than similar projects in better-resourced environments. Our findings also have implications for education policymakers and EdTech companies. To education policymakers, our findings suggest it may be beneficial to complement large-scale top-down reforms with bottom-up, teacher-led interventions, potentially achieving a more efficient resource utilization with a lower financial outlay. To EdTech companies, our findings indicate that innovations to support the traditional brick-and-mortar school system have the ability to make a difference—even with small interventions—if those interventions occur close to students and are adaptable by teachers to meet students’ heterogeneous needs.
2. Literature Review
With manufacturing systems in mind, process improvement models, such as the Deming management method (Deming 1982, Anderson et al. 1994), kaizen (Brunet and New 2003), and lean (Naylor et al. 1999, Shah and Ward 2003), each highlight the importance of small frontline changes, continuous improvement, and employee ownership over process performance. The idea is that when organizations empower frontline workers to diagnose small problems that create systemic inefficiencies or failures and subsequently implement frontline solutions, the process improves from the bottom-up. For example, one of the four rules of the Toyota production system is that “Any improvement must be made in accordance with the scientific method…at the lowest possible level in the organization” (Spear et al. 1999, p. 98). At Toyota, managers do not tell workers specifically how to do their work. Rather, managers help workers uncover best practices for their work processes by asking questions such as, “How do you know when you have done the work correctly? How do you know there are no defects? What do you do if you face a problem in completing the work?” (Spear et al. 1999).
Although originating in manufacturing, the frontline worker theory has been adapted to the service sector, primarily in healthcare (Tucker 2004, 2007, 2016; Tucker et al. 2008). This body of work has found that frontline workers in hospitals—for example, nurses or other staff that provide patient care—experience frequent operational failures, such as breakdowns in the materials, information, or equipment necessary for helping patients (Tucker 2004, 2007; Tucker et al. 2008). The failures frontline hospital workers observe and experience, however, differ from those the top-level managers believe to be the major operational issues regarding patient care. For example, Tucker et al. (2008) devised an intervention that required managers to elicit safety-related concerns from frontline staff. The intervention identified two kinds of failures as most prevalent: equipment failures (e.g., missing equipment, broken equipment, or other failures that require finding a substitute or doing without) and facility failures (e.g., insufficient heating/cooling, insufficient facility cleanliness, poor lighting, or a lack of automatic doors). Despite the dominance of these issues in the minds of frontline workers closest to the patients, these issues were not included as priorities in national patient safety initiatives. The education system has similarities to the healthcare setting in that managers—principals and district leaders—may not have an understanding of the obstacles faced by frontline workers—the teachers—and what they need to improve student learning. Conversely, the education setting is also different in that teachers have the ability to independently implement their improvement projects, through spending money out of pocket or securing resources on Donors-Choose. This difference makes the education setting a useful one in which to further develop existing theory on the effect of frontline improvement projects.
DonorsChoose captures hundreds of thousands of ideas from teachers about how they want to improve student learning. These ideas come from hundreds of different types of schools, in different locations, over time. Moreover, some have been funded and implemented and some have not. Given its promise as a research setting, some have examined the Donors-Choose platform from other angles. Wash and Solomon (2014) and Althoff and Leskovec (2015) use data from the platform to study donor retention. Meer (2014) uses the market design on DonorsChoose to study the price of charitable giving, and donor elasticity to it. Koning and Model (2013) study donation cascades, or the sequencing of donations on projects, and their impact on the project’s funding outcome. Two papers, Gao et al. (2020) and Zhou et al. (2022), are most similar to our own study in that they study student performance outcomes. Both Gao et al. (2020) and Zhou et al. (2022) use data from elementary and middle schools in California from 2003–2004 to 2012–2013 to measure the effect of funded projects on student test score outcomes, and both find a positive effect. Our study differs from the existing studies of DonorsChoose in three key ways. First, we are interested both in overall performance effects of funded projects on DonorsChoose and the differential performance effects between high- and low-income schools. Second, we leverage our relationship with DonorsChoose and knowledge of their funding events (i.e., flash funding and donor match days) to come up with an instrument that helps us identify the causal effect of DonorsChoose projects. Third, we conduct a detailed textual analysis of the site’s impact statements to better understand the key channels through which teachers use resources from DonorsChoose to improve performance. With these differences, our study is situated to make a contribution to both frontline worker theory and our understanding of how EdTech companies like DonorsChoose impact school effectiveness and equality.
3. Data and Background
The objective of our study is threefold: to evaluate the impact of teacher-initiated DonorsChoose-funded projects on school performance, to understand the impact of projects specifically on reducing educational inequality, and to illuminate the channels through which funded projects achieve these effects. Given variation in school performance metrics across states, we focus our analysis on a single state: Pennsylvania. The following sections describe relevant background information: first about the DonorsChoose online platform and then about Pennsylvania and its education system. After this background, we discuss the details of the data used for our analysis.
3.1. Background: DonorsChoose
DonorsChoose is a nonprofit organization founded in 2000. It runs an online crowdfunding platform where any teacher working in publicly funded U.S. schools can post a “project” request for resources they need but that their school does not provide. DonorsChoose’s mission is to prioritize serving schools with a high proportion of students from low-income households. Their mission is: “We make it easy for anyone to help a classroom in need, moving us closer to a nation where students in every community have the tools and experiences they need for a great education.”
Commonly requested resources include books, technology, supplies, and furniture (e.g., chairs, shelves). Some projects request consumable supplies (e.g., markers, paper, snacks), yet most projects request durable goods with long useful lives (e.g., printers, calculators, headsets, a class set of novels). When teachers put together a project request, they select the items requested from vendors working with DonorsChoose (e.g., Amazon, Staples, Blick). Based on selections, the site determines the value of the project in dollars. This value is what the teachers need to secure through donations. In the project request, teacher describe their needs, plans for using the resources, and characteristics of their respective schools and students. Although some projects are earmarked for a specific subject and/or grade (e.g., calculators for ninth-grade math), many other projects are instead broader in scope (e.g., flexible seating for a special needs classroom) and often include requests for durable resources that could be shared across classrooms.
Once projects are live, they can receive donations of any dollar amount from any donor, who are free to browse through and choose from all available projects on the platform. Once a project is fully funded, the teacher is notified, DonorsChoose fulfills the order from the vendor, and the resources are shipped to the teacher’s school. Schools only receive resources if the teacher’s project is fully funded before the project expiration date (typically four to five months from the posting date). There is no partial fulfillment. If successfully funded, teachers are required to put together a virtual debriefing package for donors within the next few months. The package includes an “impact statement” of how the resources made an impact on students.
Around 70% of projects are fully funded. To achieve this fulfillment rate, DonorsChoose relies significantly on corporate donors in addition to individual donors. For-profit companies and nonprofit organizations partner with DonorsChoose to fund projects on a large scale. In Section 3, we describe how we leverage large institutional donations that fund all open projects en masse during funding events for identification purposes.
3.2. Background: Pennsylvania Education System
We selected Pennsylvania as the state for analysis because it is known for its large funding disparity between low- and high-income districts. According to a report published in 2015 by The Education Trust (Ushomirsky and Williams 2015), Pennsylvania had the third-largest disparity in state and local revenues per student between the districts serving the highest and lowest number of students in poverty. They found that in Pennsylvania the gap was around 8%, whereas in 31 other states, districts serving a larger number of students in poverty received more state and local revenues per student, not less. A fair funding formula was introduced in the state for the 2015–2016 school year, yet the funding disparities have persisted (Klehr 2019). In February 2020, Pennsylvania Governor Wolf proposed a new school finance reform bill to try again to rebalance funding. This ongoing funding disparity means Pennsylvania is a good candidate to examine the potential effect of resources secured DonorsChoose on inequality. See Online Appendix A for additional statistics comparing Pennsylvania to the United States as a whole.
3.3. Data
For our analysis, we require data on school performance outcomes, DonorsChoose projects (successfully funded and not successfully funded), and other characteristics that are known to impact performance outcomes. We collect data from three sources: school performance outcomes via the Pennsylvania Department of Education, school-level project data via DonorsChoose, and other school characteristics via the National Center for Education Statistics (NCES). Table 1 in the Online Appendix reports key summary statistics from our combined data set.
3.3.1. Pennsylvania Department of Education Data.
The Pennsylvania Department of Education provides open data on school performance1 and is our source of school outcome measures. For our analysis, we consider two measures of school performance. The first is student performance on state exams. Starting in 2014–2015, Pennsylvania administers two state exams each year: the PSSA to elementary and middle school students and Keystone exams to high school students.2 The PSSA exam is given to students in grades 3 through 8 in two subject areas, language arts (ELA) and math, and given to students in grades 4 and 8 only in one subject area, science. In each area, students are categorized into one of four levels based on their performance in the area: advanced, proficient, basic, or below basic. The Keystone exam given to high school students also has three subject areas: algebra, biology, and literature. Our data indicate the number of students in grade 11 that have scored advanced, proficient, basic, and below basic on each Keystone subject area.
Additionally, we assess school performance using the School Performance Profile (SPP), a holistic measure calculated by the state that takes into account the school’s standardized test scores in combination with measures that indicate how the school performs in the current year relative to their past performance. The SPP is on a scale of 1 to 100 with real scores between 5 and 104 (schools can earn extra credit for high performance). The first year for which SPP scores are available is 2012–2013. We have SPP scores each year with the exception of 2014–2015 for elementary schools.3 We focus our analysis on the seven-year period from 2012–2013 to 2017–2018 for the SPP outcome and the four-year period from 2014–2015 to 2017–2018 for PSSA and Keystone outcomes.
In addition to performance metrics, we also collected data from the state on annual school district expenditures (because school finances are only reported at the district, not school, level). We collect data on multiple expenditure categories, of which we identified the most relevant to be supplies, salaries, and property. The “supplies” category includes expenditures at the school level (books, technology, paper, pencils) and at the district level, where resources like meals and electricity are distributed to schools. The “salaries” category includes expenditures on salaries for teachers and for other district employees such as office/clerical staff, operations workers, school safety officers, bus drivers, etc. “Property” includes expenditures for land, equipment, or replacement of equipment such as servers, computers, printers, and software. We understand these expense categories include noninstructional expenses.4 For our study they are most relevant, however, because they capture the money the district is spending on making sure teachers and students have the environment and supplies they need to be successful, needs that correspond most closely to what we observe as common requests on DonorsChoose.
3.3.2. DonorsChoose Data.
We entered into a data-use agreement (DUA) with DonorsChoose in the fall of 2019, which gave us access to DonorsChoose internal data portal. Around that same time, DonorsChoose took down their open data site and transitioned to sharing data exclusively with vetted researchers. With a formal research agreement, we were able to establish a trusting and close working relationship with the organization, in addition to maintaining data access. We leveraged their data science team to better understand their process and platform design, as well as the funding events central to our identification strategy. Data were available for the entire history of DonorsChoose, meaning on projects posted in Pennsylvania from 2006 (when the first project was posted in the state) to 2019. However, 85% of projects posted in Pennsylvania occurred in 2012 and onward, meaning the focus period of our study (2012–2013 to 2017–2018) is after an initial growth period for DonorsChoose from 2006 to 2011.
Every project posted on DonorsChoose is identified in the data with a unique project identifier. For each posted project, the data include the date posted, the dollar amount of the project, dollar amount successfully raised, resources requested, number of students impacted (as reported by teachers in their project request), and date the project was fully funded (if successful) or expired (if not successful). For fully funded projects, the data include the entire text of the teacher’s impact statements. There are about 13,000 unique teacher identifiers in our data. An average teacher posts three projects and gets two projects fully funded across all years. It is important not to assume teachers who post are representative of an average teacher. Posting teachers have a well-tailored idea of what resources would be instrumental for improving student learning at their school. Also, posting teachers may be the ones at their school who are more committed to the school and its students.
To map DonorsChoose projects to school outcomes, we aggregate project data to the school–year level for two reasons. First, although projects are posted by a specific teacher, projects impact more than just a single classroom of 25 to 30 students. Table 1 in the online appendix shows the summary statistics of projects posted and funded under DonorsChoose Activities. Notably, teachers report that a project reaches, on average, 100 students. Thus, projects are meant to have a wider impact across classrooms, grades, or across subject areas. This could be because teachers have multiple roles in the school (as is common in low-income schools) or because teachers share resources with their colleagues across grades or subject areas (Valli and Buese 2007). Second, though standardized tests are associated with a particular grade and subject area, they capture wider learning at the school. For example, arts, music, and language arts classes have been shown to improve math and science learning (Pearson et al. 2010, Robelen 2011). In other words, both the variables of interest, DonorsChoose-funded projects and test scores, are measured at the school level.
We adopt the following convention to assign DonorsChoose projects to a particular academic year: a project posted in the fall term is assigned to the current school year, but a project posted in the spring term is assigned to the following school year. Therefore, a project posted in the year 2015 is assigned to the 2015–2016 school year, a project posted in 2016 is assigned to the 2016–2017 school year, and so on. The data support this convention. About 90% of posted projects have an expiration date four to five months after the posting date. Among funded projects, the average time until a project is fully funded is 35 days. After that point, it still takes time for teachers to receive the resources. According to the DonorsChoose website, “During the school year, we send orders to vendors within five business days…Most materials arrive in the classroom within two weeks of that notification email, with the exception of furniture and large items (e.g., rugs), which may take a bit longer.” This suggests that after a project is fully funded, an additional three weeks pass before resources arrive, after which teachers still need to incorporate them into their classes. On average, there appears to be about a semester’s lag between when a project is posted and when resources are in a classroom impacting students, motivating our project-year assignment decision.
3.3.3. NCES Data.
The NCES provides basic statistics on U.S. schools through its Elementary/Secondary Information System (ElSi) application. We collect school metrics from 2012–2013 to 2017–2018, and match them to the DonorsChoose data, which include the NCES identifier. Online Appendix B describes how we deal with a small number of projects without a school NCES identifier. Through the ElSi application, we generate tables on all schools in Pennsylvania on two school characteristics: enrollments (overall, free/reduced priced-lunch (FRPL) eligible, and in different racial and ethnic subgroups) and student-teacher ratios. Following the norm in education research, we use the proportion of students at a school eligible for FRPL to differentiate between low- and high-income schools. These serve as additional school-year controls, shown under School Attributes in Table 1.
|

Table 1. Summary Statistics
| All schools | Without funded projects | With funded projects | |||||||
|---|---|---|---|---|---|---|---|---|---|
| School attributes | N | Mean | SD | N | Mean | SD | N | Mean | SD |
| Enrollment | 17,807 | 579.6 | 459.1 | 13,126 | 564.6 | 475.1 | 4,681 | 621.6 | 411.1 |
| Percent FRPL | 17,365 | 47.6 | 28.1 | 12,819 | 41.5 | 24.5 | 4,546 | 64.8 | 30.1 |
| Percent Asian/Pacific Islander | 17,802 | 3.0 | 5.3 | 13,122 | 2.8 | 24.3 | 4,680 | 3.7 | 37.2 |
| Percent Black | 17,802 | 14.8 | 5.3 | 13,122 | 9.8 | 4.4 | 4,680 | 28.9 | 7.1 |
| Percent Hispanic | 17,802 | 8.9 | 25.0 | 13,122 | 7.2 | 19.0 | 4,680 | 13.7 | 33.1 |
| Percent Native American | 17,802 | 0.2 | 15.6 | 13,122 | 0.2 | 12.8 | 4,680 | 0.2 | 20.8 |
| Percent White | 17,802 | 73.1 | 15.6 | 13122 | 80.1 | 12.8 | 4680 | 53.5 | 20.8 |
| Student-teacher ratio | 17,763 | 15.0 | 30.6 | 13,091 | 14.8 | 24.3 | 4,672 | 15.5 | 37.2 |
| District annual expenditure per student (in $1,000) | |||||||||
| Salary | 17,759 | 7.0 | 1.5 | 13,085 | 7.1 | 1.5 | 4674 | 6.6 | 1.5 |
| Supplies | 17,759 | 0.6 | 0.2 | 13,085 | 0.6 | 0.2 | 4,674 | 0.5 | 0.2 |
| Property | 17,759 | 0.2 | 0.3 | 13,085 | 0.2 | 0.3 | 4,674 | 0.2 | 0.4 |
| School performance | |||||||||
| SPP | 15,309 | 71.8 | 13.5 | 11,230 | 74.2 | 12.6 | 4,079 | 65.2 | 14.0 |
| Keystone % advanced | |||||||||
| Literature | 2,707 | 7.4 | 6.8 | 1,979 | 8.1 | 6.9 | 728 | 5.5 | 6.1 |
| Algebra | 2,710 | 17.1 | 13.7 | 1,981 | 18.3 | 13.6 | 729 | 13.6 | 13.4 |
| Biology | 2,707 | 21.2 | 15.5 | 1,979 | 23.2 | 15.4 | 728 | 15.7 | 14.5 |
| Keystone % proficient and above | |||||||||
| Literature | 2,707 | 71.1 | 19.5 | 1,979 | 73.5 | 17.6 | 728 | 64.7 | 22.8 |
| Algebra | 2,710 | 62.6 | 22.3 | 1,981 | 65.6 | 20.4 | 729 | 54.6 | 25.3 |
| Biology | 2,707 | 59.4 | 23.4 | 1,979 | 62.8 | 21.1 | 728 | 50.0 | 26.4 |
| Keystone % basic and above | |||||||||
| Literature | 2,707 | 92.0 | 9.9 | 1,979 | 93.0 | 8.6 | 728 | 89.0 | 12.4 |
| Algebra | 2,710 | 90.1 | 11.7 | 1,981 | 91.4 | 10.4 | 729 | 86.5 | 14.2 |
| Biology | 2,707 | 82.5 | 18.5 | 1,979 | 85.1 | 15.8 | 728 | 75.5 | 22.8 |
| PSSA % advanced | |||||||||
| ELA | 9,417 | 18.4 | 12.3 | 6,421 | 20.7 | 12.1 | 2,996 | 13.5 | 11.3 |
| Math | 9,417 | 17.2 | 13.2 | 6,421 | 19.4 | 13.2 | 2,996 | 12.4 | 11.7 |
| Science | 8,863 | 32.6 | 19.4 | 5,971 | 36.9 | 18.2 | 2,892 | 23.8 | 18.9 |
| PSSA % proficient and above | |||||||||
| ELA | 9,417 | 60.8 | 19.4 | 6,421 | 65.5 | 16.3 | 2,996 | 50.7 | 21.6 |
| Math | 9,417 | 43.5 | 21.3 | 6,421 | 47.9 | 19.6 | 2,996 | 34.1 | 21.7 |
| Science | 8,863 | 69.0 | 22.4 | 5,971 | 74.3 | 18.8 | 2,892 | 58.0 | 25.2 |
| PSSA % basic and above | |||||||||
| ELA | 9,417 | 90.2 | 9.7 | 6,421 | 92.5 | 7.2 | 2,996 | 85.3 | 12.1 |
| Math | 9417 | 70.8 | 19.8 | 6,421 | 75.5 | 16.3 | 2,996 | 60.9 | 22.8 |
| Science | 8,863 | 86.3 | 15.8 | 5,971 | 89.4 | 12.7 | 2,892 | 79.9 | 19.1 |
| DonorsChoose activities (measured per school per school-year) | |||||||||
| No. Project posted | 17,807 | 1.7 | 6.8 | 13,126 | 0.1 | 0.4 | 4,681 | 6.1 | 12.2 |
| No. Project funded | 17,807 | 1.2 | 5.2 | 13,126 | 0.0 | 0.0 | 4,681 | 4.6 | 9.3 |
| Dollar amount funded | 17,807 | $478.0 | $2,007.6 | 13,126 | $0.0 | $0.0 | 4,681 | $1,818.3 | $3,591.3 |
| Students reached | 17,807 | 118.8 | 542.4 | 13,126 | 0.0 | 0.0 | 4,681 | 451.9 | 984.2 |
Notes. Data are from the 2012–2013 school year to the 2017–2018 school year. Data are only available starting from the 2014–2015 school year for Keystone/PSSA test scores.
3.4. Fixed Effects Model
The objective of the study is to evaluate the impact of teacher-initiated projects funded through DonorsChoose on school performance, particularly in low-income schools that serve a high proportion of students eligible for FRPL. However, directly comparing performances of schools funded and those not funded through DonorsChoose can be subject to a strong selection bias. This is because those schools funded through DonorsChoose are typically the ones in greater need, that is, high poverty and low performing. As shown in Table 1, these are the schools with higher proportions of students eligible for FRPL (64.8% versus 41.5% on average), greater percentages of Asian (3.7 versus 2.8%), Black (28.9 versus 9.8%), and Hispanic (13.7 versus 7.2%) students, higher student–teacher ratios (15.5 versus 14.8), and worse performance in state-wide standardized tests (for example, 14.2% versus 10.4% scored basic and above in Keystone Algebra). There are two sources of selection bias, as demonstrated in Online Appendix Table A2. First, schools with greater needs are more likely to post on DonorsChoose. Second, conditional on posting, schools with greater needs are more likely to attract donations and get their projects funded. Not surprisingly, a direct cross-sectional comparison of schools funded and not funded through DonorsChoose would lead to the conclusion that schools that receive funding perform worse. Therefore, it is important to control for observable and unobservable confounding factors that jointly affect schools’ performance and their likelihood of receiving funds from DonorsChoose. In the main analysis, we are agnostic to the sources of selection but try to address both. This allows us to include all Pennsylvania schools in the analysis, thus increasing the external validity of our approach. For additional robustness, we also apply the same empirical model conditional on schools that have posted and compare the results. Specifically, we estimate regression models of the form:
where the subscript i denotes school and t denotes school year. The variable yit denotes performance of school i in school year t, which is either the SPP metric or the percentage of students scoring basic and above, proficient and above, and advanced, respectively, on the Keystone and PSSA exams. These performance metrics are evaluated toward the end of the school year. The variable Nit denotes the number of DonorsChoose-funded projects for school i in school year t. Recall that when counting the number of projects for a given school year, we adopt a semester’s lag between when a project is posted and when it is applied, as discussed in Section 3. The number of funded projects is log scaled because it is right-skewed, and we expect the marginal impact of a funded project to decrease with the total number of projects funded.5 In addition to the total number of projects funded, we also analyze the impact of total dollar amount funded and total students reached as reported by teachers on school performance. Because most projects (more than 70%) posted on DonorsChoose are eventually funded, the number of funded projects and the number of posted projects are highly correlated (correlation > 0.97). Therefore, to avoid collinearity, we do not separately control for the number of posted projects in the main analyses. As a robustness analysis, we find that controlling for the number of posted projects reduces the statistical significance because of high collinearity but yields very similar estimates.6
The vector Xit includes time-variant school attributes, including total enrollment (log scaled), percent of students eligible for FRPL, percent of students in each racial and ethnicity group, and student–teacher ratio. Our controls also include district-level expenditure per student in three major categories—salary, supplies and property. The variable ηt denotes the year fixed effect, ξi denotes school fixed effects, and ϵit denotes the idiosyncratic shock to school i’s performance in year t. The inclusion of school fixed effects allows us to adjust for unobserved school-fixed factors that affect both outcome (school performance) and selection (the likelihood of being funded through DonorsChoose). Therefore, the effect that we measure in this regression is primarily driven by time-series variations within schools conditional on observed (time-variant) and unobserved (time-invariant) school characteristics. The parameter of interest is β, and a positive/negative estimate would indicate that DonorsChoose-funded projects improve/worsen school performance.
3.5. Instrumental Variable
Although the inclusion of school fixed effects allows us to control for school-fixed factors that affect both outcome and selection, there may be other time-varying factors that could affect both outcome and selection as well but are uncontrolled for in the specification. For example, suppose that in a particular year a school has a larger enrollment of under-performing students, whose performance cannot be fully captured by observable factors such as FRPL, race, or ethnicity. Then, if a teacher from the school posts a project on DonorsChoose and includes information about the enrollment in the project, the project is more likely to attract donors and get funded if donors prefer to fund under-performing schools. This uncontrolled selection at the funding stage will likely generate a downward bias for the estimated effect (β). To further account for this possibility, we use an instrumental variable strategy that exploits unanticipated funding events that directly affect the likelihood of being funded on DonorsChoose but are not directly correlated with school performance in that year.
Specifically, we first identify a series of funding events during our study period that substantially increase a project’s probability of being funded. These events include flash funding events that targeted all projects nationwide or in specific regions. For example, Staples funded all projects in Philadelphia on August 4, 2014. During a flash funding event, an eligible project is funded regardless of school type or its level of economic need—criteria that donors commonly use to select which projects to donate to on DonorsChoose.
Similar to flash funding events, donation match events are the other type of event that can substantially increase a project’s probability of being funded. For example, DonorsChoose held a Best School Day event on March 29, 2017, where donations on all projects were matched. During a donation match event, all eligible projects are more likely to be funded, not because they are associated with schools with greater needs compared with projects posted during other times, but because donations for these projects are matched. Figure 1 illustrates the increased funding probability during flash funding and donation match events. It is obvious from this figure that during an event day, a substantially larger number of projects—100 to 1,000 projects—are funded compared with an average day, when only one to two dozen projects are funded.
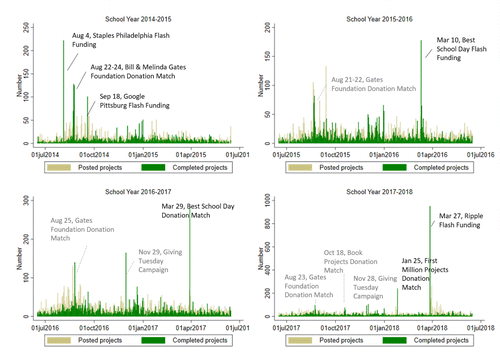
Notes. This figure displays the number of projects posted and the number of projects funded on DonorsChoose at daily level for school years from 2014–2015 to 2017–2018. Flash funding events are identified with texts. Events that are unanticipated are called out in black, and events that are preannounced or likely anticipated are called out in gray. See Online Appendix C for the details of each event and when they are announced. There were no flash funding or donation match events during school years 2012–2013 and 2013–2014. Because there is about a semester’s lag between when a project is posted and when the resources will be used in classrooms, some projects are eligible for the funding events in early 2018, but their impacts will not be materialized until the 2018–2019 school year.
However, for these events to serve as quasi-experiments, they cannot be anticipated. If teachers or schools can anticipate these events or receive advance notice of their occurrence, then we would expect more teachers to post shortly before these event to get their projects funded more easily. That is, schools that would otherwise not have posted on DonorsChoose would post before the event to exploit the generous funding opportunity. This strategic posting would once again result in selection bias if these schools are different from those schools that post regardless of funding events: These schools could be the less needy schools that typically do not request funding from DonorsChoose. Or conversely, these schools could be more needy schools trying all they can to secure more funding during these events.
We take two steps to ensure the events that we use are neither preannounced nor anticipated. First, we examine the data for project posting patterns right before each event and compare them with posting patterns during a similar time window in other years. If an event is anticipated, we would not only observe a significant increase in the number of funded projects on the event day, but also see a significant increase in the number of posted projects in the few days before the event. A few funding events fit this criteria and are thus eliminated. For example, we observe a significant increase in the number of posted projects right before the Bill and Melinda Gates Foundation event on August 21 and 22, 2015, as shown in Figure 1. In the next step, we examine all DonorsChoose Twitter posts leading up to each funding event to see whether the event is preannounced. While most events are only announced on the day of the event, a few are announced prior to the event date and are thus eliminated. For example, the Giving Tuesday event on November 29, 2016, was announced via the DonorsChoose Twitter account one week earlier. We categorize such events as anticipated even when we do not observe a significant increase in the number of posted projects before the event because they were announced ahead of time. We label the anticipated and unanticipated events identified by the two steps separately in Figure 1. Online Appendix C provides further details for each event in our sample.
Moreover, for these events to be quasi-experiments, they cannot be selective in nature. That is, the inclusion of a project in a funding event cannot be conditional on the nature of the project (e.g., project type or percentage of students eligible for FRPL). All the events we thus selected are either nationwide events or events in a wide geographical area such as a major U.S. city (e.g., Philadelphia and Pittsburgh). Events that are only open to a selective set of projects based on the project type (book, art or technology projects, for example) or based on donor-imposed criteria are not valid funding events for our purpose.
In total, we obtain seven funding events during our sample period that are unanticipated and unconditional in nature. The events spread fairly widely across the academic year (in August, September, January, and March), and they do not cluster at specific times of the year such as the beginning of an academic semester or a holiday. Given that a posted project typically has its expiration date four to five months after its posting date, these funding events collectively cover projects posted almost in every month of the year.
Next, to define whether a project is eligible for one of these funding events, we examine the project posting and expiration dates, as well as its school location. If a project’s posting date is before the funding event, the expiration date is after the funding event, and the school is located in the region that the funding event targets, then we define the project as eligible for the funding event. If there is a recent funding event—anticipated or not—before the current event, we further require the posting date to be after that event. For example, to be eligible for Ripple Flash Funding event on March 27, 2017, the posting date of the project has to be after the donation match event on January 25, 2017, and before March 27, 2017.7
Once we have defined a project’s eligibility for these funding events, we then aggregate the eligible projects to the school–year level. Specifically, we count the number of eligible projects from each school in each year, applying the same semester lag as before. We then use the number of projects eligible for a funding event at school i in year t, Eit, as the instrument for the number of projects funded, Nit.8 Both numbers are log scaled.
Finally, a caveat of the instrument is that although the events are unanticipated, schools that do not post any project on DonorsChoose in a given year would obviously have zero eligible projects. As such, these unanticipated funding events provide an exogenous shock at the funding stage but not at the posting stage. Therefore, it addresses the negative selection in which schools get funded conditional on posting, but not which schools post their projects. In other words, the instrument may still be subject to negative selection taking place at the posting stage, which biases us against finding a positive impact from funded projects. This could lead to two possible scenarios. One possibility is that, after controlling for time-variant school attributes and school fixed effects, selection at the posting stage is greatly reduced, if not eliminated. The other possibility is that the selection at the posting stage is not adequately addressed, and we consequently underestimate the impact. To examine both scenarios, we repeat our main analysis on the subsample of schools that have posted at least one project, and compare the results to those obtained from the full sample. If selection at the posting stage is adequately addressed, there would not be a significant difference in the two sets of estimates. If some selection issue does manifest in the posting stage, then we could expect the estimates from the subsample analysis to be larger in magnitude than those from the main analysis. We present these results in Table A8 of the online appendix. We do not find evidence of the latter scenario. Nevertheless, when interpreting the results, one should still be mindful of the selection issue at the posting stage and note the possibility that the potential impact of project funding might be larger in magnitude than we document in our main analysis.
4. Results
In this section, we first discuss the estimation results from the fixed-effects model (FE) and then present results from our key model with instrumental variables (IVs). We then examine the potential heterogeneous effects across schools with different proportions of students eligible for FRPL.
4.1. Baseline Results
Table 2 reports the results from the fixed-effects model. We find DonorsChoose-funded projects have a significant positive impact on school performance, as measured by the SPP score and the Keystone (high schools) and PSSA (middle and elementary schools) exam scores. The positive impact suggests that the inclusion of time-variant school attributes and school-level FE is able to address the selection bias at least to some extent, because otherwise we would observe schools with more funded projects associated with lower SPP and exam scores. Specifically, changing from zero to one funded project leads to a 0.18 (i.e., ) increase in the SPP score. Although interpretation of changes in SPP is not straightforward because of its composite nature, changes in test scores are easier to interpret. At the high school level, changing from zero to one funded projects leads to a 0.3- to 0.7-pp increase in students scoring basic and above in all tested subjects (literature, algebra, biology). Increases in the percentage of students scoring proficient and above in these subjects are similar in magnitude, as shown in Table A3 of the online appendix.9
|
Table 2. Impact of Funded Projects on School Performance
| SPP | Keystone basic and above | PSSA basic and above | |||||
|---|---|---|---|---|---|---|---|
| Literature | Algebra | Biology | ELA | Math | Science | ||
| No. of projects funded (log-scaled) | 0.257* | 0.505* | 0.453* | 0.939** | 0.290*** | 0.133 | 0.701*** |
| (0.142) | (0.258) | (0.262) | (0.447) | (0.112) | (0.127) | (0.190) | |
| No. of students (log-scaled) | −4.356*** | 0.342 | 2.028 | −4.756 | −3.081*** | −4.314*** | −5.213*** |
| (0.906) | (2.027) | (1.792) | (3.234) | (1.101) | (1.120) | (1.844) | |
| Percent FRPL | 0.012 | 0.025** | 0.004 | −0.008 | 0.000 | 0.009 | −0.003 |
| (0.008) | (0.011) | (0.009) | (0.016) | (0.005) | (0.007) | (0.010) | |
| Percent Asian | −0.057 | −0.023 | −0.029 | −0.414* | −0.184*** | 0.063 | −0.208*** |
| (0.071) | (0.166) | (0.162) | (0.216) | (0.043) | (0.063) | (0.076) | |
| Percent Black | −0.280*** | −0.025 | 0.121 | −0.057 | −0.176*** | −0.294*** | −0.204*** |
| (0.048) | (0.123) | (0.108) | (0.193) | (0.051) | (0.056) | (0.073) | |
| Percent Hispanic | −0.169*** | −0.052 | −0.058 | 0.043 | −0.077* | −0.226*** | 0.025 |
| (0.049) | (0.136) | (0.127) | (0.166) | (0.044) | (0.052) | (0.068) | |
| Percent Native | 0.390* | 0.518 | 0.023 | −0.191 | 0.026 | 0.063 | −0.073 |
| (0.209) | (0.436) | (0.394) | (0.416) | (0.074) | (0.080) | (0.112) | |
| Pupil-teacher ratio | −0.002 | −0.008 | −0.013 | 0.015 | 0.030 | −0.017 | −0.042* |
| (0.004) | (0.013) | (0.012) | (0.018) | (0.022) | (0.013) | (0.025) | |
| District expenditures: Salary | 0.356** | −0.195 | 0.879** | 0.256 | 0.736** | 0.429* | 1.001* |
| (0.161) | (0.206) | (0.439) | (0.348) | (0.342) | (0.237) | (0.551) | |
| District expenditures: Supplies | −0.655 | −1.403 | −1.868** | −1.251 | −1.079** | −0.747 | −0.740 |
| (0.586) | (0.987) | (0.920) | (1.031) | (0.463) | (0.588) | (0.631) | |
| District expenditures: Property | −0.228 | −0.245 | −0.415 | −0.079 | −0.040 | −0.407** | 0.179 |
| (0.195) | (0.396) | (0.353) | (0.419) | (0.121) | (0.184) | (0.177) | |
| School fixed effects | Yes | Yes | Yes | Yes | Yes | Yes | Yes |
| Year fixed effects | Yes | Yes | Yes | Yes | Yes | Yes | Yes |
| Constant | Yes | Yes | Yes | Yes | Yes | Yes | Yes |
| N | 15,303 | 2,703 | 2,706 | 2,703 | 9,413 | 9,413 | 8,859 |
| R2 | 0.290 | 0.083 | 0.066 | 0.099 | 0.274 | 0.062 | 0.190 |
Note. Standard errors are clustered by schools.
***p < 0.01; **p < 0.05; *p < 0.1.
At the middle and elementary school levels, one funded project leads to a 0.2- (0.5-) pp increase in the percentage of students scoring basic and above in ELA (science). We do not observe a significant impact on the percentages of students scoring proficient and above on PSSA tests except for a small increase in the ELA scores. Neither do we observe a significant impact on the PSSA math scores, which may be because of its difficulty relative to other tests and/or students’ lack of proficiency in this subject—on average, 43.5% of students scored proficient and above and 70.8% of students scored basic and above, which are significantly lower than the ELA exam (60.8% and 90.2%), the science exam (69.0% and 86.3%), and the Keystone algebra exam (62.6% and 90.1%), respectively, as shown in Table 1. Overall, we do not observe a significant impact on the percentages of students scoring advanced and above levels in any subject, which is expected because only a small fraction of students are able to score advanced on these tests. In sum, our results strongly suggest that DonorsChoose-funded projects predominantly impact students performing at the bottom.
The coefficient estimates for the rest of the control variables are consistent with other studies of school performance outcomes. First, large schools and schools with more Black or Hispanic students are generally associated with lower performance outcomes, and this effect is particularly strong at the middle and elementary school levels as shown in the PSSA exam scores. We also observe that district salary expenditures (normalized to the per-student level) are positively associated with school performance but not expenditures on supplies or property. As we previously discussed, controlling for the number of posted projects results in collinearity issues because of its high correlation with the number of funded projects, as presented in Table A4 in the online appendix. However, the point estimates of the coefficients are consistent in scale, and in most cases larger in magnitude.
Finally, in addition to the number of projects funded, we obtain consistent results with alternative explanatory variables including (1) a binary indicator of having a funded project or not, (2) the total dollar amount of funded projects, and (3) the total number of students reached by the projects as reported by teachers. We obtain consistent results in all settings. In addition, our results are stronger if the dollar amount of funding is controlled for in the regressions. We report these robustness results for interested readers in Table A6 of the online appendix.
4.2. Results with the Instrument
To mitigate the aforementioned selection bias at the funding stage, we use the unanticipated flash funding and donation matching events as the instrument and report the results of the IV regressions in Table 3. The results are directionally consistent with the results from fixed-effects models without instruments. However, as the IV further adjusts for the downward bias because of selection, we observe a significantly larger magnitude of the impact of DonorsChoose-funded projects, often doubling those from the FE regressions. Specifically, at the high school level changing from zero to one funded project leads to a 0.68 increase in the SPP score, and a 0.7- to 1.3-pp (1- to 1.6-pp) increase in the percentages of students scoring basic (proficient; Table A5 of the online appendix) and above in all tested subjects. At the middle and elementary school levels, one funded project leads to a 0.4- (1.0-) pp increase in the percentage of students scoring basic and above in the ELA (science) exams. As before, we do not observe significant impacts on the percentages of students scoring proficient and above on the PSSA exam, nor do we observe a significant impact on the PSSA math scores.
|
Table 3. Impact of Funded Projects on School Performance (with Instruments)
| SPP | Keystone basic and above | PSSA basic and above | |||||
|---|---|---|---|---|---|---|---|
| Lit | Algebra | Biology | ELA | Math | Science | ||
| No. of projects funded (log-scaled) | 0.977*** | 1.071** | 1.123** | 1.915*** | 0.608*** | 0.110 | 1.464*** |
| (0.252) | (0.496) | (0.495) | (0.739) | (0.188) | (0.228) | (0.322) | |
| School FEs, year FEs, controls | Yes | Yes | Yes | Yes | Yes | Yes | Yes |
| Year fixed effects | Yes | Yes | Yes | Yes | Yes | Yes | Yes |
| Constant | Yes | Yes | Yes | Yes | Yes | Yes | Yes |
| N | 15,303 | 2,703 | 2,706 | 2,703 | 9,413 | 9,413 | 8,859 |
| R2 | 0.289 | 0.080 | 0.062 | 0.095 | 0.273 | 0.062 | 0.186 |
Notes. The instrument variable is the number of projects posted eligible for unanticipated funding events. The instrumented variable is the number of projects funded. Both measures are log scaled. Implemented using Stata’s XTIVREG package. Standard errors are clustered by schools.
***p < 0.01; **p < 0.05; *p < 0.1.
Overall, our findings suggest that for a school without funded projects, a single funded project achieves, on average, a 0.4- to 1.6-pp increase in the number of students—or between two and nine additional students—scoring basic and above on all tested subjects in high school and on science and ELA in primary and middle schools. The improvement is sizable given that a single project only provides about $400 worth of resources in total. The results are consistent (1) when we define separate instruments each measuring the number of projects eligible for each funding event or (2) when we exclude funding events that involve celebrity participation to exclude potential emotional effects of being funded by celebrities. In addition, our instruments are strong as evidenced by the Cragg-Donald Wald F statistics being substantially larger than the weak-IV critical values. These additional results are reported in Tables A6 and A7 of the online appendix.
As previously discussed, the instrument addresses selection at the funding stage but not at the posting stage. We therefore conduct additional analysis on subsamples of schools that have posted projects. We specifically define two subsamples: The first subsample excludes all schools that have never posted any project during our sample period, which constitute about 30% of the full sample. The other subsample builds on the first and excludes additionally all school-years with zero posted projects, which is about 70% of the full sample. We apply the same fixed effects model with instrument and report the results in Table A8 of the online appendix. We find very similar estimates to the main samples, both in terms of magnitude and statistical significance. These results suggest that selection at the posting stage could have largely been addressed by the inclusion of time-variant controls and fixed effects. Nevertheless, when interpreting the results, one should still be mindful of the selection issue at the posting stage and note the possibility that the impact of project funding might be larger in magnitude than we document in our main analysis.
4.3. Heterogeneous Effects: Schools with High/Medium/Low Proportions of Students Eligible for FRPL
Our results thus far indicate projects funded through DonorsChoose have an overall positive impact on school performance as measured by the school SPP score and the subject test scores. In this section, we examine the potential heterogeneity in the impact across schools with different proportion of students eligible for FRPL.
We hypothesize that the impact of project funding is larger in low-income schools such as those with a greater proportion of students eligible for FRPL, which lack educational resources compared with their wealthier peers and tend to perform worse on standardized exams. Because these schools offer more room for improvement, funding for resources in these schools—even small ones—could have a bigger “bang for the buck” at the margin. We therefore compare the impact of DonorsChoose-funded projects on (1) schools with high proportions of students eligible for FRPL (defined as in the top tercile of the yearly distribution), (2) schools with medium proportions of students eligible for FRPL (middle tercile of the yearly distribution), and (3) schools with low average FRPL proportion (bottom tercile). The high, medium, and low proportions are defined based on within-year distribution as the percentages of students eligible for FRPL have been rising during the study window in the state of Pennsylvania.10
We repeat our IV analysis separately on the three school subsamples and illustrate the results in Table 4. From these subsample analyses, we find evidence supporting that the impact of DonorsChoose-funded projects is particularly significant for those schools with higher percentages of FRPL eligible students (low- and middle-income schools) but do not find such evidence for schools with low percentages of FRPL eligible students (high-income schools). In terms of effect size, for low-income high schools with no funded projects, one funded project increases the percentage of student scoring basic and above by 1.2/1.4/1.9 pp in Literature/Algebra/Biology or between 6 and 10 more students per school elevated to basic and above in these subjects after one project funded on the DonorsChoose platform. Similarly at the elementary and middle school level, this leads to a 0.7-pp increase or four additional students scoring basic and above in science proficiency.
|
Table 4. Heterogeneous Impact of Funded Projects on School Performance (with Instruments)
| SPP | Keystone basic and above | PSSA basic and above | |||||
|---|---|---|---|---|---|---|---|
| Literature | Algebra | Biology | ELA | Math | Science | ||
| Panel A: Schools with high percentages of FRPL students (top tertile) | |||||||
| No. of projects funded (log-scaled) | 0.858** | 1.733* | 2.084** | 2.735** | 0.282 | 0.070 | 1.031** |
| (0.333) | (0.916) | (0.907) | (1.370) | (0.256) | (0.307) | (0.442) | |
| School FEs, year FEs, controls | Yes | Yes | Yes | Yes | Yes | Yes | Yes |
| N | 5,249 | 848 | 852 | 848 | 3,428 | 3,428 | 3,279 |
| R2 | 0.233 | 0.170 | 0.166 | 0.120 | 0.401 | 0.107 | 0.332 |
| Panel B: Schools with medium percentages of FRPL students (middle tertile) | |||||||
| No. of projects funded (log-scaled) | −0.080 | 0.423 | 0.158 | 1.527* | −0.083 | 0.127 | −0.203 |
| (0.623) | (0.486) | (0.627) | (0.838) | (0.265) | (0.460) | (0.437) | |
| School FEs, year FEs, controls | Yes | Yes | Yes | Yes | Yes | Yes | Yes |
| N | 5,114 | 932 | 931 | 932 | 3,168 | 3,168 | 2,957 |
| R2 | 0.269 | 0.073 | 0.036 | 0.129 | 0.269 | 0.061 | 0.134 |
| Panel C: Schools with low percentages of FRPL students (bottom tertile) | |||||||
| No. of projects funded (log-scaled) | 0.181 | 0.102 | 0.815* | −0.353 | 0.149 | −0.143 | 0.201 |
| (0.727) | (0.692) | (0.473) | (0.750) | (0.188) | (0.364) | (0.438) | |
| School FEs, year FEs, controls | Yes | Yes | Yes | Yes | Yes | Yes | Yes |
| N | 4,929 | 917 | 917 | 917 | 2,810 | 2,810 | 2,617 |
| R2 | 0.386 | 0.096 | 0.061 | 0.120 | 0.173 | 0.061 | 0.091 |
Notes. The instrument variable is the number of projects posted eligible for unanticipated funding events. The instrumented variable is the number of projects funded. Both measures are log scaled. Same set of control variables is included as in the main paper. Standard errors are clustered by schools.
***p < 0.01; **p < 0.05; *p < 0.1.
For high-income schools, the point estimates of the potential impacts are close to zero but with large standard errors. We do not find the differences between high- and low-income schools to be statistically significant (at p ) because of these large standard errors.11 We obtain similar results using other metrics to segment schools (e.g., the percentage of historically underperforming students, a metric reported by Pennsylvania).
Just as the DonorsChoose-funded projects having the highest impact on students performing at the bottom, these results together with the visualization in Figure A2 in the online appendix show that these projects have the highest impact on schools at the bottom of the income distribution, as determined by the proportion of student eligible for FRPL. Intuitively, students at low-income schools have greater and more acute resource needs, which give teachers more opportunities for a higher improvement at the margin. We also observe a larger effect at the high school level (Keystone) than at the elementary/middle school levels (PSSA). This is likely because the PSSA exams are more rigorous than the Keystone exams, which makes it harder for teachers to move students to higher performance tiers. Overall, the results indicate that EdTech crowdfunding platforms that empower teachers have the potential to be an equalizing tool.
5. Mechanism Testing
At first glance, small material investments such as projects funded on DonorsChoose, which average around $400, might not have a measurable impact on student performance. However, the operations management literature has theorized that such small improvements can potentially translate into larger improvements in system performance, if they are implemented at the level of frontline workers who are closest to the production or service process, and thus are most familiar with work obstacles, failures, or other inefficiencies.
Teachers are the frontline workers in education, and the DonorsChoose projects directly originate from them. Therefore, consistent with other production and service settings (Tucker 2007, 2016; Tucker et al. 2008; Robinson and Schroeder 2009), teachers, who interact with students daily and have an intimate understanding of classroom operations, are well positioned to develop strategies that use even small material and resource investments effectively and efficiently.
In the data, we observe how teachers use resources to achieve improvements through the projects’ impact statements, in which teachers usually provide a firsthand account of how the resources are used. These statements are required by DonorsChoose for every funded project. In our data, 93% of funded projects have a completed impact statement. The statements describe how the resources impacted (1) the teacher, (2) the classroom, (3) particular students, and sometimes (4) other stakeholders at their school. For our Pennsylvania sample, we collect a total of 20,592 impact statements, which have an average length of 186 words (standard deviation (SD) = 91). We then use a textual analysis procedure based on the bag-of-words approach to systematically extract and analyze the channels of improvement identified by teachers in these impact statements.
As several channels of improvement, such as the repeated or shared use of resources, are widely discussed by many teachers in a significant number of the impact statements, we first develop a series of keywords that are most closely related to each of the channels. This allows us to compute for each document the fraction of words describing each channel. We then aggregate the document–channel mixture into the school–year level and relate these channels to postfunding school performance. In the lowest income schools, we observe that teachers achieve their large performance impact by using new resources to improve students’ knowledge retention through better focus and fewer distractions, and ensuring the new resources they secure are used repeatedly over time, sometimes also sharing the resources widely with other teachers. When improvement projects at higher-income schools have an impact, it is with projects that focus on differentiating lessons across subgroups of students.
5.1. Categorization of Project Impact Statements
We develop our categorization of main improvement channels with an inductive approach, based on the actual content of the impact statements, rather than by hypothesizing about categorizations at the outset. Specifically, we read a randomly selected impact statement and note key words or phrases (bigrams or two-word strings) in that statement that defined how the resources are used. Then, we read another randomly selected impact statement and do the same. During this process, we organize these key words into different themes (”word bags”) and identify themes that consistently appear in a large number of statements. For example, when teachers mention how the resources help them save time, they tend to consistently use words such as simpler, manually, quicker, or efficient, which can be grouped into one list because of their similar connotations. We continue this process until each additional impact statement we read fails to yield any new words or phrases to our lists, which happened at around 100 impact statements. This process resulted in four lists corresponding to four channels of improvement:
Knowledge Retention: Resources are used in a way that improves student retention of knowledge, either by improving the efficiency of a single learning opportunity or making it more efficient for students to have multiple, repeated opportunities to learn the same knowledge.
Repeated or Shared Use of Resources: Resources are used repeatedly or shared across classes to increase the intensity of impact.
Differentiated Learning: Resources are used in a way that enables the teacher to customize students’ learning experiences, that is, providing a learning experience that matches the student’s level in a particular topic.
Streamline Work Processes: Resources are used in a way that enables the teacher to reduce nonlearning time, off-task time, or downtime in classes.
We report all identified keywords for these channels and include excerpts of statements describing each channel in Online Appendix F.
5.2. Textual Analysis of Project Impact Statements
After we identify the main channels of improvement conveyed in the impact statements, we quantitatively assess whether a given statement discusses each of the channels and how much discussion is devoted to each channel. To do so, we first convert all impact statements to a machine-readable format. This requires six steps: (1) strip all HTML tags and markups, (2) remove punctuation items such as commas and periods, (3) remove numbers and other alphanumeric characters, (4) tokenize the remaining text strings into sequences of words and bigrams, (5) remove “stop words,” or words that appear frequently in the statements but do not confer substantive meaning, such as the, to, and so on (at this step we also removed words related to gratitude and appreciation such as thank, grateful, etc.), and (6) assign a parts-of-speech tag to each remaining word and lemmatize all verbs back to their roots.
Next, for each processed document, we tabulate the fraction of its words falling into each of the four aforementioned themes. To avoid over-capturing the effect of more common and thus less specific words in the lists in the tabulation process, we weigh the theme words using the tf.idf following standard practice in statistical natural language processing (Manning et al. 1999).12 Specifically, each word m in channel k is first assigned a weight , where n = 20,592 is the total number of impact statements in our sample, and dfm is the number of impact statements in which that channel keyword (m, k) appears.13 Then, given document j, the tf.idf count for the keyword (m,k) is therefore , where is the number of times that keyword (m, k) appears in document j, and aj is the total length of document j. The total tf.idf word count for channel k in document j would therefore be . For our sample of 20,952 nonempty impact statements, 37%, 70%, 27%, and 8% contain at least some discussion of the Knowledge Retention, Repeated or Shared Resource Use, Differentiated Learning, and Streamline Process channels, respectively. Among them, 17% of the statements mention two channels and 0.5% mention all four channels.
Finally, because our outcome and control variables are measured at the school–year level, we aggregate the channel-k keyword counts for each school i and year t by taking the sum of for all statements, denoted by Jit, filed by teachers in the school–year combination. We denote these sums as . Therefore, measures the intensity of discussion about the channel k in school i’s impact statements in year t, and a higher level thus indicates a higher likelihood of the channel being used in the school after the project is funded.
5.3. Relating Extracted Channels to School Performance
To examine whether the channels we extract from the impact statements are indeed conducive to improvements postfunding, we extend the FE discussed in Section 3.4 to incorporate the channel word counts and relate them to the same performance metrics used in our main analysis. Specifically, we fit the following regression:
where Xit, ηt, and ξi are the same set of controls and fixed effects. To facilitate interpretability, we standardize each by subtracting its overall sample mean and dividing by its sample SD. As such, the coefficient estimates βk measure the incremental amount of test performance improvement per one-SD increase in the school’s use of channel k, as discussed in its impact statements.
Table 5 shows the results of the analysis. None of the channels is significantly related to the SPP score, but several channels are consistently related to improved school performance on Keystone and PSSA exams across multiple subjects. For the high school Keystone exams, more discussions of the Knowledge Retention channel—a one-SD increase in the related word count—is associated with a 0.4- to 0.7-pp increase in the percentages of students scoring basic and above in all subjects. At the elementary and middle school levels, we do not observe a significant effect of this channel on the fractions of students scoring basic and above; however, we observe a significant increase (0.2 pp) in students scoring proficient and above in ELA (see Table A10 in the online appendix).
|
Table 5. Impact of Project Themes on School Performance
| SPP | Keystone basic and above | PSSA basic and above | |||||
|---|---|---|---|---|---|---|---|
| Literature | Algebra | Biology | ELA | Math | Science | ||
| Knowledge Retention | 0.086 | 0.384** | 0.358 | 0.718** | 0.129 | 0.034 | 0.124 |
| (0.109) | (0.192) | (0.242) | (0.361) | (0.092) | (0.085) | (0.150) | |
| Repeated and Shared Use of Resources | 0.045 | −0.144 | −0.084 | 0.170 | 0.198** | 0.044 | 0.514*** |
| (0.117) | (0.260) | (0.251) | (0.416) | (0.081) | (0.097) | (0.148) | |
| Differentiated Learning | 0.049 | 0.385* | 0.450** | −0.123 | −0.108* | −0.024 | −0.114 |
| (0.092) | (0.216) | (0.190) | (0.287) | (0.065) | (0.080) | (0.109) | |
| Streamline Work Process | 0.102* | −0.126 | −0.097 | −0.124 | 0.015 | −0.013 | 0.026 |
| (0.061) | (0.113) | (0.145) | (0.199) | (0.039) | (0.053) | (0.077) | |
| School FEs, year FEs, controls | Yes | Yes | Yes | Yes | Yes | Yes | Yes |
| N | 15,303 | 2,703 | 2,706 | 2,703 | 9,413 | 9,413 | 8,859 |
| R2 | 0.291 | 0.085 | 0.070 | 0.101 | 0.277 | 0.061 | 0.193 |
Notes. The instrument variable is the number of projects posted eligible for unanticipated funding events. The instrumented variable is the number of projects funded. Both measures are log scaled. Same set of control variables is included as in previous tables. Standard errors are clustered by schools.
***p < 0.01; **p < 0.05; *p < 0.1.
These results suggest that project resources used by teachers to improve students’ retention of knowledge—for example, by improving the efficiency of a single learning opportunity or by providing students with multiple opportunities to learn the same knowledge—are consistently associated with improved test performance across the different grade levels for literacy-related subjects at all school levels and STEM-related subjects at the high school level. The evidence for the other channels is mixed. A one-SD increase in Repeated or Shared Use of Resources–related word count is associated with a 0.2-pp increase in the percentage of students scoring basic and above on the PSSA ELA exam and a 0.5-pp increase in the percentage of students scoring basic and above in the PSSA science exam, suggesting that project resources that are either used repeatedly within the teacher’s own classes to increase the intensity of teaching impact or shared widely across the teacher’s school to increase the breadth of the impact have a positive effect on student performance, but primarily at the lower levels in elementary and middle schools.
By contrast, the Differentiated Learning channel seems to primarily affect performance at the high school level: a one-SD increase in its discussion is associated with a 0.03-pp increase in the percentage of students scoring basic and above on the Keystone literature exam and a 0.04-pp increase in the percentage of students scoring basic and above on the Keystone algebra exam. This suggests that project resources which customize learning experiences to each student’s level and needs have a larger effect at the high school level; in fact, using resources in this way may even have a negative effect at the elementary and middle school level given the negative and significant effect found for the PSSA ELA exam. For the final channel, Streamline Work Process, we find no significant effects. Taken together, the results of the textual analysis suggest teachers transform small material investments into measurable improvements in student learning by removing obstacles to student learning. Specifically, they remove obstacles to knowledge retention, resource access across the school, and customizing learning experiences to student needs. This appears to be part of the reason why funded projects lead to higher student performance on state exams.
Next, we examine the heterogeneity in the relation between the channels and performance across schools with varying proportions of students eligible for FRPL. Specifically, we refit Equation (2) on the three subsamples of schools with high, medium, and low percentages of students eligible for FRPL, using the same tercile threshold values defined in Section 4.3. Table 6 reports the results, which shows heterogeneity in the correlation between the impact statement-identified channels and student performance across schools. First, at both the elementary/middle and high school levels, the knowledge retention channel is most significantly related to performance in schools with the highest proportions of students eligible for FRPL, with both higher magnitudes and higher statistical significance than in schools with lower proportions of students eligible for FRPL. Second, there is some evidence that repeated or shared use of resources is another channel for student success in low-income schools, particularly for science, albeit with lower levels of statistical significance. In contrast, the differentiated learning channel is most manifest in schools with the lowest proportion of students eligible for FRPL.
|
Table 6. Heterogeneous Impact of Project Themes on School Performance
| SPP | Keystone basic and above | PSSA basic and above | |||||
|---|---|---|---|---|---|---|---|
| Literature | Algebra | Biology | ELA | Math | Science | ||
| Panel A: Schools with high percentages of FRPL students (top tertile) | |||||||
| Knowledge Retention | 0.001 | 0.809** | 0.735* | 1.026* | 0.164 | 0.014 | 0.221 |
| (0.132) | (0.336) | (0.405) | (0.597) | (0.116) | (0.106) | (0.182) | |
| Repeated or Shared Use of Resources | 0.071 | −0.377 | −0.253 | 0.464 | 0.047 | 0.076 | 0.371** |
| (0.137) | (0.403) | (0.349) | (0.657) | (0.104) | (0.122) | (0.179) | |
| Differentiated Learning | 0.066 | 0.399 | 0.517** | −0.380 | −0.098 | −0.010 | −0.165 |
| (0.103) | (0.294) | (0.217) | (0.394) | (0.076) | (0.096) | (0.126) | |
| Streamline Work Process | 0.086 | −0.118 | −0.105 | −0.286 | −0.011 | −0.023 | −0.049 |
| (0.069) | (0.167) | (0.204) | (0.257) | (0.048) | (0.062) | (0.092) | |
| N | 5,260 | 854 | 858 | 854 | 3,433 | 3,433 | 3,284 |
| R2 | 0.234 | 0.178 | 0.177 | 0.130 | 0.404 | 0.106 | 0.335 |
| Panel B: Schools with medium percentages of FRPL students (middle tertile) | |||||||
| Knowledge Retention | 0.327 | −0.152 | 0.146 | 0.388 | 0.028 | 0.281* | −0.260* |
| (0.233) | (0.223) | (0.284) | (0.504) | (0.094) | (0.168) | (0.156) | |
| Repeated or Shared Use of Resources | −0.064 | 0.103 | −0.066 | −0.188 | 0.221* | 0.179 | 0.221 |
| (0.293) | (0.373) | (0.343) | (0.517) | (0.125) | (0.210) | (0.182) | |
| Differentiated Learning | −0.307 | −0.169 | 0.235 | 0.949 | −0.195* | −0.286* | 0.083 |
| (0.273) | (0.497) | (0.530) | (0.903) | (0.105) | (0.159) | (0.172) | |
| Streamline Work Process | −0.186 | 0.073 | 0.149 | 0.380 | −0.035 | −0.030 | 0.035 |
| (0.177) | (0.190) | (0.241) | (0.267) | (0.060) | (0.130) | (0.116) | |
| N | 5,114 | 932 | 931 | 932 | 3,170 | 3,170 | 2,959 |
| R2 | 0.269 | 0.074 | 0.038 | 0.136 | 0.271 | 0.062 | 0.135 |
| Panel C: Schools with low percentages of FRPL students (bottom tertile) | |||||||
| Knowledge Retention | 0.089 | −0.010 | −0.334 | −0.163 | 0.027 | 0.007 | 0.089 |
| (0.335) | (0.301) | (0.234) | (0.467) | (0.103) | (0.196) | (0.165) | |
| Repeated or Shared Use of Resources | −0.265 | −0.169 | 0.312 | −0.375 | 0.126 | −0.015 | 0.095 |
| (0.370) | (0.316) | (0.363) | (0.328) | (0.097) | (0.169) | (0.209) | |
| Differentiated Learning | 0.238 | 0.515* | 0.451** | 0.167 | −0.006 | 0.149 | −0.034 |
| (0.309) | (0.269) | (0.208) | (0.296) | (0.086) | (0.162) | (0.148) | |
| Streamline Work Process | 0.058 | −0.205 | −0.320 | 0.019 | 0.002 | 0.040 | −0.171 |
| (0.263) | (0.273) | (0.282) | (0.509) | (0.045) | (0.102) | (0.127) | |
| N | 4,929 | 917 | 917 | 917 | 2,810 | 2,810 | 2,616 |
| R2 | 0.387 | 0.101 | 0.076 | 0.122 | 0.174 | 0.062 | 0.095 |
Notes. All regressions use school and year fixed effects and all controls. Standard errors are clustered by schools.
***p < 0.01; **p < 0.05; *p < 0.1.
These results suggest how teachers use resources to improve student learning varies with the magnitude of the resource deficiency schools face. In schools serving the highest proportion of students eligible for FRPL, the focus is on the basics of the service environment. Students in these schools work in a learning environment with fundamental obstacles such as a lack of supplies, technologies, snacks or a quiet place to learn, and so projects that make the environment more conducive to learning— namely those that focus on knowledge retention and sharing or using resources repeatedly over time—are most effective. Meanwhile, in schools with a lower proportion of students eligible for FRPL, the environment has fewer foundational obstacles. Still, however, certain students may be struggling because they learn best in small groups, at a different pace, or need different tools. For this reason, projects that enable differentiation in modes of service delivery are effective.
6. Discussion
In this paper, we empirically investigate the following. (1) Do small, teacher-led improvement projects improve student learning outcomes at the school? (2) If so, does the effect of teacher-led improvement projects differ between low- and high- income schools? (3) What are the potential channels—particularly operations-related channels—that could explain the findings? We find that teacher-led projects improve student learning as measured by standardized test scores and that the effect is driven almost entirely by teachers at the lowest income schools. The DonorsChoose platform enables teachers to communicate and implement their ideas, and generates the large-scale data needed to test the effect of teacher improvement projects on student learning. Using textual analysis on impact statements written by DonorsChoose-funded teachers about their projects, we identify three channels for how resources are used to improve performance: (1) knowledge retention, (2) repeated/shared resource use, and (3) differentiated/personalized learning. We also find heterogeneity in the channels of improvement across schools: teachers in the lowest-income schools achieve their large performance impact through the repeated/shared resource use and knowledge retention channels, whereas improvements at higher-income schools are realized more through the differentiated/personalized learning channel. These results support the idea that investing in small projects proposed by teachers at low-income schools could help reduce inequalities in student outcomes between low- and high-income schools. Our finding have implications for theory and practice.
6.1. Implications for Theory
Among operations management researchers, it is widely accepted that small changes made on the front lines can generate improvements in system performance (Deming 1982, Anderson et al. 1994, Naylor et al. 1999, Brunet and New 2003, Shah and Ward 2003). Our findings contribute to our understanding of the frontline worker effect in two ways. First, we provide empirical evidence of the frontline worker effect in a novel context that offers a large database of diverse ideas proposed by frontline workers, which are selectively implemented across different organizational contexts. Such evidence has been understandably hard to find, as it is uncommon for a central repository of ideas to exist that represents thousands of frontline workers across hundreds of organizations. Although for these reasons our theory of frontline workers has evolved largely by focusing on a smaller number of organizations at a time (Tucker 2004, 2007; Tucker et al. 2008; Robinson and Schroeder 2009), the evidence we find is wholly consistent with the theory developed thus far: we observe that teachers funded through DonorsChoose use their resources to improve the service process, by removing obstacles to student learning and employing resources efficiently, and this leads to system improvement. In this way, our findings lend additional power to the frontline worker theory of process improvement.
Second, our study contributes a novel perspective to frontline worker theory: that improvements on the front lines can help reduce inequality. In the manufacturing sector, the origin of frontline worker theory, efficiency and effectiveness are most important. Yet, equality becomes increasingly important as we apply theories to contexts such as healthcare and education (Johnson and Smilowitz 2007, Balcik et al. 2010). Our findings, taken together with prior work (Tucker 2004, 2016), support the idea that organizations are unequal in that some face more fundamental and basic obstacles to effective service than others, and those obstacles can lead to failures and poor outcomes for certain groups of customers. It is unfortunately often the customers most in need (such as students eligible for FRPL) who are disproportionately impacted. Our study shows that because frontline workers know most intimately the obstacles and failures that are most problematic, they are able to make outcomes more equitable. In the low-income schools we study, this means removing obstacles that make it hard for students to focus and making sure students have the resources they need to learn each and every day.
6.2. Implications for Practice
Our findings also have implications for practice. To education leaders and policy makers, our findings suggest it may be beneficial to complement top-down reforms with bottom-up, teacher-led interventions. Most of the reforms to date, such as school finance reforms (Jackson et al. 2016, Lafortune et al. 2018) and class size reforms (Hanushek 1999), are implemented at the district or state levels. This leaves little to no room for customization to heterogeneous student needs within districts, across schools. Teacher-led initiatives that enable customization, like improvement projects posted on DonorsChoose, could be used to complement systemic reforms.
To EdTech companies, our findings indicate that innovations to support the traditional brick-and-mortar school system have the ability to make a difference even with small interventions if those interventions occur close to students and are adaptable by teachers to meet students’ needs. The rhetoric and research on educational outcomes might lead companies to believe that the current system is beyond improvement; it needs to be reimagined entirely. Our study shows, however, there is promise to working within the system to support districts and schools. Moreover, the findings of our textual analysis suggest pathways for achieving improvement, specifically by reducing obstacles to knowledge retention, securing resources that can be used repeatedly and widely across the school, and differentiating learning experience based on students’ needs. Small changes in these areas can lead to better and more equal outcomes, as they are made on the front lines and initiated by teachers with well-tailored ideas for how to help the types of students at their school. EdTech platforms would therefore benefit from further investments in algorithms that extract, aggregate, and analyze these insights from frontline workers.
6.3. Limitations and Future Research
Our study is not without limitations. First, we use data from one state, Pennsylvania, which has one of the most unequal funding among districts in the country. The effects we observe should be interpreted within that context. Yet, our findings from Pennsylvania, taken together with the two studies from California (Gao et al. 2020, Zhou et al. 2022), suggest the effects we observe could be evident across other states as well. Second, our study does not directly test whether a teacher crowdfunding approach is more or less effective than increasing top-down government funding to schools. We suspect that the impact of additional resources to teachers—even to teachers who are most committed and who use resources most effectively—diminish at some point. Third, our study does not uncover differences between teachers who post and teachers who do not. We presume that teachers who post are ones willing to go above and beyond for their students, and we know at least that teachers who post have an idea of how to improve student learning tailored to their school’s needs. Understanding more about which teachers post, which teachers use resources more or less effectively, and whether teachers who get funded stay longer at their schools are examples of important directions for future research to complement our findings.
In conclusion, our study finds that many teachers, particularly those in schools serving a high proportion of students from low-income households, have small but effective ideas for how to overcome obstacles to student learning. Supporting teachers with a few hundred dollars so they can implement their ideas leads to measurable improvement and reduced inequality in outcomes. This study can motivate those in the public and private sectors to better harness the wisdom of the frontline worker to improve effectiveness and equality.
The authors thank Charles Corbett (department editor), the associate editor, and two reviewers for instrumental comments and feedback; our research partner DonorsChoose, specifically Charles Best, Ali Rosen, Rebecca Widom, Andi Muskaj, and Barbara Cvenic; and the attendees of the 2020 Empirical Operations Workshop and INFORMS Annual Conference and seminar attendees at Carlson School of Management-University of Minnesota, Stanford Business School, and The Wharton School at the University of Pennsylvania for helpful feedback. All errors are our own.
1 We also maintained a contact at the Pennsylvania Department of Education in the Division of Assessment and Accountability on whom we relied for clarification of policies, practices, and data availability.
2 In 2014–2015, the Keystone exams replaced a high school level of the PSSA. The overall objective of the testing change was to increase rigor and align tests with updated statewide learning standards.
3 During the first year of the PSSA exams, 2014–2015, the state did not score elementary schools on the SPP because they anticipated a dramatic downward shift. SPP indeed scores shifted downward after testing reforms. In 2013–2014 (before test reforms), the average school SPP score was 76, and in 2015–2016 (after test reforms), the average school SPP score was 69.5.
4 We considered using only educational expenses (designated in the data as Actual Instructional Expenditures or AIE), but these amounts were not correlated with school performance outcomes.
5 Because the number of funded projects can take zero values, we add one to the original number when taking the logarithmic transformation. The results without taking the logarithmic transformation are consistent and even more significant and greater in scale.
6 Moreover, when not controlling for posted projects we may underestimate the effect because of negative selection at the posting stage.
7 A project’s eligibility for a funding event is not dependent on its actual funding status on the day of the event. In other words, an eligible project can be funded or not funded before the event takes place. Defining eligibility based on actual funding status will likely introduce other sources of selection bias where open projects may be different from those already funded.
8 The results are consistent when we define separate instruments for the events, each measuring the number of projects eligible for each funding event.
9 We report all estimation results on students scoring proficient and above in Online Appendix E.
10 For example, the top tercile has increased from 48% of students in 2010 to 58% in 2017.
11 This can be seen visually in Figure A2 in the online appendix, which illustrates the estimated effects and confidence intervals under each outcome measure.
12 For instance, in the repeated or shared resource use theme, the word “daily” appears in 2,707 statements, whereas “repeatedly” appears in 32 statements. Clearly, the collective impact of “daily” is unlikely to be 85 times larger than that of “repeatedly” and “daily” is more likely to be used in other contexts (e.g., “daily activities”) than specifically about the repeated use channel (e.g., “use daily”).
13 In the previous example, the more specific word “repeatedly” would receive a weight (2.80) that is roughly three times the weight of more common word “daily” (0.95) in the tabulation process.
References
- (2015) Donor retention in online crowdfunding communities: A case study of donorschoose.org. Proc. 24th Internat. Conf. on World Wide Web, 34–44.Google Scholar
- (1994) A theory of quality management underlying the deming management method. Acad. Management Rev. 19(3):472–509.Crossref, Google Scholar
- (2010)
A review of equity in nonprofit and public sector: A vehicle routing perspective . Cochran J, ed. Wiley Encyclopedia of Operations Research and Management Science (Wiley, New York), 1–12.Google Scholar - (2003) Kaizen in Japan: An empirical study. Internat. J. Oper. Production Management 23(12):1426–1446.Crossref, Google Scholar
- (1982) Quality, Productivity, and Competitive Position, vol. 183 (Massachusetts Institute of Technology, Cambridge, MA).Google Scholar
- (2005) Applying process knowledge for yield variation reduction: A longitudinal field study. Decision Sci. 36(1):159–186.Crossref, Google Scholar
- (2020) Educational crowdfunding and student performance: An empirical study. Inform. Systems Res. 32(1):53–71.Google Scholar
- (1999) Some findings from an independent investigation of the Tennessee star experiment and from other investigations of class size effects. Edu. Evaluation Policy Anal. 21(2):143–163.Crossref, Google Scholar
- (2019) The unwavering SES achievement gap: Trends in us student performance. Technical report, National Bureau of Economic Research, Cambridge, MA.Google Scholar
- (2016) The effects of school spending on educational and economic outcomes: Evidence from school finance reforms. Quart. J. Econom. 131(1):157–218.Crossref, Google Scholar
- (2007)
Community-based operations research . OR Tools and Applications: Glimpses of Future Technologies (INFORMS, Columbia, MD), 102–123.Link, Google Scholar - (2019) Opinion: PA’s budget must address glaring inequities in school funding. The Philadelphia Inquirer. https://www.inquirer.com/opinion/commentary/tom-wolf-pennsylvania-budget-education-funding-20190222.html.Google Scholar
- (2019) Crowdfunding education with donorschoose.org: All things equal? Proc. Society for Inform. Tech. & Teacher Edu. Internat. Conf. (Association for the Advancement of Computing in Education), 680–687.Google Scholar
- (2013) Experimental study of crowdfunding cascades: When nothing is better than something. Preprint, submitted August 11, 2013; last revised August 12, 2017, https://dx.doi.org/10.2139/ssrn.2308161.Google Scholar
- (2018) School finance reform and the distribution of student achievement. Amer. Econom. J. Appl. Econom. 10(2):1–26.Crossref, Google Scholar
- (1999) Foundations of Statistical Natural Language Processing (MIT Press, Cambridge, MA).Google Scholar
- (2019) The datafication of discipline: Classdojo, surveillance and a performative classroom culture. Learn. Media Tech. 44(1):36–51.Crossref, Google Scholar
- (2014) Effects of the price of charitable giving: Evidence from an online crowdfunding platform. J. Econom. Behav. Organ. 103:113–124.Crossref, Google Scholar
- (1999) Leagility: Integrating the lean and agile manufacturing paradigms in the total supply chain. Internat. J. Production Econom. 62(1–2):107–118.Crossref, Google Scholar
- (2010) Literacy and science: Each in the service of the other. Science 328(5977):459–463.Crossref, Google Scholar
- (2011) Steam: Experts make case for adding arts to stem. Edu. Weekly 31(13):8.Google Scholar
- (2009) The role of front-line ideas in lean performance improvement. Qualitative Management J. 16(4):27–40.Crossref, Google Scholar
- (2003) Lean manufacturing: Context, practice bundles, and performance. J. Oper. Management 21(2):129–149.Crossref, Google Scholar
- (2007) Defining and developing measures of lean production. J. Oper. Management 25(4):785–805.Crossref, Google Scholar
- (1999) Decoding the DNA of the Toyota production system. Harvard Bus. Rev. 77:96–108.Google Scholar
- (2016) Virtual schools: The changing landscape of k–12 education in the us. Edu. Inform. Tech. 21(6):1571–1581.Crossref, Google Scholar
- (2004) The impact of operational failures on hospital nurses and their patients. J. Oper. Management 22(2):151–169.Crossref, Google Scholar
- (2007) An empirical study of system improvement by frontline employees in hospital units. Manufacturing Service Oper. Management 9(4):492–505.Link, Google Scholar
- (2016) The impact of workaround difficulty on frontline employees’ response to operational failures: A laboratory experiment on medication administration. Management Sci. 62(4):1124–1144.Link, Google Scholar
- (2015) The effectiveness of management-by-walking-around: A randomized field study. Production Oper. Management 24(2):253–271.Crossref, Google Scholar
- (2008) Front-line staff perspectives on opportunities for improving the safety and efficiency of hospital work systems. Health Services Res. 43(5p2):1807–1829.Crossref, Google Scholar
- (2015) Funding Gaps 2015: Too Many States Still Spend Less on Educating Students Who Need the Most (Education Trust).Google Scholar
- (2007) The changing roles of teachers in an era of high-stakes accountability. Amer. Edu. Res. J. 44(3):519–558.Crossref, Google Scholar
- (2020) Covid-19, school closures, and child poverty: A social crisis in the making. Lancet Public Health 5(5):e243–e244.Crossref, Google Scholar
- (2014) Coordinating donors on crowdfunding websites. Proc. 17th ACM Conf. on Comput. Supported Cooperative Work & Social Comput. (ACM, New York), 38–48.Google Scholar
- (2022) Empowering education with crowdfunding: The role of crowdfunded resources and crowd screening. J. Marketing Res. 97–117.Google Scholar

