Request Username
Can't sign in? Forgot your username?
Enter your email address below and we will send you your username
Please ensure your text and figure source files meet our specifications below to avoid delays in the publication process.
The term “source file” is used to refer to the file saved with the software used to create it; this could apply to everything from LaTeX to Microsoft Office to Adobe’s Creative Suite. All files must have standard fonts embedded in the manuscript. No custom fonts should be used.
For more information on the publication process not related to file preparation see Frequently Asked Questions.
The text source file should be supplied as LaTeX or Microsoft Word. While the publication department does not require source files to be set in LaTeX, you must check the guidelines of the journal publishing your work. The LaTeX style files available for INFORMS authors also include instructions for setting figures and tables and formatting appendices and references. Some information about special math characters, bold symbols, and equation numbering styles is also presented.
TeX, LaTeX: LaTeX is a document markup language and document preparation system for the TeX typesetting program. While it is not a requirement to provide your manuscript set in LaTeX, it is encouraged when there is extensive math content and is required by some editors in chief. INFORMS provides LaTeX templates of all INFORMS journals. The software is available for free at http://www.latex-project.org/lppl/.
Microsoft Word: There are several versions of this word-processing software, and the presentations of the files tend to vary by computer. When sending any word processing file, it should be accompanied by a PDF.
Failure to prepare figures properly will delay the production of your article. Take the time to review the information below to ensure your important work gets out to the OR/MS community in a timely fashion. You may be contacted by the production editor or someone from our composition team requested that you revise or replace a figure.
With the variety of graphic creation software, we realize these recommendations are not always possible to achieve. If you have questions on any of these topics, please contact the production editor of the journal in which your paper has been accepted.
Original images must be supplied with a resolution of 300 dpi and will be converted to CMYK or grayscale. Original graphs and drawings should be supplied as vector graphics that can be edited as needed by the composition team. If you do not have the right to transfer the copyright of a figure, please review Rights and Permissions.
EPS (Encapsulated Postscript): Charts, graphs, drawings. A maximum size of 1 megabyte.
TIFF: Photographs and screenshots.
PDF (for Images, Graphs): Set as high quality to ensure fonts are embedded and image quality is maintained at 600 dpi or higher. This file should be editable and not be provided as bitmap.
MS Word, Power Point: Charts and graphs. Authors should ensure that the figures are part of the accepted PDF file for comparison.
Adobe Illustrator: Layers should be flattened.
Microsoft Excel: Provide editable a PDF of the graph(s) or figure(s). The Excel file should also be supplied to achieve the best results.
By default all figures will be converted to grayscale for the print copy. If your figures are in color for online, it is important to consider how well the image(s) will convert. If color is deemed as the best way to communicate the information in the figure, the journal’s editorial office must first notify the production editor, who will in turn, notify you of the cost. Authors are responsible for color charges for each color page before the article may print in an issue.
Use standard fonts, e.g., Arial, Times, or Helvetica.
Your monitor is an RGB device, which means that the colors on your monitor are produced using red, green, and blue. This produces vivid colors that are clear and distinguishable. All colors used in your figures must convert to black and white for the print version of your paper, unless you are paying for color in the print version. Figures with components that display a clear difference in color may appear very similar to each other when converted to gray (see samples below). This is true for both line and halftone images. Certain colors may not reproduce well in print.
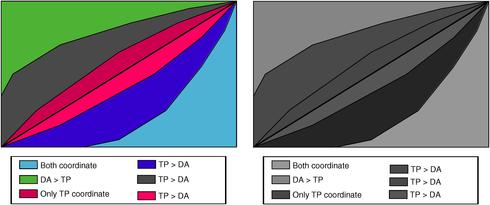
Authors should check the results of such a conversion prior to submission. Authors should always print their papers in black and white to see how their figure will appear in the print version.
Authors will not be allowed to submit color figures to replace black and white figures after their paper is in production.
To capture the screenshot that you want reproduced for your paper, please follow these suggestions. Before using the method for capturing the screenshot enlarge the screen to the biggest possible size of your screen. The screenshot can be put in a separate file for us to process and resize.
Unless you have proper software for capturing screenshots, we recommend the open source and very versatile suite IrfanView. You can download it at the following link: www.irfanview.net. Download IrfanView itself and its free plug-ins. To install, just run the downloaded executable files.
Here is how the capture process with IrfanView works. Click on the (red) IrfanView icon and go to Options > Capture/Screenshot. Make choices as shown (with your own choice of destination directory).
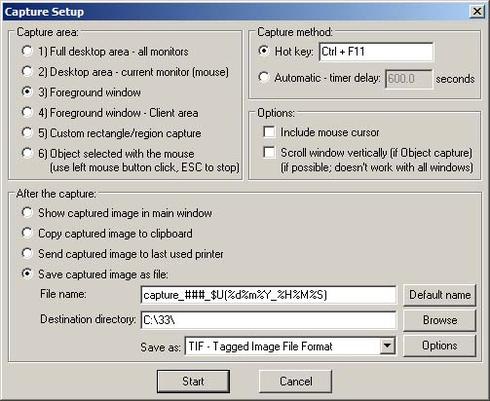
After pressing “Start”, IrfanView will minimize itself to the taskbar and after you choose the proper frame on your screen to make a screenshot, press Ctrl+F11 to get the resulting file in your chosen destination directory. The file name will be of the form capture_###_$U(%d%m%Y_%H%M%S).tif, reflecting the date and exact time of the screenshot. Rename it accordingly. Choice of TIF over JPG allows to preserve as much detail as possible because TIFF is a lossless format, so the best your screen can produce will be captured there and available for further processing.