Request Username
Can't sign in? Forgot your username?
Enter your email address below and we will send you your username
INFORMS provides a range of metrics to help readers, authors, reviewers, and editors understand the reach, visibility, and editorial performance of each journal. These indicators reflect our commitment to transparency in scholarly publishing and to continuous improvement in editorial quality and timeliness. We encourage all members of our research community to consider multiple indicators, as no single metric fully captures a journal’s influence or quality.
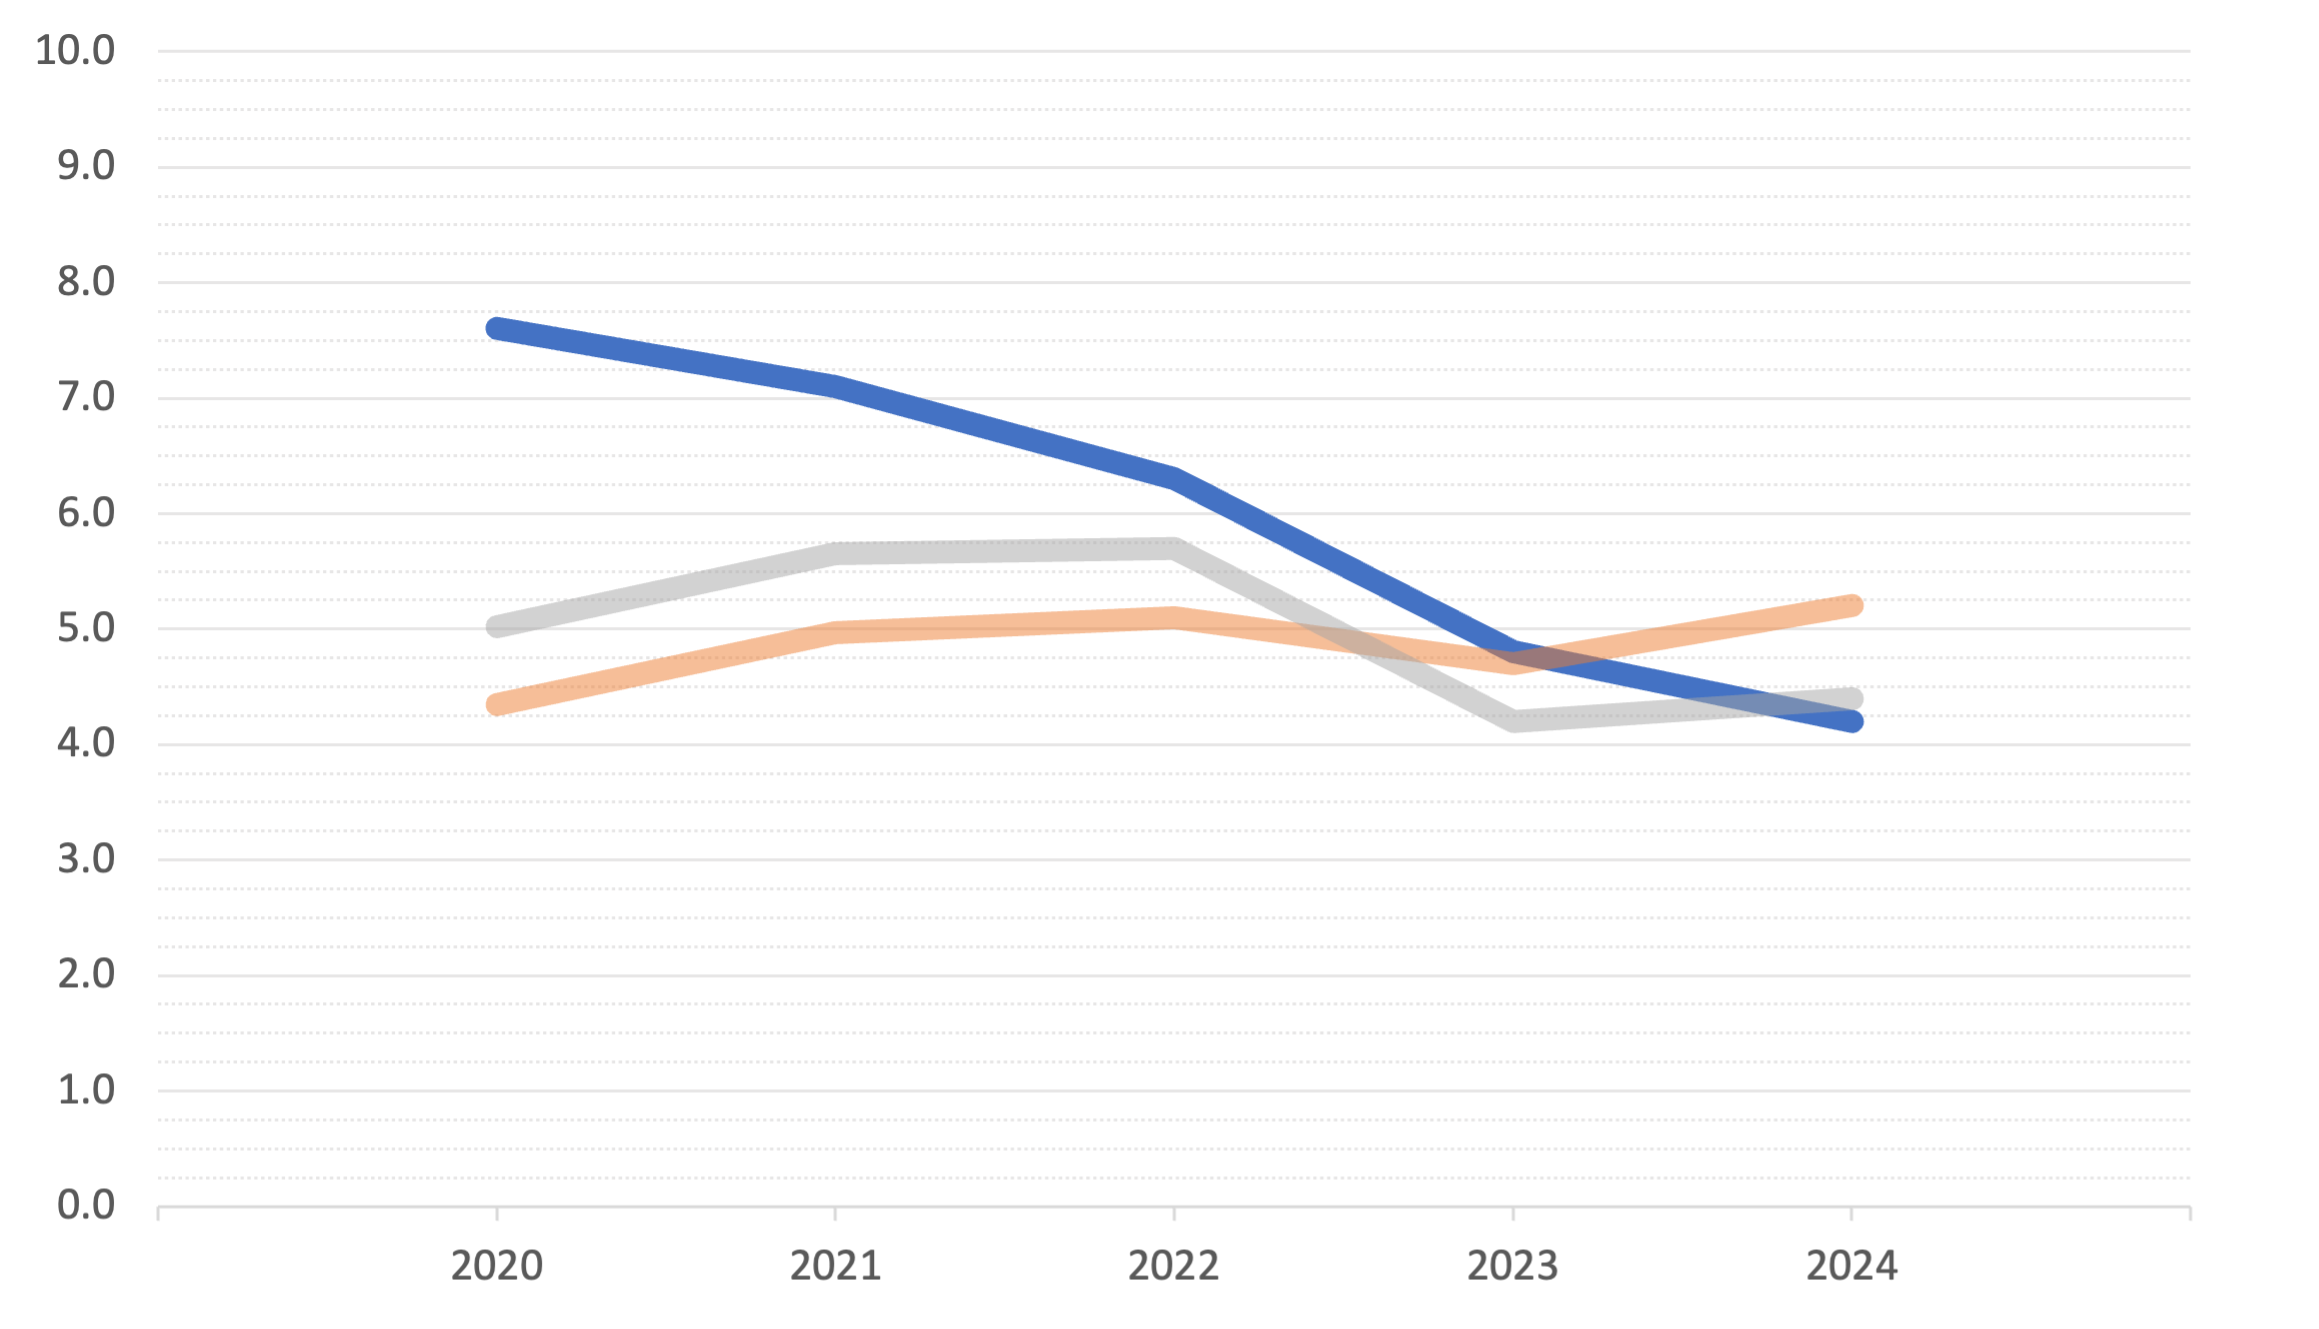
The below chart displays Manufacturing & Service Operations Management’s (MSOM's) impact factor (blue) during the past five years, as reported by Clarivate’s Journal Citation Reports®, alongside the aggregate impact factor for each category in which MSOM is indexed: Science Citation Index Expanded® (SCIE) category OPERATIONS RESEARCH & MANAGEMENT SCIENCE (orange) and Social Science Citation Index® (SSCI) category MANAGEMENT (gray).
The journal impact factor is defined as the average number of times articles from the journal published in the past two years have been cited in the reporting year, calculated for example as:
| Citations received in 2024 to articles published in 2022 and 2023 |
| Number of citable items published in 2022 and 2023 |
Manufacturing & Service Operations Management (MSOM) is indexed within the Web of Science™ Science Citation Index Expanded® (SCIE) in the category of OPERATIONS RESEARCH & MANAGEMENT SCIENCE and the Social Science Citation Index® (SSCI) in the category of MANAGEMENT. The below tables report MSOM’s rank within each of these categories during the past five years (with the current year highlighted in orange).
| Year | Rank (Quartile) |
|---|---|
| 2024 | 28 / 106 (Q2) |
| 2023 | 18 / 106 (Q1) |
| 2022 | 14 / 86 (Q1) |
| 2021 | 12 / 87 (Q1) |
| 2020 | 4 / 84 (Q1) |
| Year | Rank (Quartile) |
|---|---|
| 2024 | 121 / 420 (Q2) |
| 2023 | 90 / 407 (Q1) |
| 2022 | 65 / 227 (Q2) |
| 2021 | 54 / 228 (Q1) |
| 2020 | 29 / 226 (Q1) |
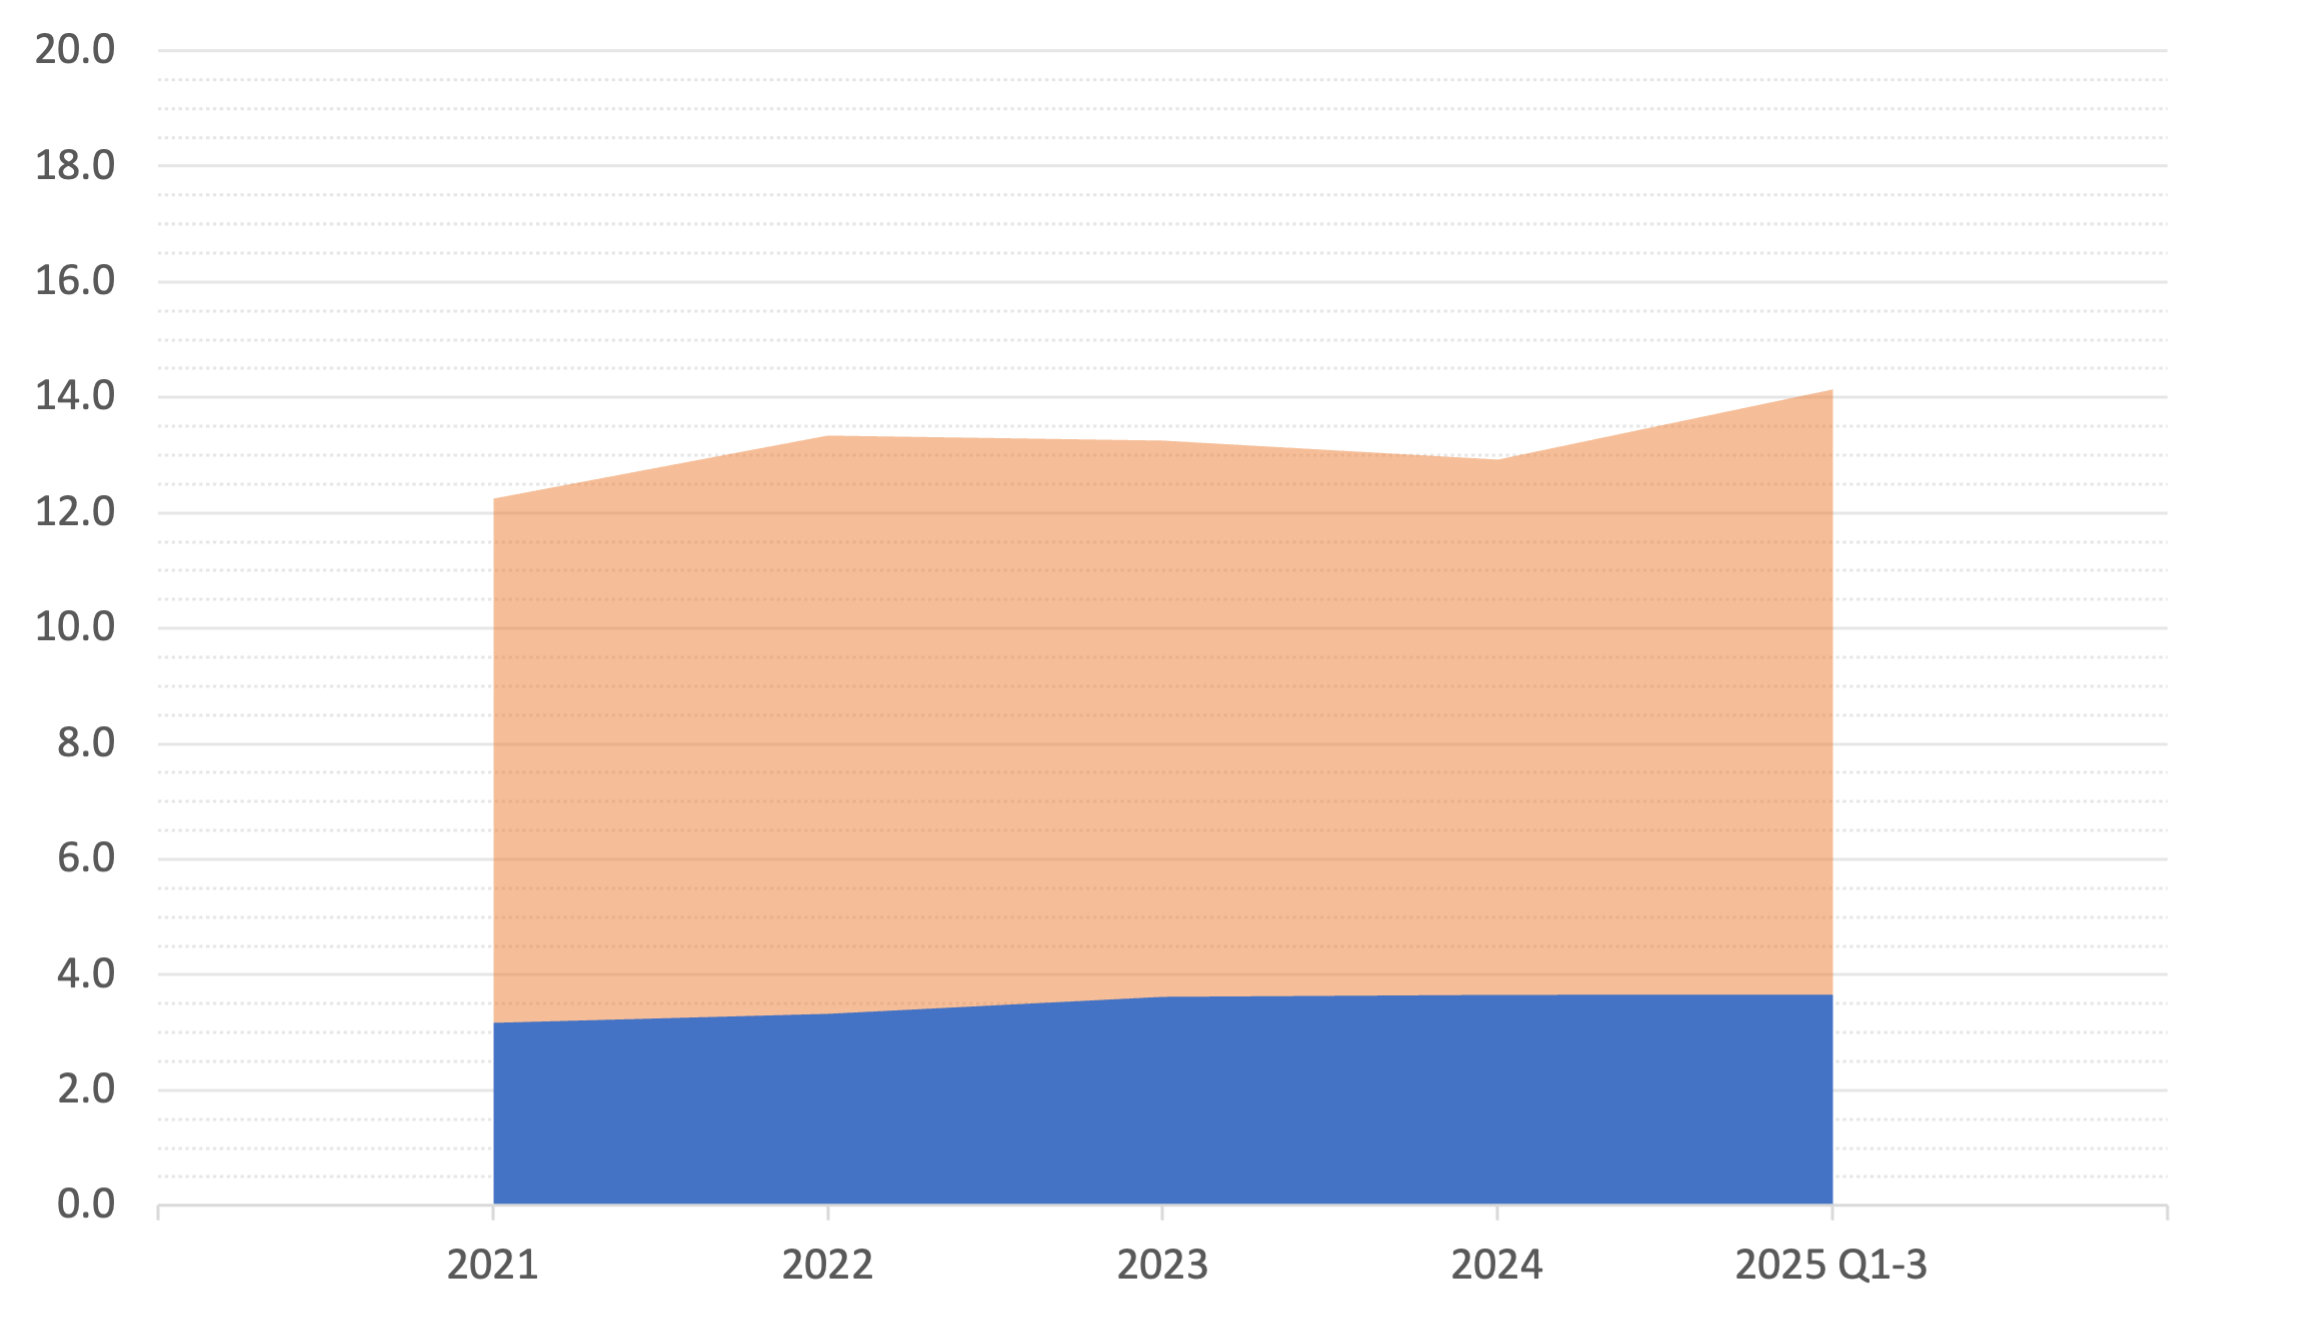
The below chart displays the average time (in months) for a paper to reach first decision (blue) and final decision (orange) for all articles sent for external review and decided within the reporting period.